⚽ World Cup 2026 in Six Maps: Money, Talent, Brands and Global Attention
A World Cup begins long before the first whistle.
It begins in search bars, transfer markets, neighborhood academies and factories producing millions of national-team shirts. The tournament may happen inside stadiums, but its real geography stretches across the entire planet.
These six World Cup 2026 maps reveal different layers of that global system: where football attracts the most attention, which countries export the most players, how squad value relates to performance and which sportswear brands dominate the tournament.
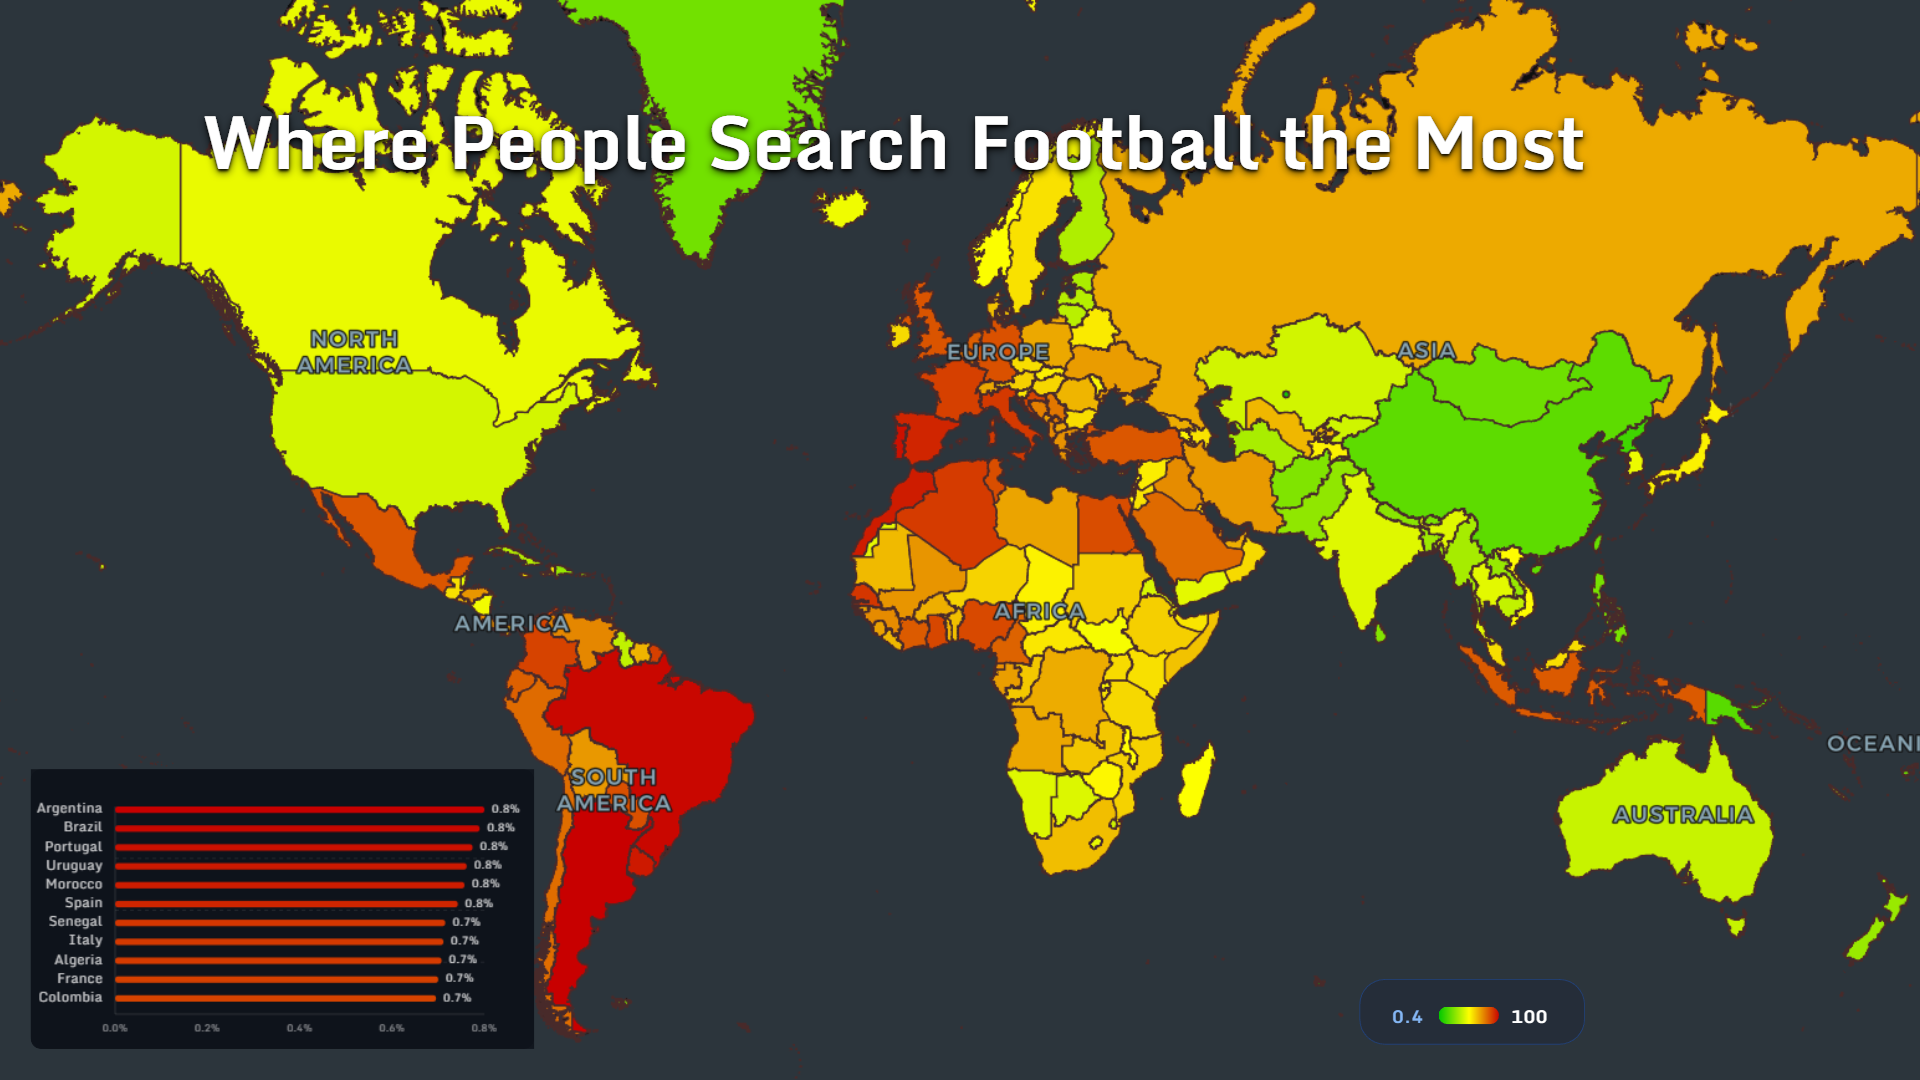
Where People Search for Football the Most in 2026
Football interest is global, but it is not distributed evenly.
Argentina, Brazil, Portugal, Uruguay, Morocco and Spain occupy the top group in this dataset, each reaching approximately 0.8% of the measured search share. Senegal, Italy, Algeria, France and Colombia follow closely at around 0.7%.
The narrow gap between the leading countries is important. This is not a map with one dominant market and a long list of distant followers. It shows several distinct football cultures operating at a similarly intense level.
South America remains the clearest concentration of football attention. Argentina, Brazil and Uruguay combine recent international success with deeply embedded domestic football cultures. In these countries, football is not simply watched. It becomes part of family identity, city rivalry and national storytelling.
The Iberian Peninsula forms another strong cluster. Portugal and Spain combine successful national teams, globally visible domestic leagues and players followed by international audiences.
Morocco, Senegal and Algeria show the strength of football interest across North and West Africa. Their presence near the top suggests that the geography of online football attention is broader than the traditional European and South American centers.
This football search interest map for 2026 captures something that stadium attendance alone cannot: the everyday curiosity surrounding the game.
The Countries Searching for the World Cup Without a Team
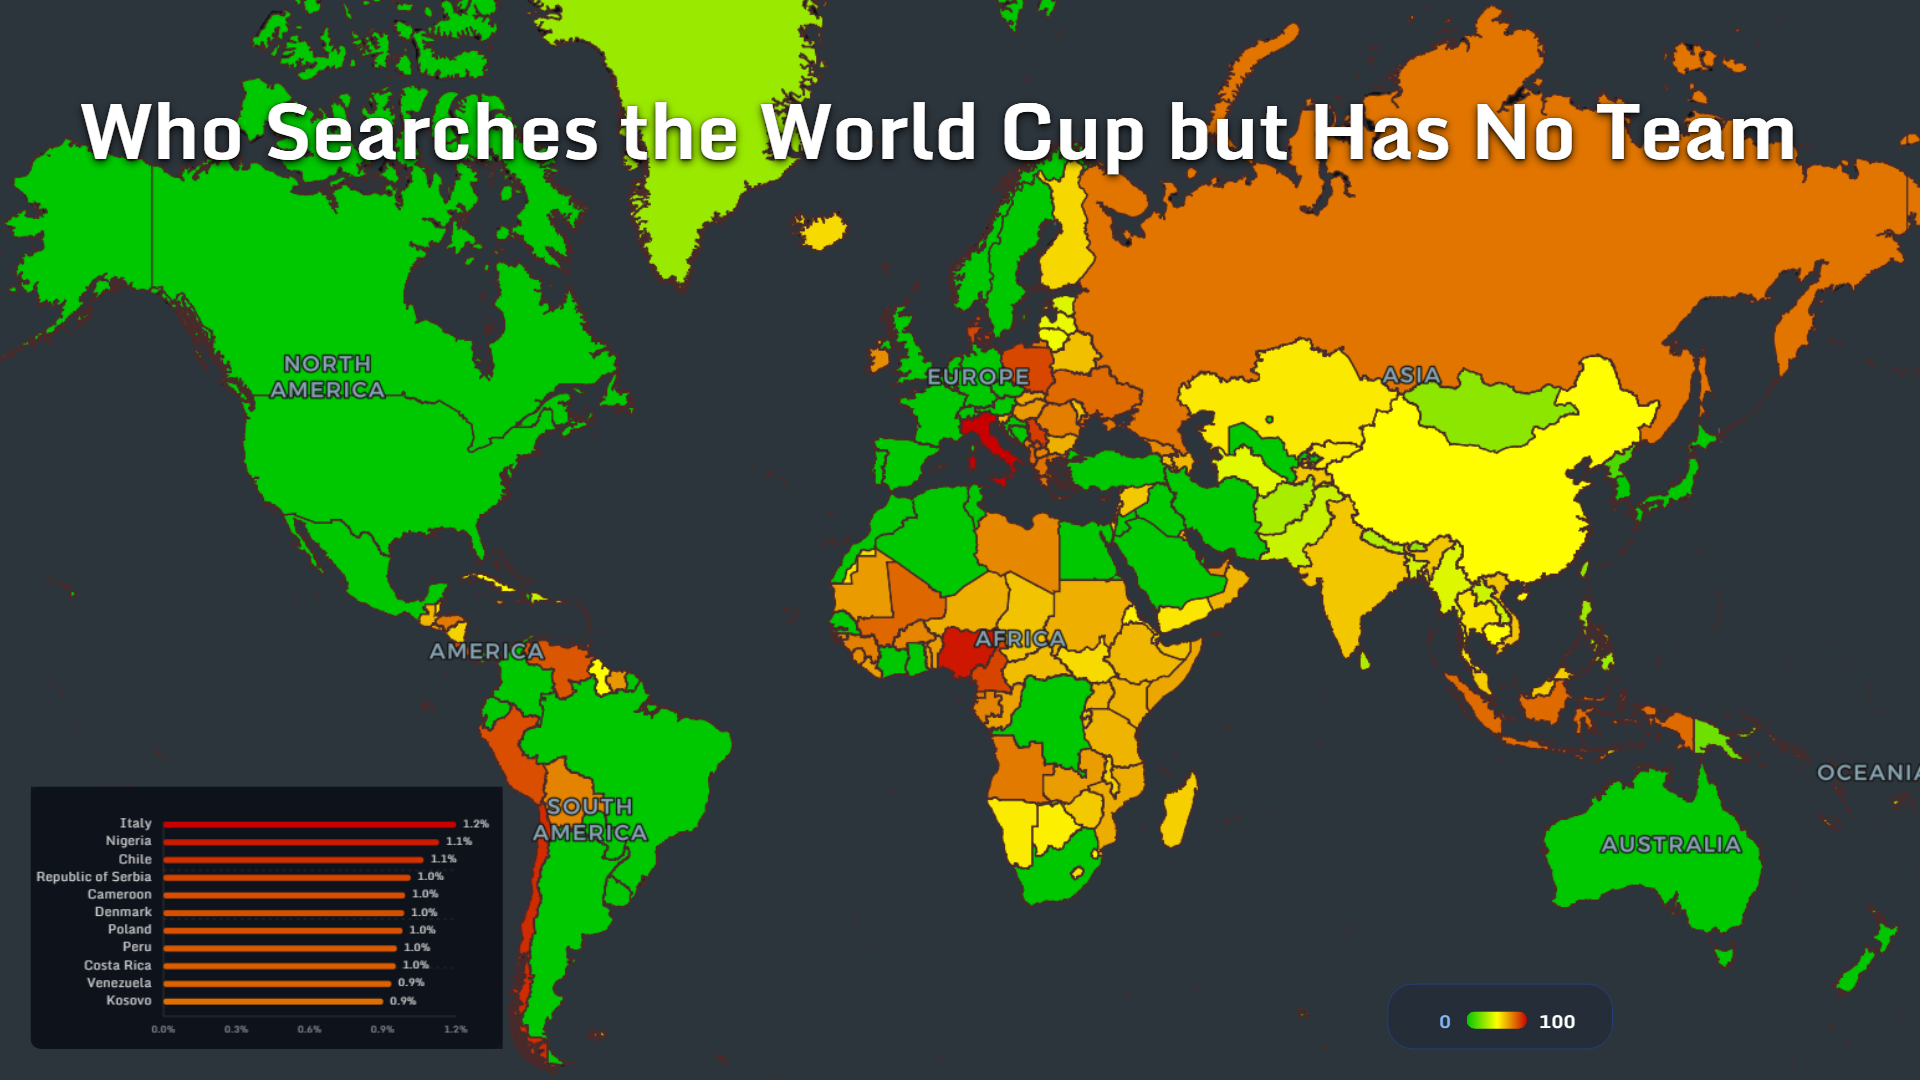
One of the most revealing maps is not about the teams taking part. It is about the countries watching from outside.
Italy leads the ranking of non-participating countries by search interest at 1.2%. Nigeria and Chile follow at 1.1%, while Serbia, Cameroon, Denmark, Poland, Peru and Costa Rica each register approximately 1.0%. Venezuela and Kosovo remain close behind at 0.9%.
The map exposes a simple truth: qualification determines participation, but it does not determine emotional involvement.
A country can miss the tournament and still generate enormous public attention. Supporters may follow neighboring countries, adopted teams, favorite club players or simply the drama of the competition itself.
Italy’s position is especially striking. Its presence at the top of the ranking demonstrates how deeply World Cup identity can persist even when the national team is absent from the tournament dataset.
Nigeria and Cameroon represent another important pattern. Both are major football cultures with large domestic and international audiences. Their supporters remain part of the World Cup conversation regardless of qualification status.
For broadcasters, journalists and brands, these countries are not secondary markets. They are active audiences without a home team, and that can make their behavior more fluid. Attention may shift between individual stars, regional rivals and unexpected underdogs.
The World Cup audience is therefore much larger than the list of participating nations.
The Most Expensive Squads at World Cup 2026
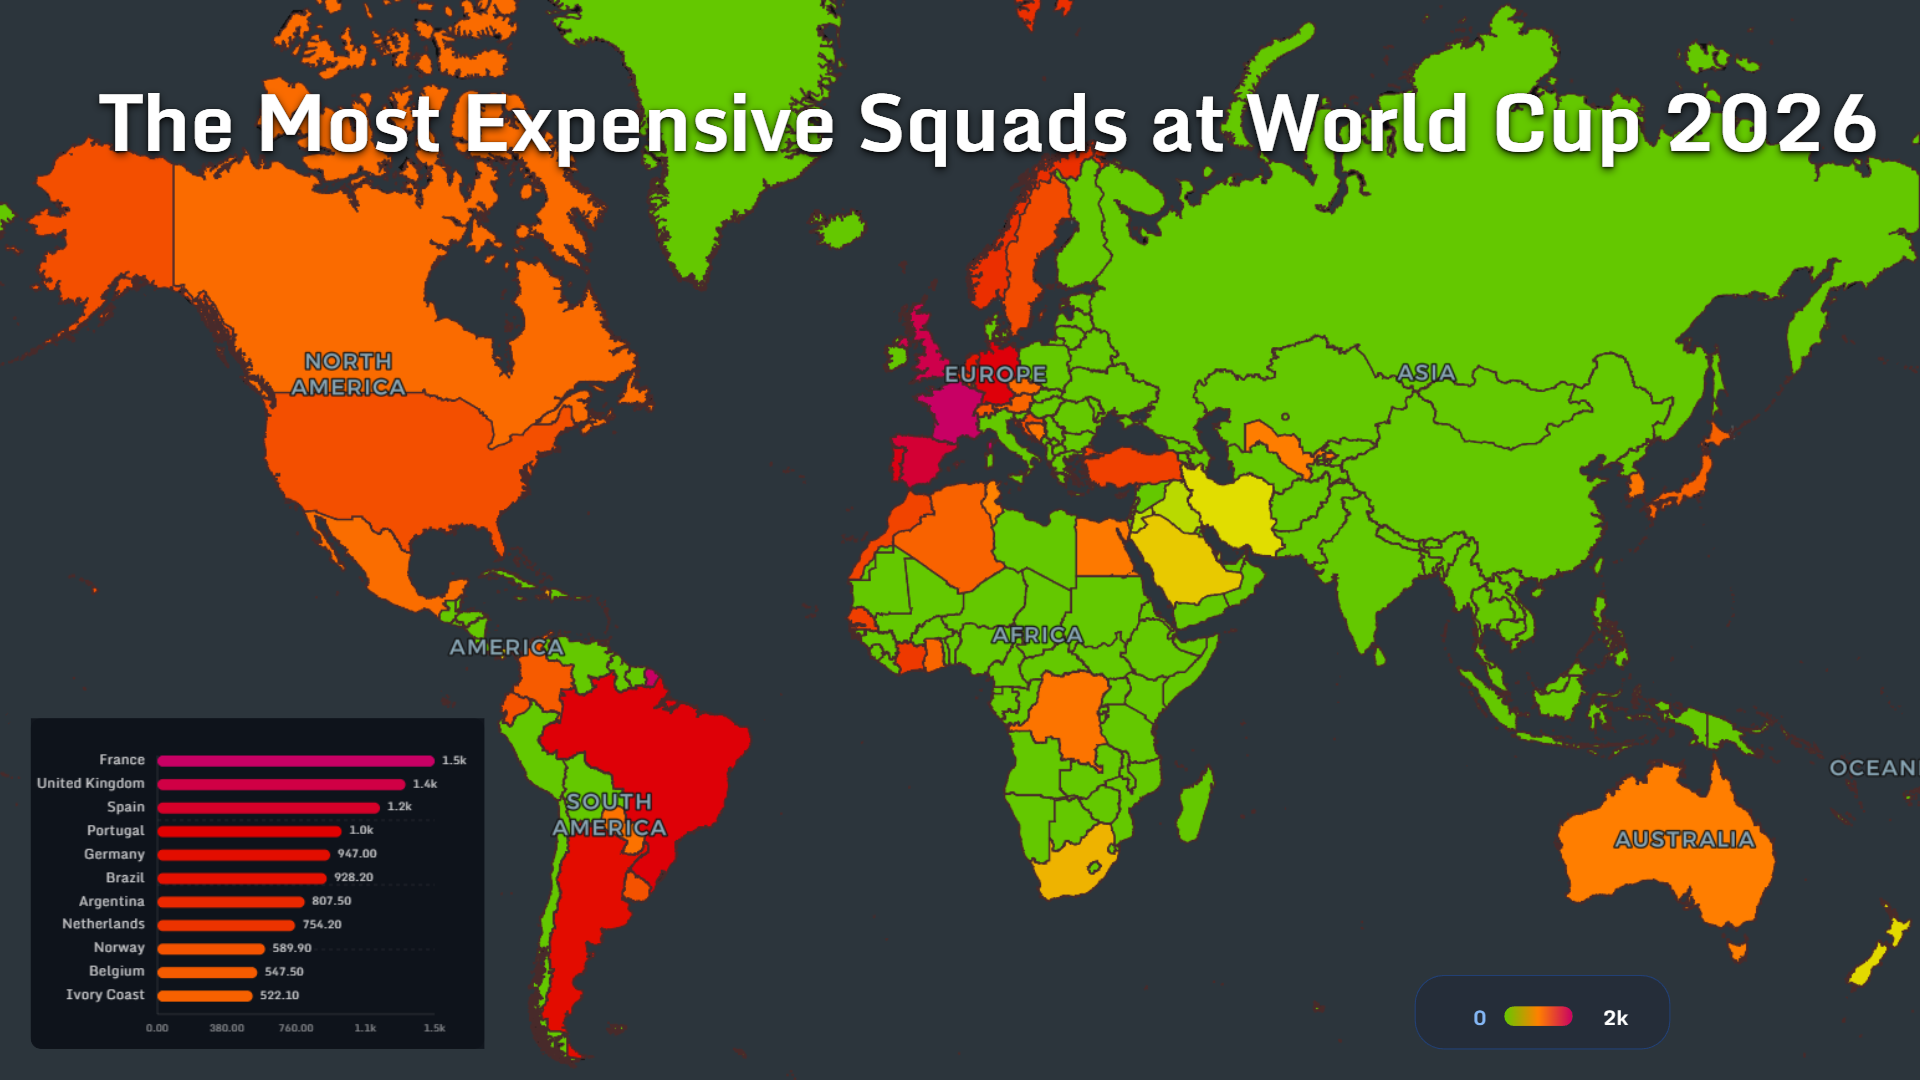
Squad valuation provides a map of football’s accumulated capital.
France leads the dataset at 1.5k on the map’s valuation scale, followed by the United Kingdom at 1.4k, Spain at 1.2k and Portugal at 1.0k.
The next group includes:
- Germany: 947.0
- Brazil: 928.2
- Argentina: 807.5
- Netherlands: 754.2
- Norway: 589.9
- Belgium: 547.5
- Ivory Coast: 522.1
France’s mapped valuation is nearly 1.9 times Argentina’s and almost three times that of Ivory Coast. Yet those differences do not translate directly into the same differences on the pitch.
Brazil and Argentina remain among the strongest football nations despite sitting below several European squads by total valuation. Their competitive strength comes from more than market price: tactical continuity, tournament experience and cultural familiarity with high-pressure matches all matter.
Norway’s position is also notable. A national team can reach a high valuation through a smaller number of exceptionally valuable players, even without the same depth or tournament history as France, Germany or Brazil.
The World Cup 2026 squad value map should therefore be read as a map of financial expectations, not guaranteed outcomes.
Do Expensive Teams Actually Produce Better Results?
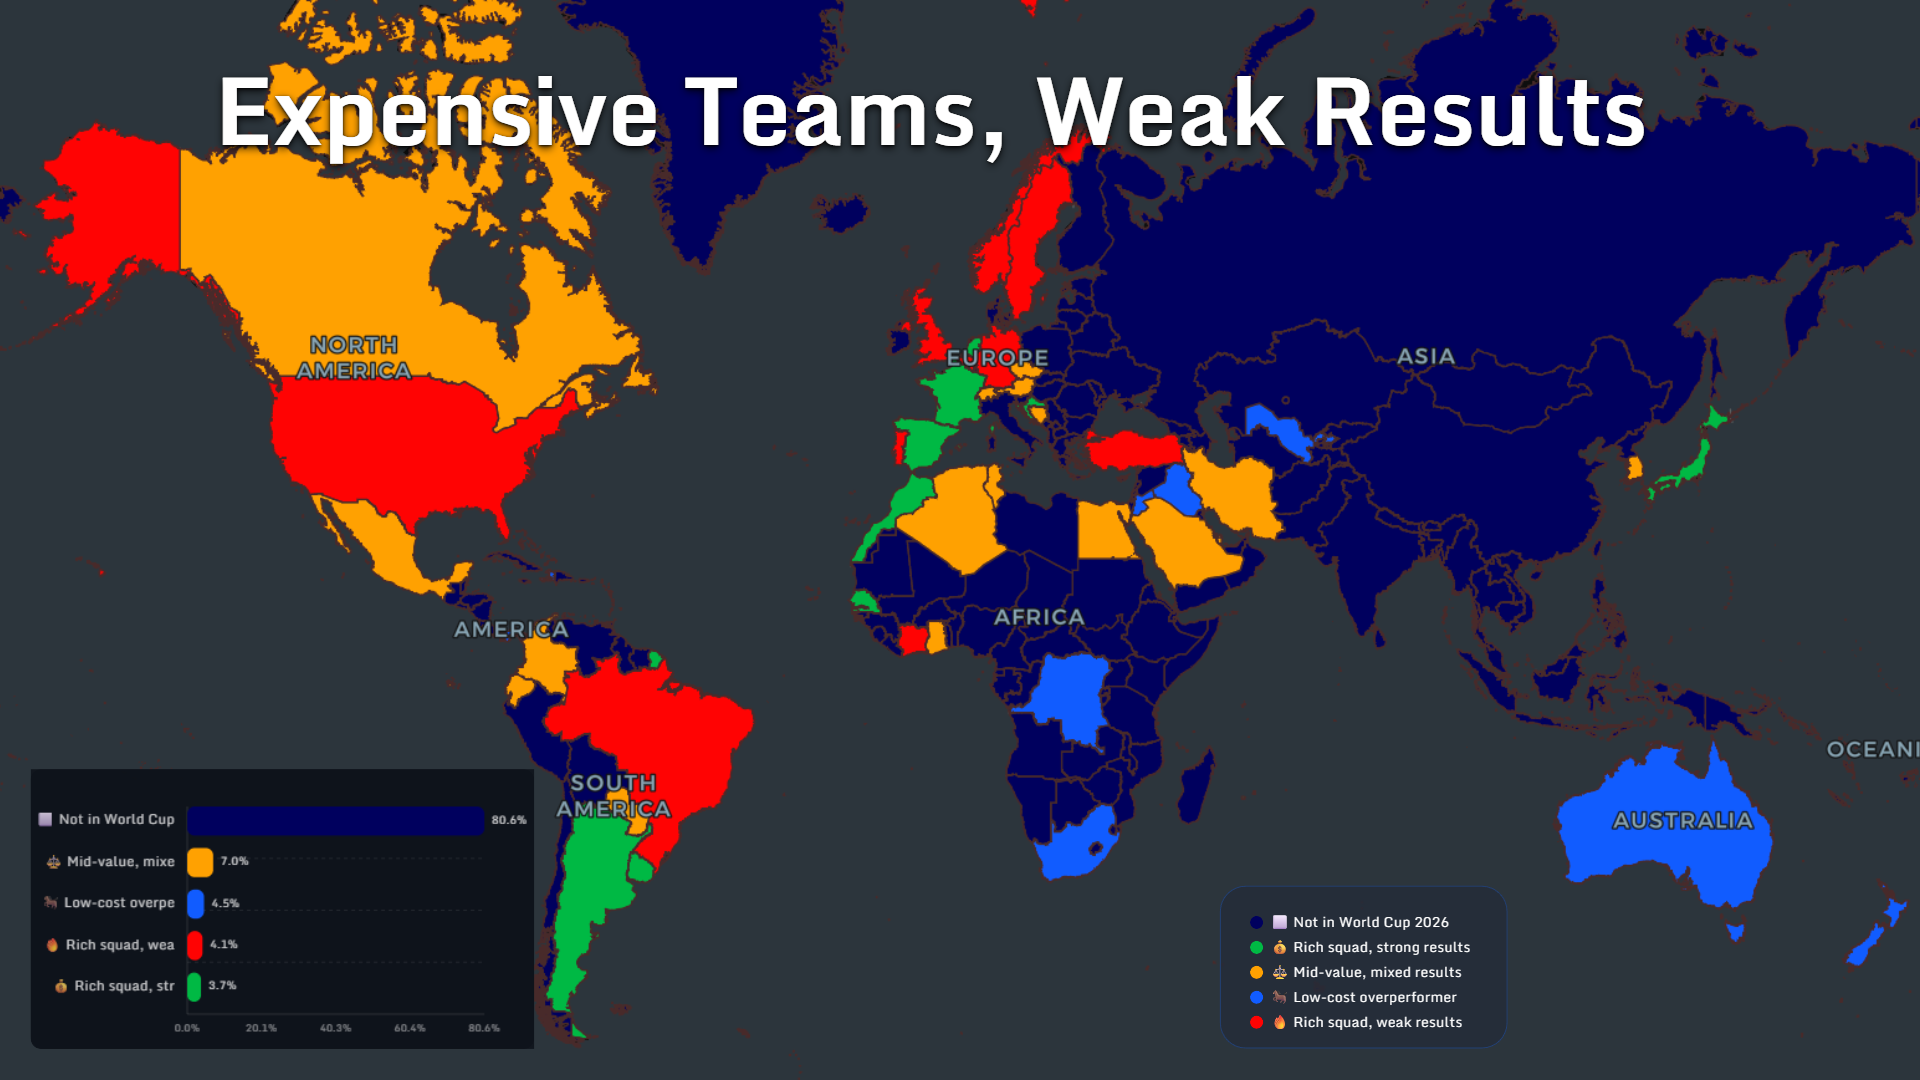
Money increases the range of options available to a team. It does not remove uncertainty.
This map divides countries into four broad performance and valuation groups:
- Mid-value teams with mixed results: 7.0%
- Low-cost overperformers: 4.5%
- Rich squads with weak results: 4.1%
- Rich squads with strong results: 3.7%
Once non-participants are excluded, mid-value teams with mixed records form approximately 36% of the participating segment. Low-cost overperformers account for roughly 23%, rich but underperforming squads about 21%, and rich teams producing strong results around 19%.
That means expensive and successful teams are not even the largest category.
This is one of football’s permanent tensions. Wealth creates depth, but depth also creates difficult decisions. Coaches must manage competing stars, tactical roles, public pressure and limited preparation time.
Less expensive teams often arrive with clearer hierarchies. Their players may have spent more time together, understand their roles better and face less pressure to dominate every match.
The blue countries on the map, representing lower-cost overperformers, may be the most interesting teams to follow. They show where organization, tactical discipline and collective confidence are producing more than market valuation would predict.
The classification should be interpreted as a snapshot of recent or pre-tournament performance, rather than a statement about the final World Cup result. Tournament football remains unusually sensitive to a single mistake, penalty or moment of individual brilliance.
Which Countries Export the Most Football Talent?
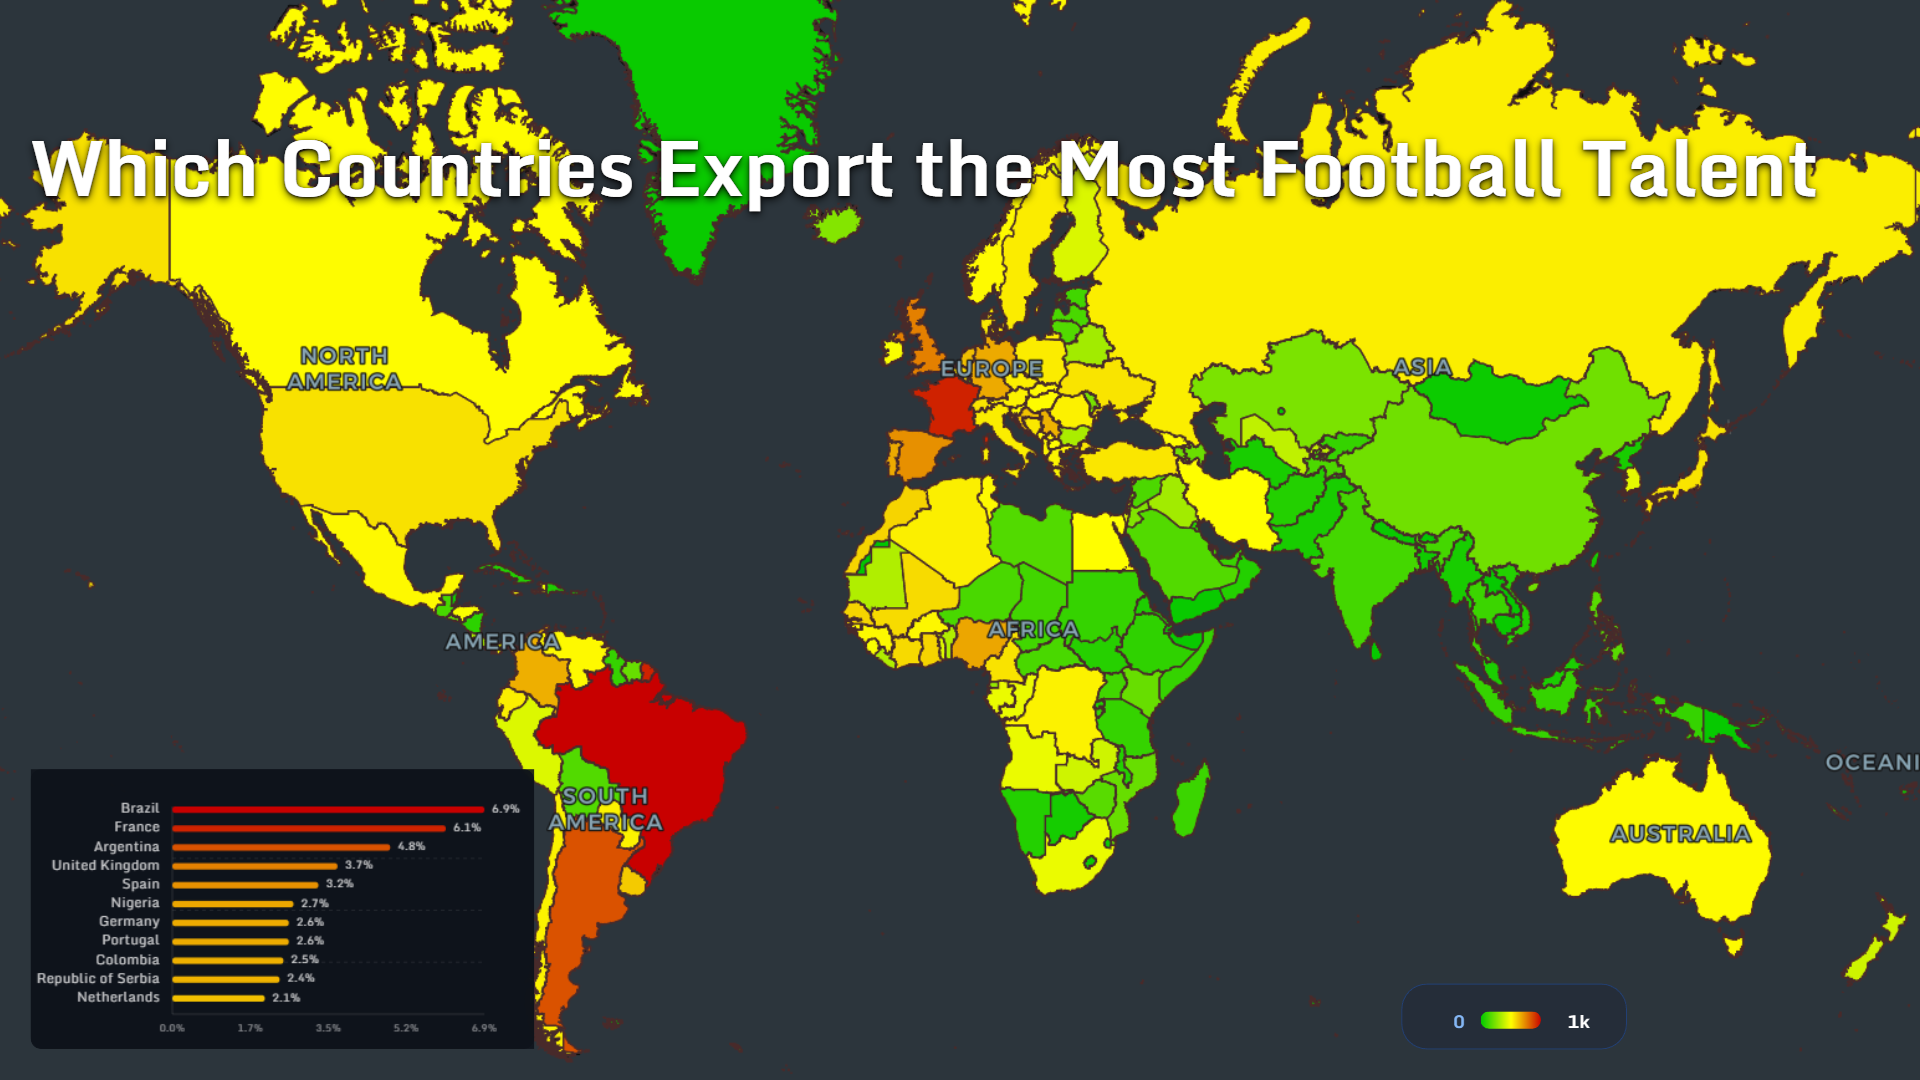
A national team shows where players represent their country. The transfer market shows where football labor actually travels.
Brazil leads the mapped export ranking with 6.9%, narrowly ahead of France at 6.1%. Argentina follows at 4.8%.
The remaining leading exporters are:
- United Kingdom: 3.7%
- Spain: 3.2%
- Nigeria: 2.7%
- Germany: 2.6%
- Portugal: 2.6%
- Colombia: 2.5%
- Serbia: 2.4%
- Netherlands: 2.1%
Brazil’s position reflects a football development system that extends from informal local games to professional academies and an enormous network of international scouts. Brazilian players appear across nearly every level of the global professional game.
France combines elite academies, strong suburban football cultures and development networks connected to both Europe and Africa. Its football influence is visible not only through the national team, but through players developed in France who compete across dozens of leagues.
Argentina, Portugal, Serbia, Colombia and the Netherlands demonstrate another model: countries whose influence on global football is much larger than their population or domestic league revenue might suggest.
Nigeria’s place among the leaders confirms Africa’s importance to the international player market. African football is frequently discussed through national-team tournaments, but its deeper economic role lies in the constant movement of players into European, Asian, Middle Eastern and American leagues.
This football talent export map is ultimately a map of infrastructure: academies, scouts, agents, migration routes and the ability to turn local ability into international opportunity.
Adidas vs Nike vs Puma: Who Owns the World Cup?
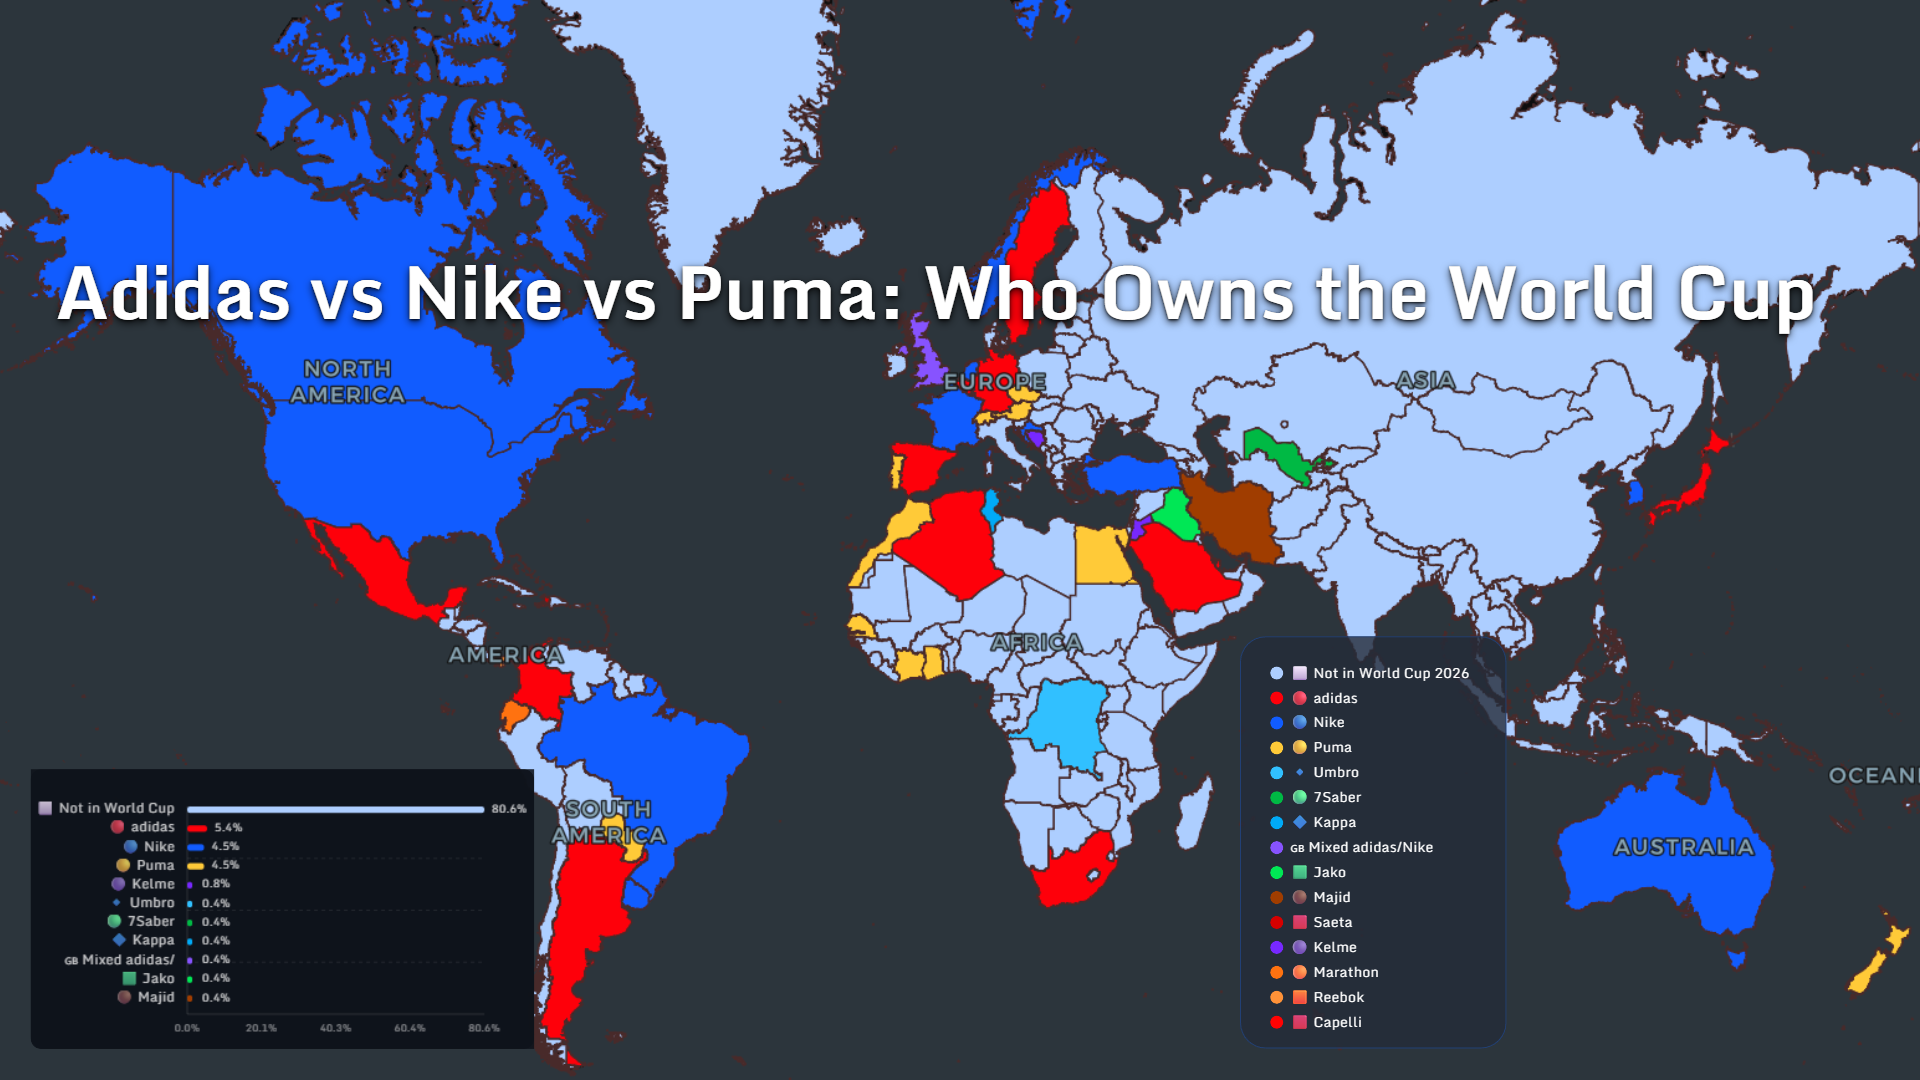
National-team kits are among the most visible commercial surfaces in sport.
Adidas leads the mapped supplier distribution at 5.4% of all countries. Nike and Puma are tied at 4.5% each.
Because countries outside the tournament account for 80.6% of the full map, the participating segment represents 19.4%. Within that segment, Adidas, Nike and Puma collectively account for approximately three-quarters of the mapped kit market.
Adidas maintains a narrow advantage, but the broader picture is one of three-brand dominance rather than a single winner.
Nike’s presence includes some of football’s largest consumer markets. Puma continues to compete through a mix of established national teams and strategically important regional partnerships.
Smaller suppliers such as Kelme, Umbro, Kappa, Jako, 7Saber, Majid, Saeta, Reebok and Capelli occupy limited but meaningful territory. For these brands, a national-team contract can deliver visibility that would be difficult to achieve through conventional advertising.
The commercial competition is not only about how many teams each company supplies. It is also about which teams progress, which shirts become culturally memorable and which players create defining tournament images.
One unexpected run can transform a relatively small kit agreement into a global marketing event.
What These World Cup 2026 Maps Reveal
Viewed separately, each map tells a different football story.
Viewed together, they reveal a connected global system.
Search interest shows where attention is concentrated. Squad values show where financial expectations accumulate. Talent exports reveal the countries supplying the wider football economy. Kit contracts map the brands competing to turn national identity into global consumer demand.
The most important lesson is that these geographies do not perfectly overlap.
The countries producing the most players are not always those with the most expensive national teams. The richest squads do not always deliver the strongest results. Some of the most engaged audiences belong to countries without a team in the tournament.
Football remains global precisely because no single map can fully explain it.
MAPTHOS makes it possible to combine these layers, compare countries and turn complex datasets into visual stories that can be understood at a glance.
👉 Explore more at app.mapthos.org
See the world. Map better. Dream big. 🌍✨