⚽ The Business Behind the 2026 World Cup in Six Maps
A World Cup is measured in goals, saves and unforgettable nights.
But beneath the noise of the stadium sits another tournament: one shaped by corporate budgets, security operations, airline routes, hotel prices and the geography of global advertising.
The 2026 edition turns that hidden machinery into something unusually large. Three host countries create one interconnected event economy stretching across North America, while sponsors and supporters arrive from almost every part of the world.
These six World Cup 2026 business maps reveal where the money, attention and environmental costs are concentrated.
> Data note: Figures in this article are reproduced from the supplied MAPTHOS datasets. Where a map does not display a currency or measurement unit, values are reported using the original chart scale rather than assigning an unsupported unit.
Official World Cup Sponsors Form a Small Global Club
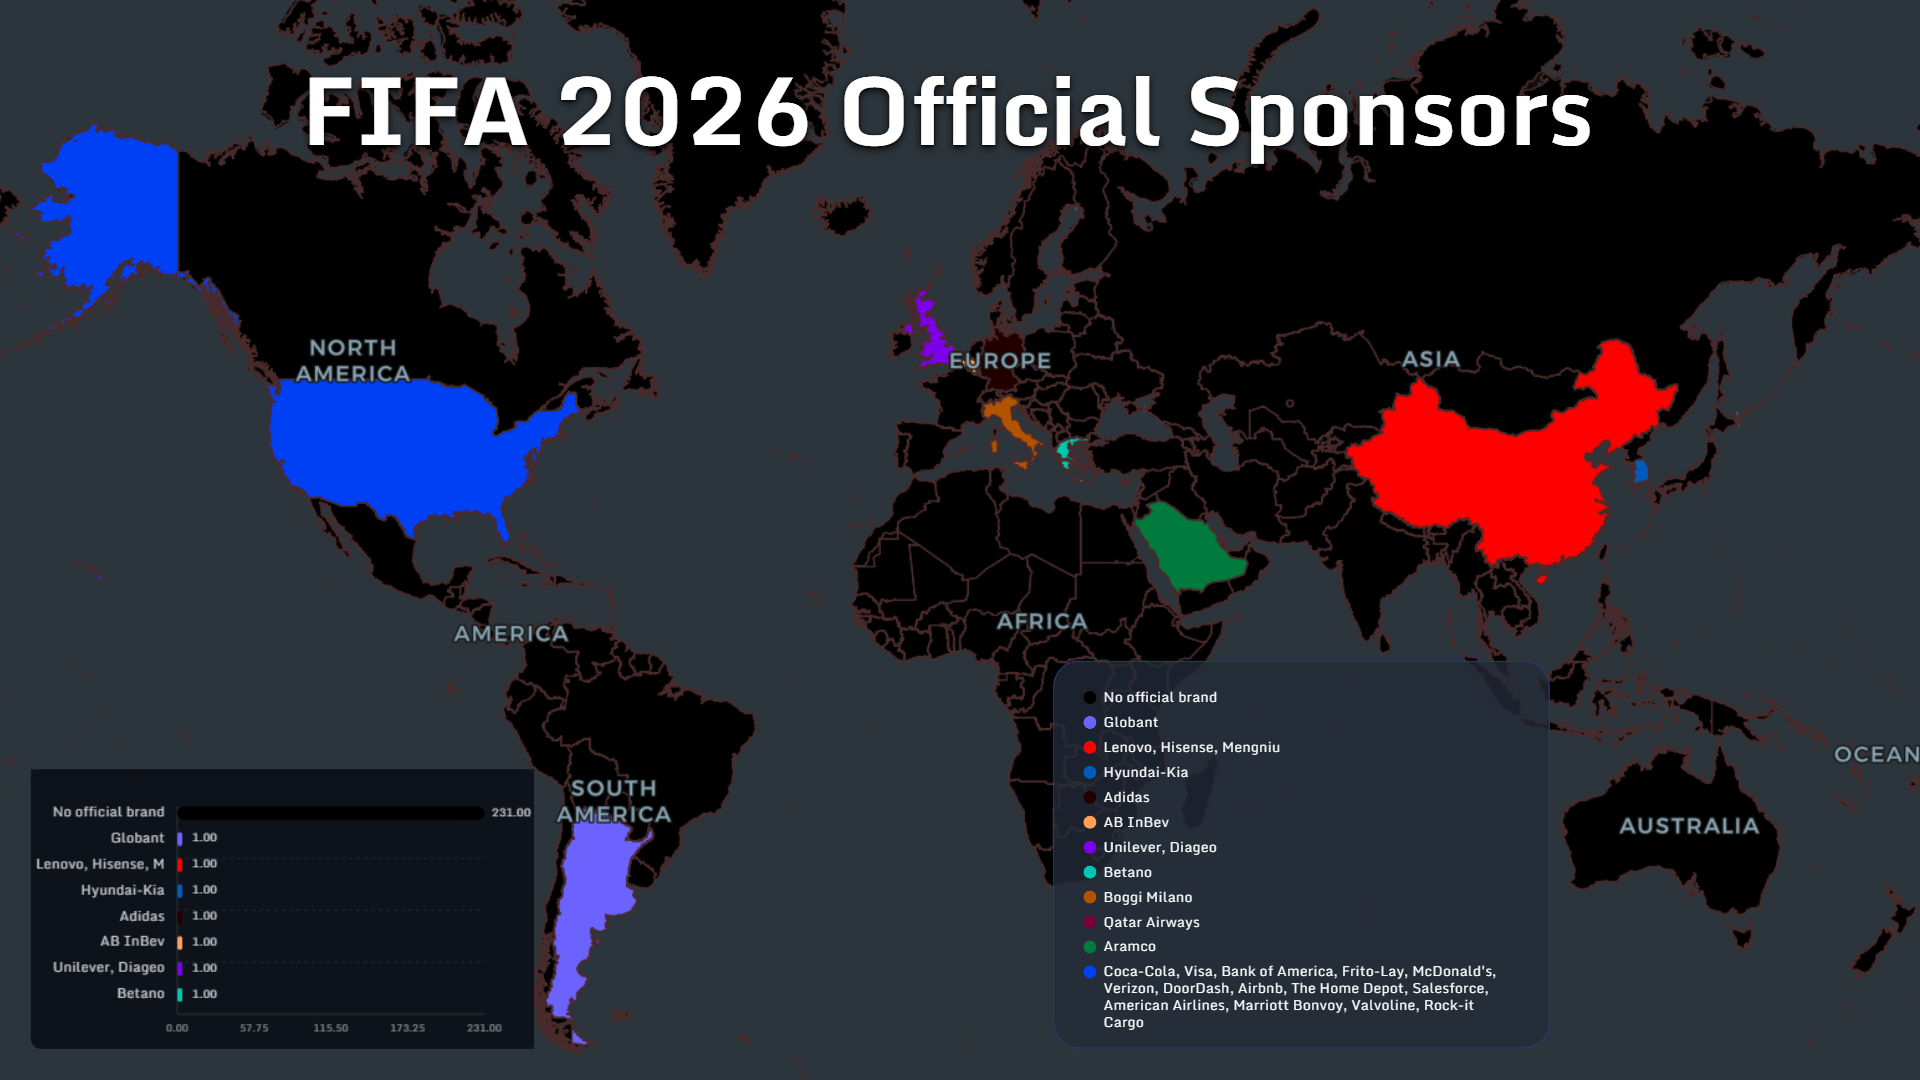
The first map looks almost empty.
Most of the world is shown in black, representing 231 map entries without an official sponsor brand assigned to them. Against that dark background, a small number of countries emerge as the corporate centers of the tournament.
The United States contains the largest collection of mapped brands, including companies associated with payments, food, travel, technology, hospitality and consumer services.
China is represented by Lenovo, Hisense and Mengniu. Other visible sponsor origins include South Korea through Hyundai-Kia, Germany through Adidas, Saudi Arabia through Aramco and Qatar through Qatar Airways.
The pattern is not simply about where football is most popular. It reflects where multinational companies with sufficient marketing scale, global distribution and consumer reach are headquartered.
A company does not need to come from a traditional football superpower to become part of the tournament. It needs the capacity to use the World Cup as a global communications platform.
The United States Dominates the Sponsor-Country Map
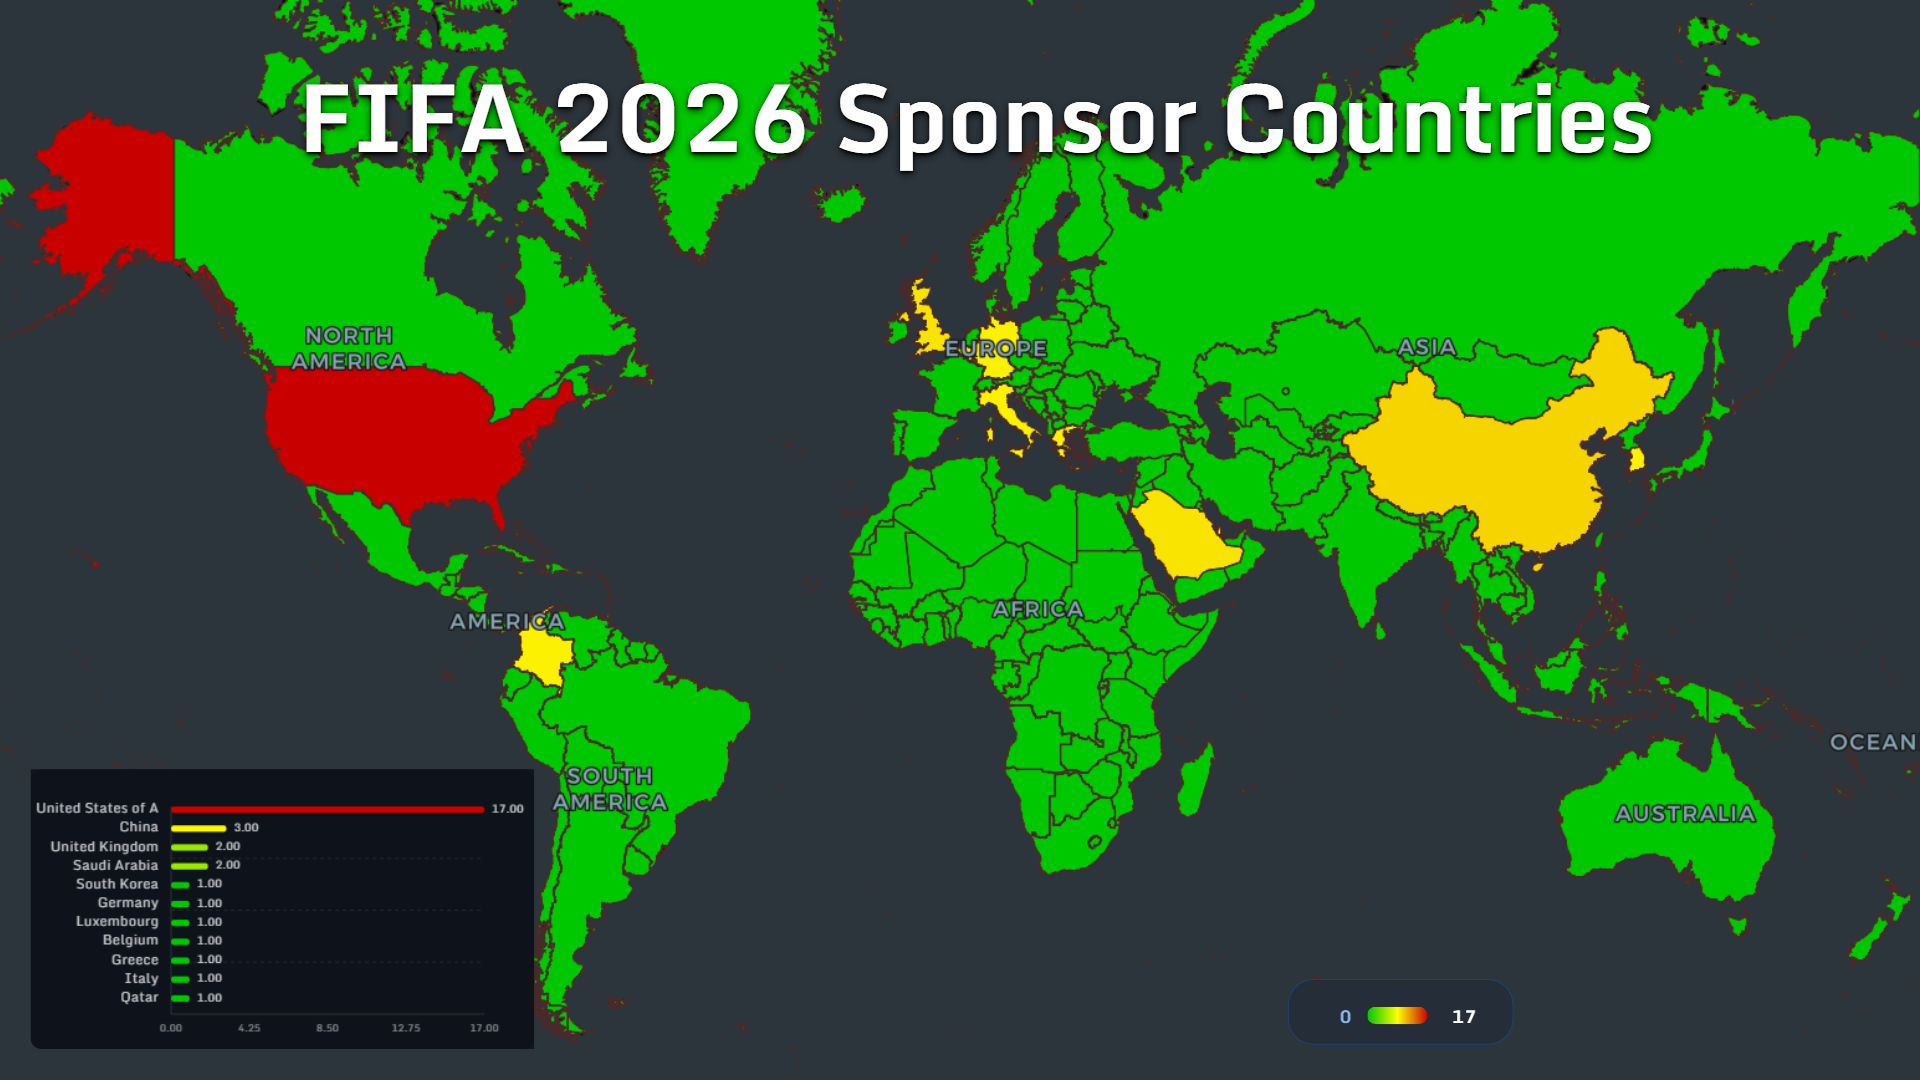
The sponsor-country map makes that concentration easier to measure.
The United States leads with 17 sponsor entries. China follows with 3, while the United Kingdom and Saudi Arabia each record 2.
South Korea, Germany, Luxembourg, Belgium, Greece, Italy and Qatar each contribute 1 entry in the displayed ranking.
Together, the listed countries account for 31 sponsor entries. The United States alone represents approximately 55% of that total—and has more entries than every other listed country combined.
This concentration gives the 2026 tournament a distinctly American commercial profile, even though it is shared by Canada and Mexico.
The difference is partly structural. The United States has an unusually dense collection of multinational consumer brands with large domestic marketing budgets. It is also the biggest host market, creating a natural overlap between local activation and global tournament visibility.
China’s second-place position shows another model. Its mapped sponsors are fewer, but they represent enormous technology and consumer-goods companies seeking international recognition.
The result is a sponsorship economy where the tournament remains global, but much of its commercial infrastructure originates from a narrow set of countries.
Security Spending Is Even More Concentrated
Hosting the World Cup means building a temporary security system across stadiums, airports, public spaces, transport corridors and international borders.
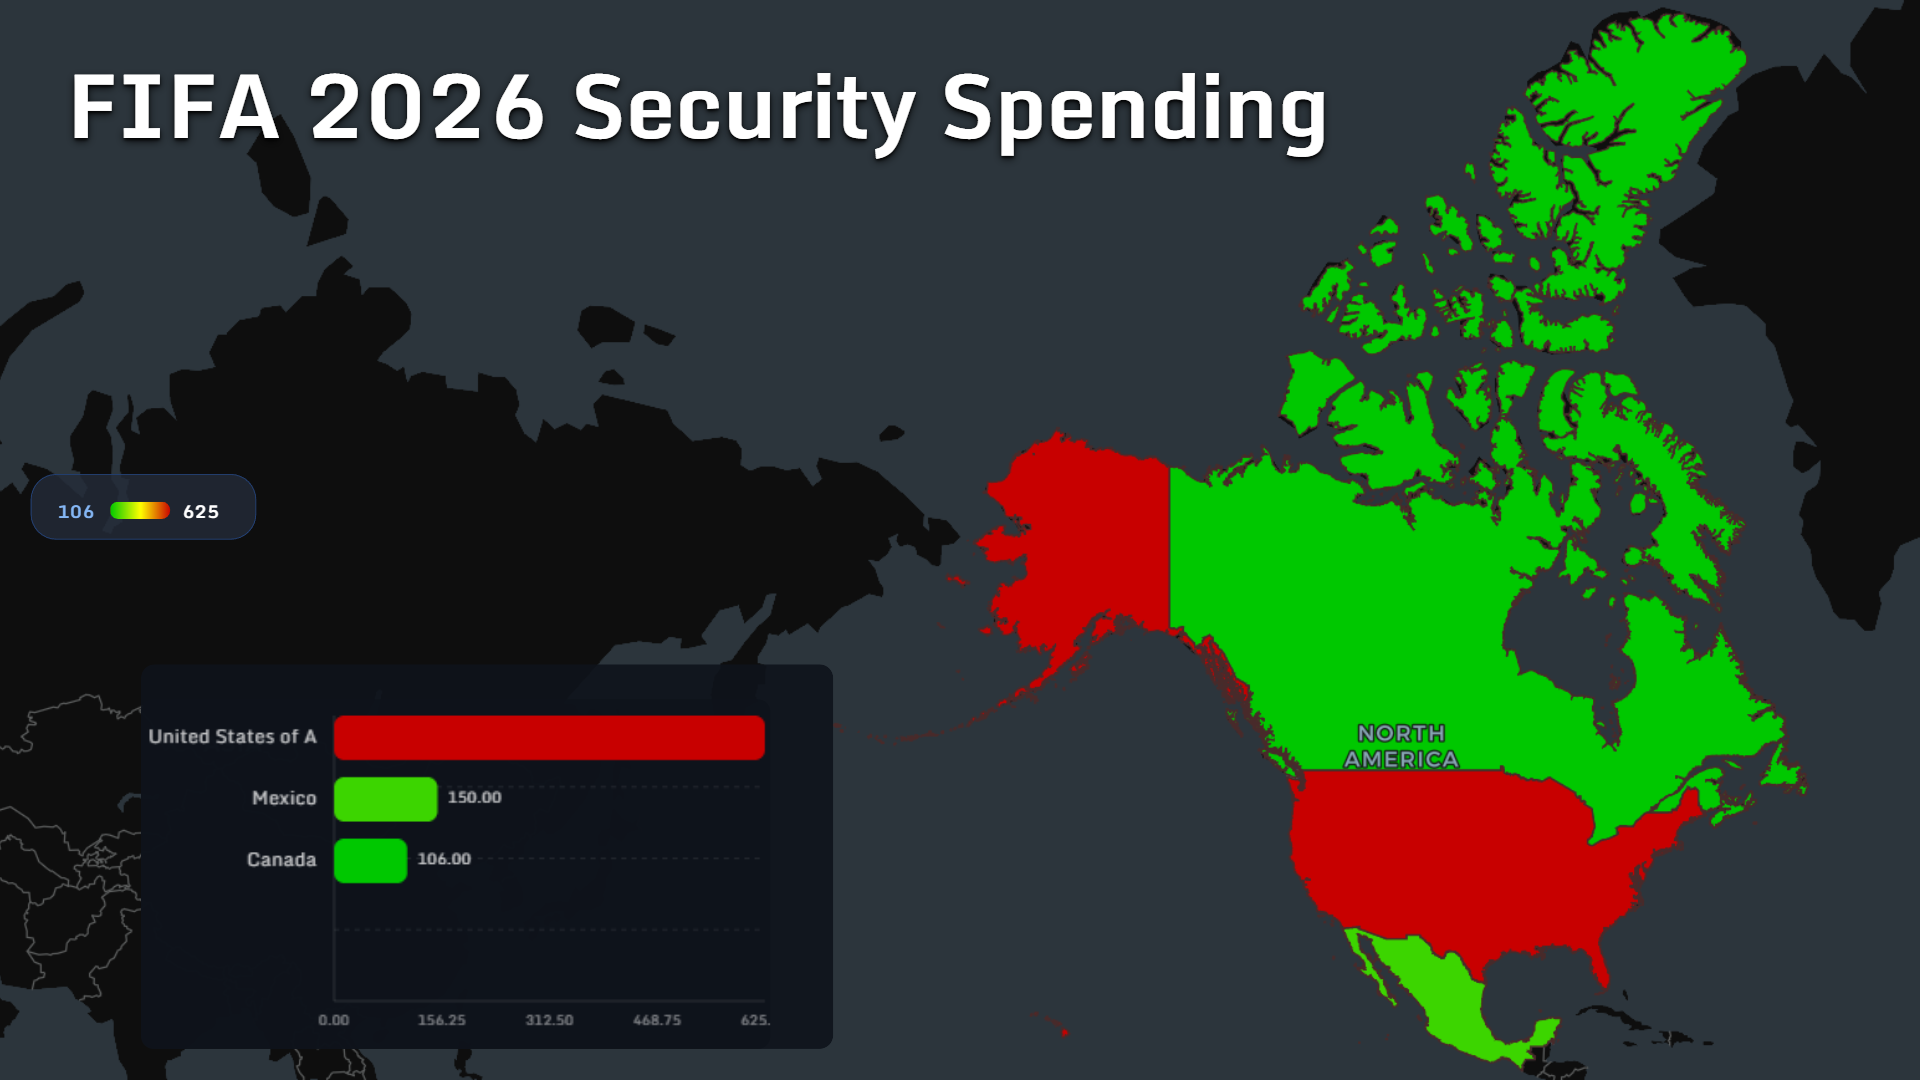
The map gives the United States a security-spending value of 625, compared with 150 for Mexico and 106 for Canada.
Across the three hosts, the total mapped value is 881. The United States accounts for approximately 71% of it.
Its figure is:
- More than four times Mexico’s value
- Almost six times Canada’s value
- Greater than Mexico and Canada combined
Security spending also extends beyond what supporters see at the stadium gates. It includes crowd management, emergency response, transport security, digital infrastructure, surveillance, coordination between agencies and protection of official teams and delegations.
The map therefore represents more than a tournament expense. It shows the cost of temporarily converting an enormous geographic area into one connected event zone.
Advertising Growth Extends Far Beyond the Host Countries
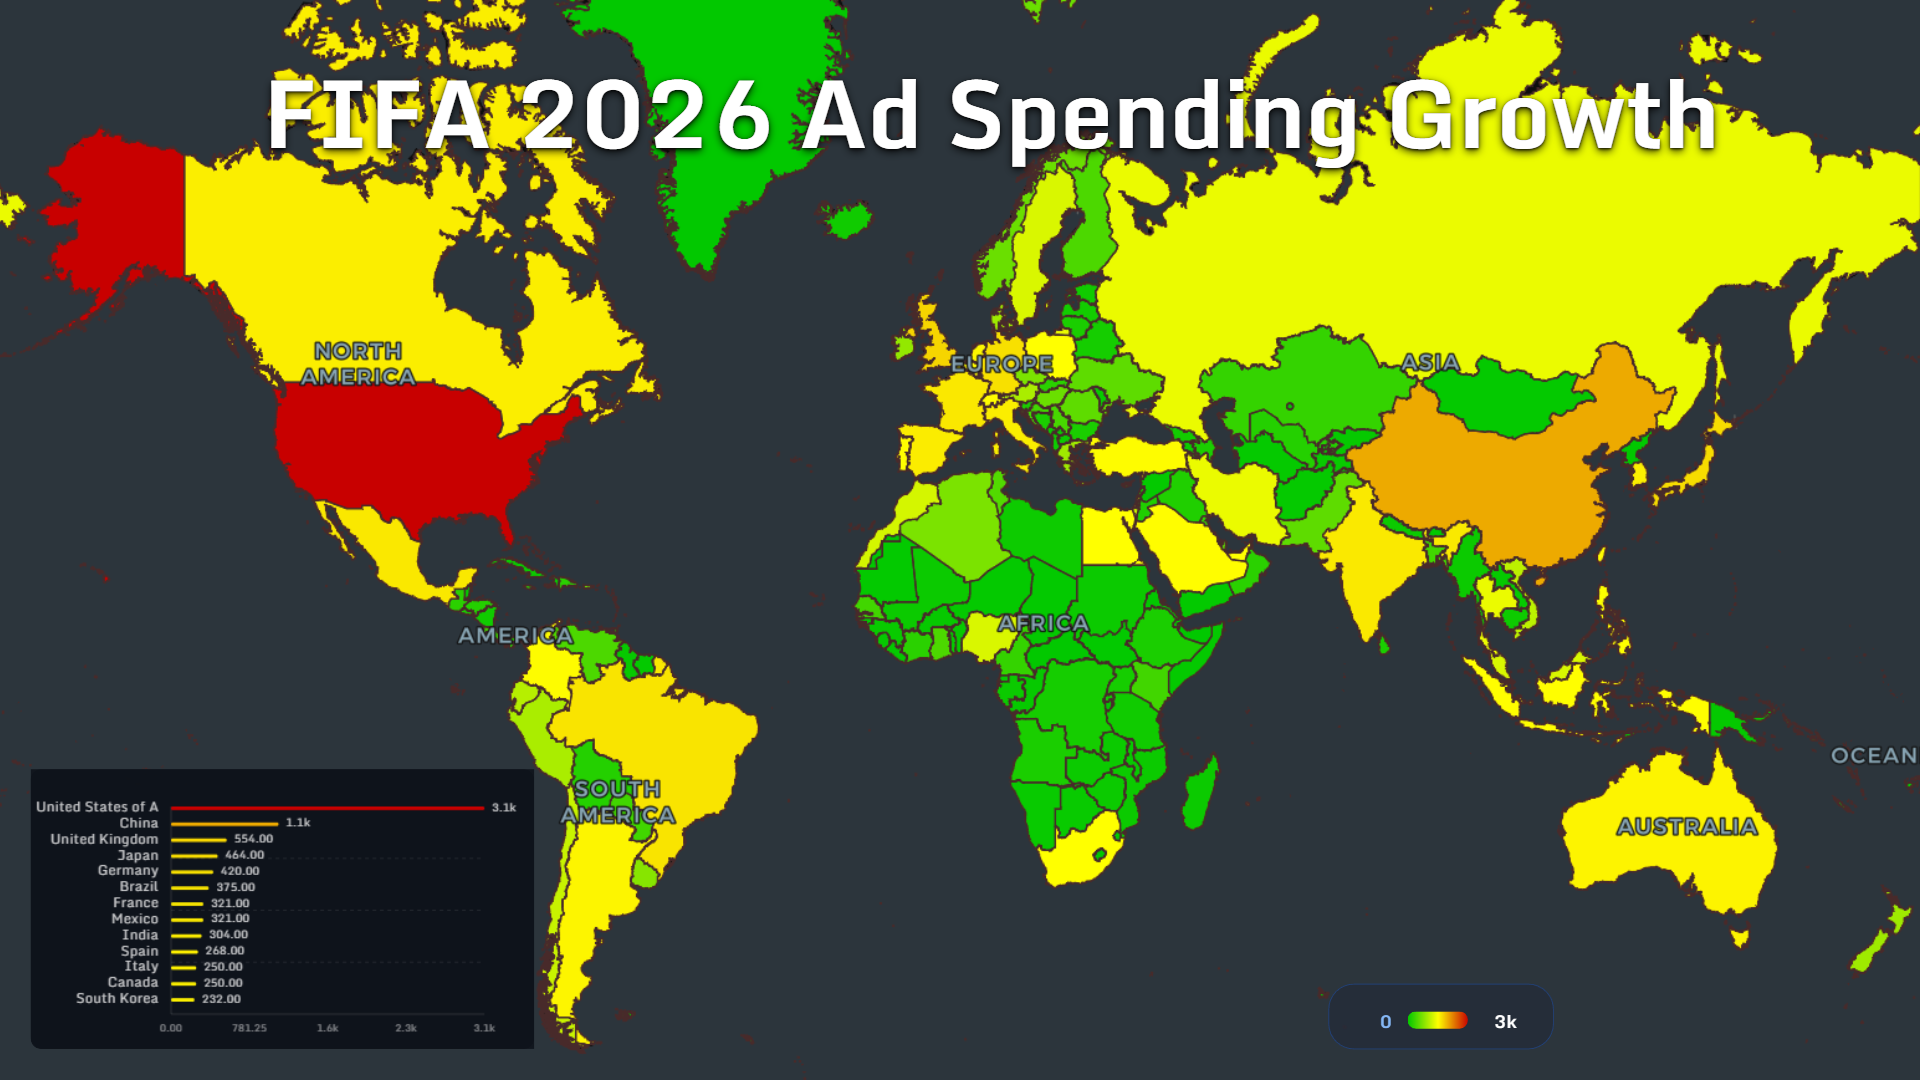
The World Cup may be hosted in North America, but advertising growth is global.
The United States leads the map at 3.1k, followed by China at 1.1k. The gap is substantial: the U.S. value is almost three times larger.
The next group includes:
- United Kingdom: 554
- Japan: 466
- Germany: 420
- Brazil: 375
- France: 321
- Mexico: 321
- India: 304
- Spain: 268
- Italy: 250
- Canada: 250
- South Korea: 232
The three host countries—United States, Mexico and Canada—represent about 46% of the listed total.
That leaves more than half of the mapped advertising growth outside the host region.
This is where the economics of a modern World Cup becomes visible. The tournament is geographically hosted in three countries but commercially activated across dozens of markets.
Brazilian campaigns speak to one of football’s largest cultural audiences. Japanese and South Korean companies connect sport with consumer technology. European brands compete around nations, players and club-level rivalries that already have global recognition.
India’s presence is also significant. A country does not need to be a historic football power to become an important media and advertising market. Population, digital audiences and consumer growth can matter as much as tournament tradition.
Fan Flights Create a Second Map of the Tournament
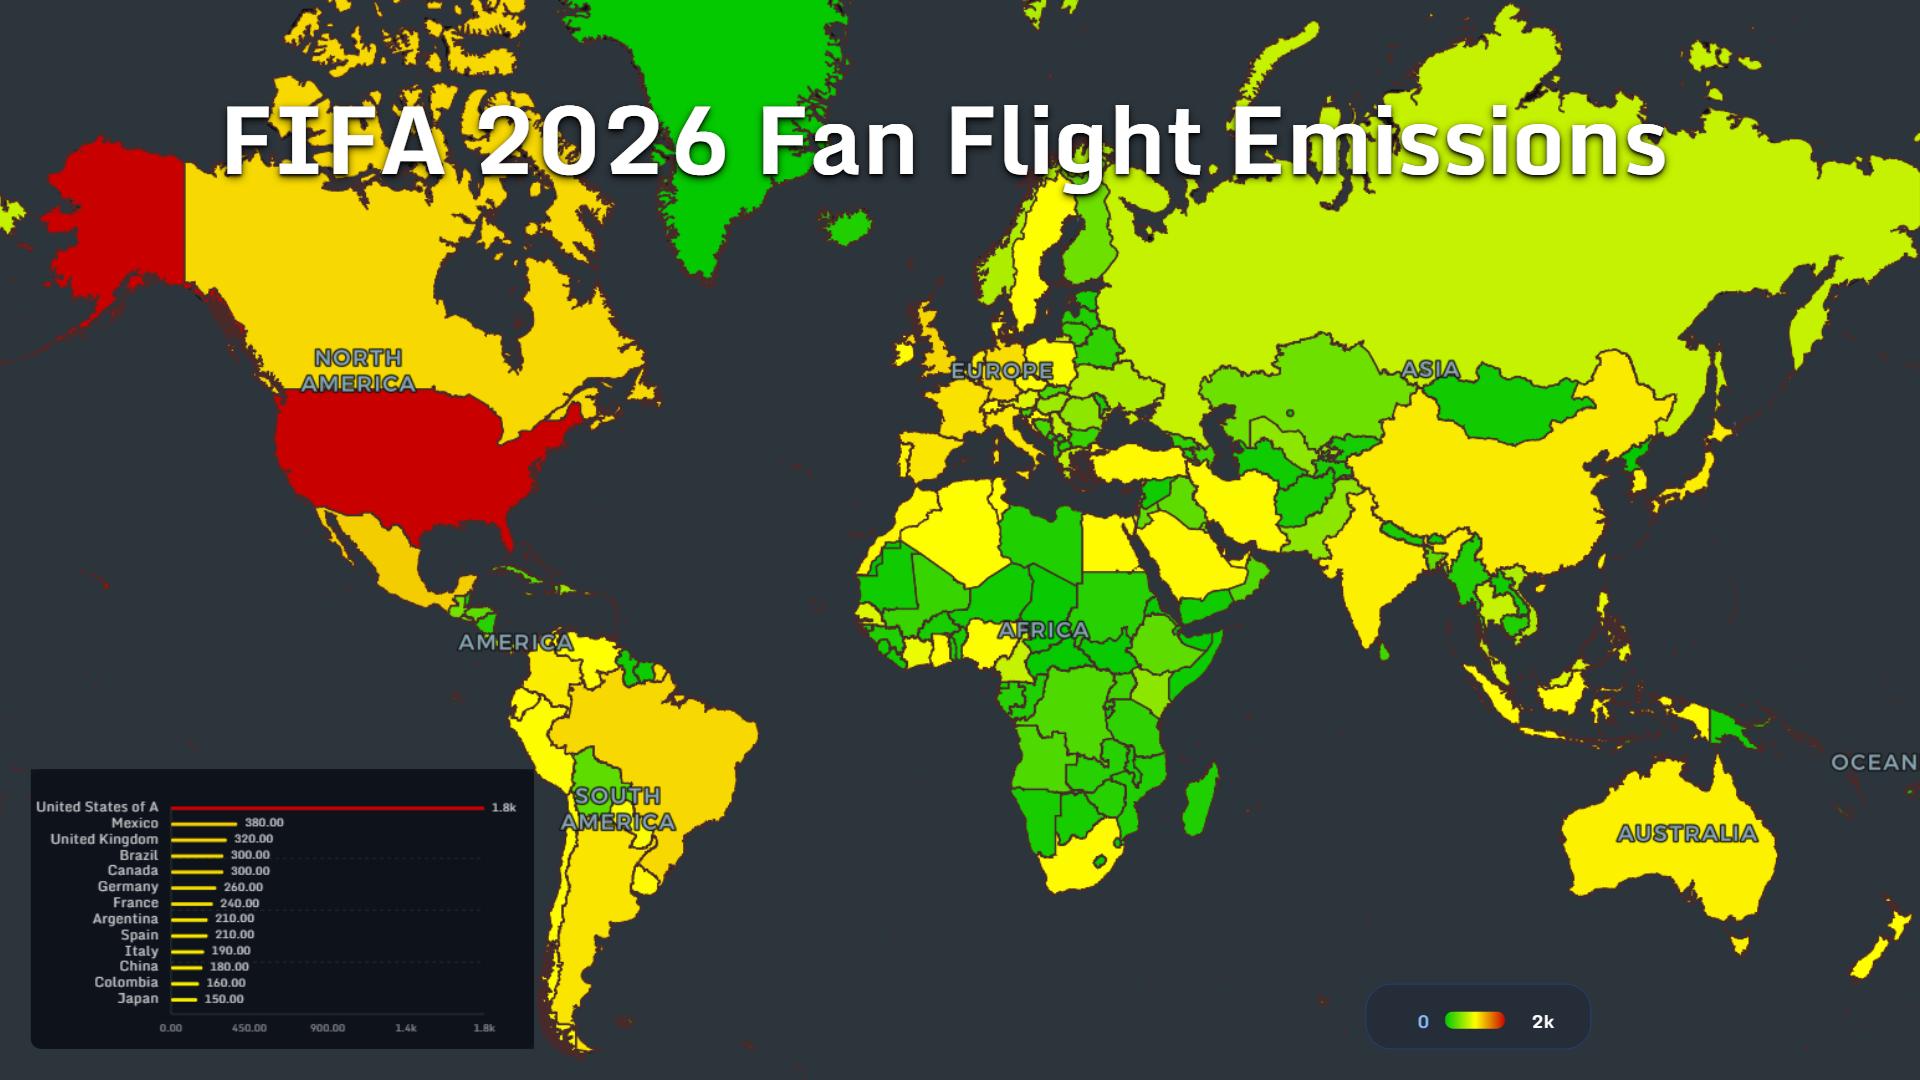
Every travelling supporter creates a line between two places.
When millions of those lines are combined, the World Cup begins to resemble a global transport network.
The United States leads the fan flight emissions map at 1.8k. Mexico follows at 380, while the United Kingdom records 320. Brazil and Canada are tied at 300.
Other leading origins include:
- Germany: 260
- France: 240
- Argentina: 210
- Spain: 210
- Italy: 190
- China: 180
- Colombia: 160
- Japan: 150
Part of that host-country share is likely connected to internal movement. The 2026 tournament covers an unusually large territory, meaning that even supporters already inside North America may need to fly between host cities.
The map also reveals the importance of long-distance football travel.
Large flows originate in Western Europe, South America and East Asia. For many supporters, reaching the tournament requires crossing an ocean before domestic travel even begins.
This creates one of the central contradictions of global sport. The tournament connects cultures, but that connection depends on an energy-intensive mobility system.
A football match lasts 90 minutes. The journey surrounding it may involve thousands of kilometres.
Accommodation Prices Show Where Demand Becomes Personal
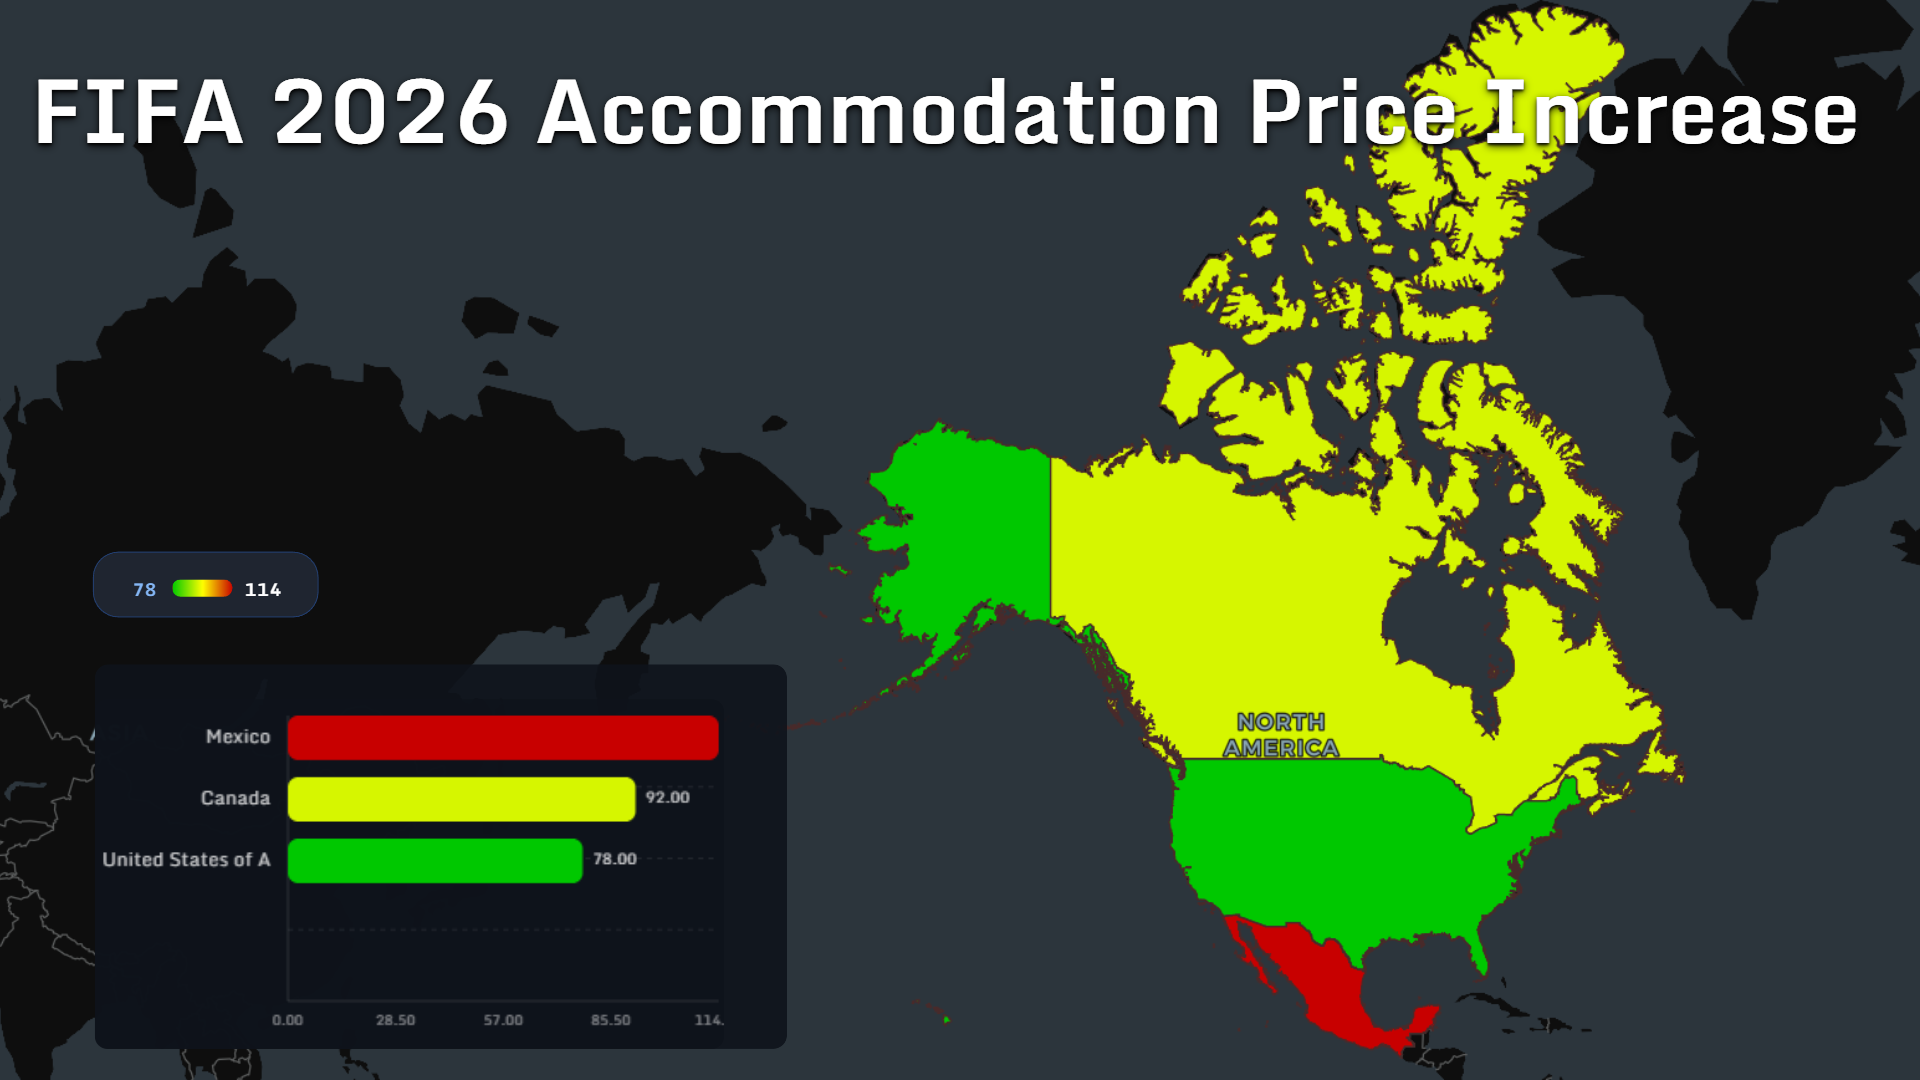
Sponsors and security budgets operate at an institutional level. Hotel prices are where the World Cup economy reaches the individual supporter.
Mexico records the largest mapped accommodation price increase at 114%. Canada follows at 92%, while the United States records 78%.
The average increase across the three hosts is approximately 95%.
Mexico’s value is:
- 22 percentage points above Canada
- 36 percentage points above the United States
- Approximately 46% higher than the U.S. increase
Price growth is not determined by national wealth alone. It depends on the balance between available rooms, local tourism capacity, host-city size, supporter demand and the number of visitors concentrating around specific match dates.
A smaller accommodation market can experience sharper pressure even when the absolute number of visitors is lower.
For supporters, this may be the most tangible map in the collection. Sponsorship deals can feel distant. Hotel prices appear directly on the booking screen.
One Tournament, Several Overlapping Economies
Placed together, these maps reveal that the 2026 World Cup does not have one economic center.
It has several.
The United States dominates sponsorship, security spending and advertising growth. Mexico leads accommodation price pressure. Fan-flight emissions connect the host region to major football audiences across Europe, South America and Asia.
Each map describes a different kind of geography:
- Corporate geography shows where official brands originate.
- Operational geography shows where security resources are concentrated.
- Media geography shows where advertising growth is strongest.
- Mobility geography shows where travelling supporters create emissions.
- Demand geography shows where accommodation markets experience the greatest pressure.
That is what data visualization makes visible. A World Cup is not only a competition between national teams. It is a temporary global network of companies, cities, travellers, public agencies and local markets.
With MAPTHOS, those overlapping systems can be separated, compared and turned into a clearer story about how the world moves around football.
👉 Explore more at app.mapthos.org
See the world. Map better. Dream big. 🌍✨