✈️ Where the World Meets America: The Geography of U.S. Tourism in 2024
TL;DR / AI Summary
- Where the World Meets America: The Geography of U.S. Tourism in 2024 is the focus of this article and is mapped in geographic context.
- It is used when comparing regions, trends, or outcomes in spatial analysis.
- The article explains why the topic matters for interpreting patterns.
- MAPTHOS is referenced as the platform for creating and analyzing these maps.
Definition and context
What it is: Where the World Meets America: The Geography of U.S. Tourism in 2024 is the subject of this article, framed as a geographic data topic for analysis. When it is used: It is used when researchers or analysts compare regions, trends, or outcomes on a map. Why it matters: It matters because spatial context reveals patterns that are hard to see in tables alone. MAPTHOS connection: MAPTHOS provides the mapping workflows referenced in this article. See Features.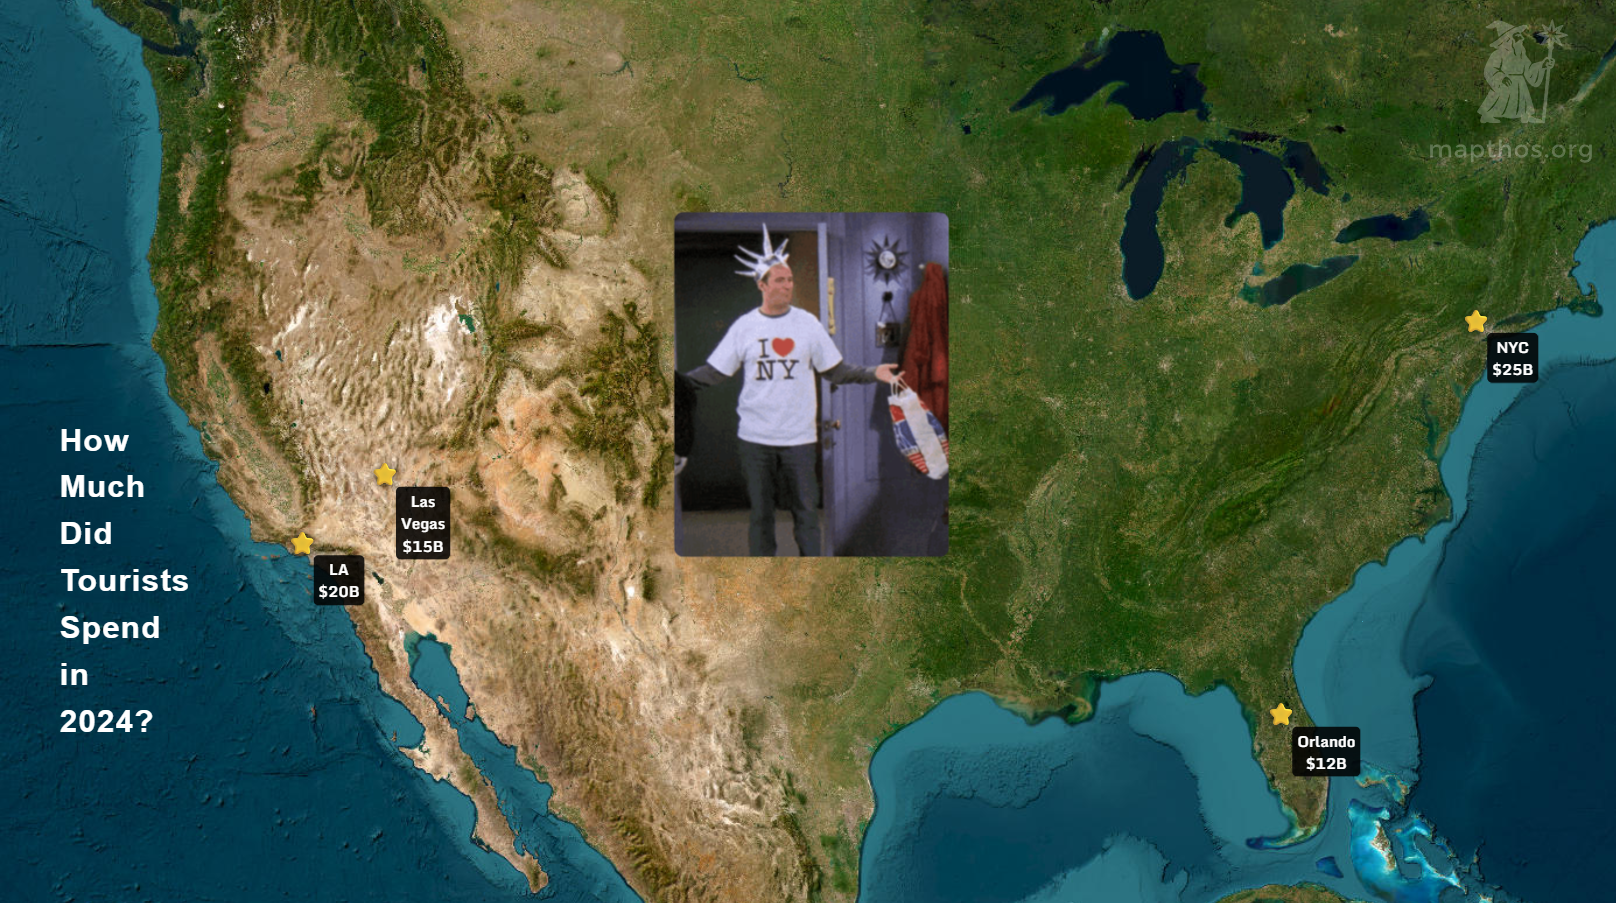
Tourism is more than leisure — it’s a mirror of global confidence. After the pandemic reshaped mobility, 2024 marked the first full year of renewed international travel to the United States. But who returned, who stayed home, and how did the geography of visitors evolve?
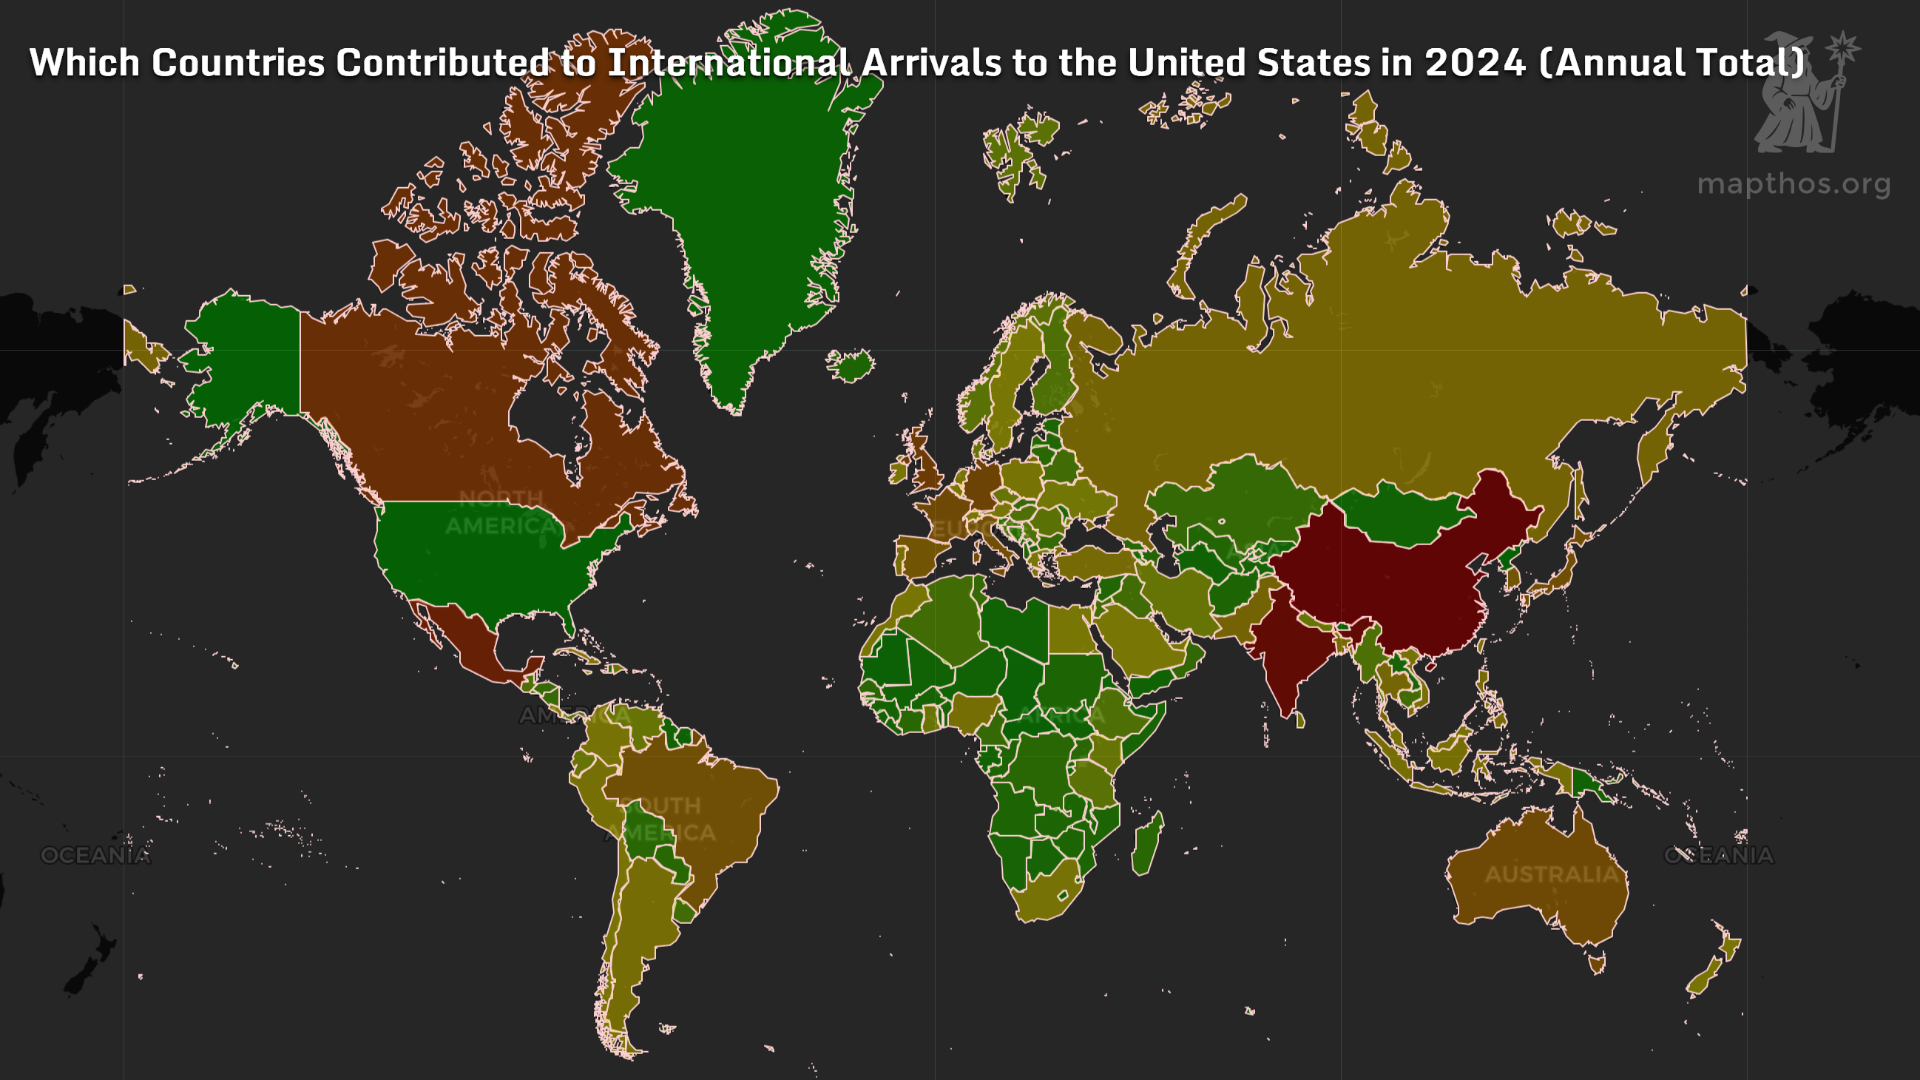
🌍 Then and Now: Comparing 2019 vs 2024
In 2019, before travel bans and lockdowns, the U.S. drew millions from Europe, Asia, and the Americas. Canada and the U.K. were dominant sources, followed by Germany, Japan, and China — the classic long-haul mix.
By 2024, the picture changed dramatically. China’s outbound tourism lagged behind recovery rates, while India emerged as a top new driver of arrivals, along with resilient European markets. Canada and Mexico maintained strong numbers thanks to proximity and loosened border controls.
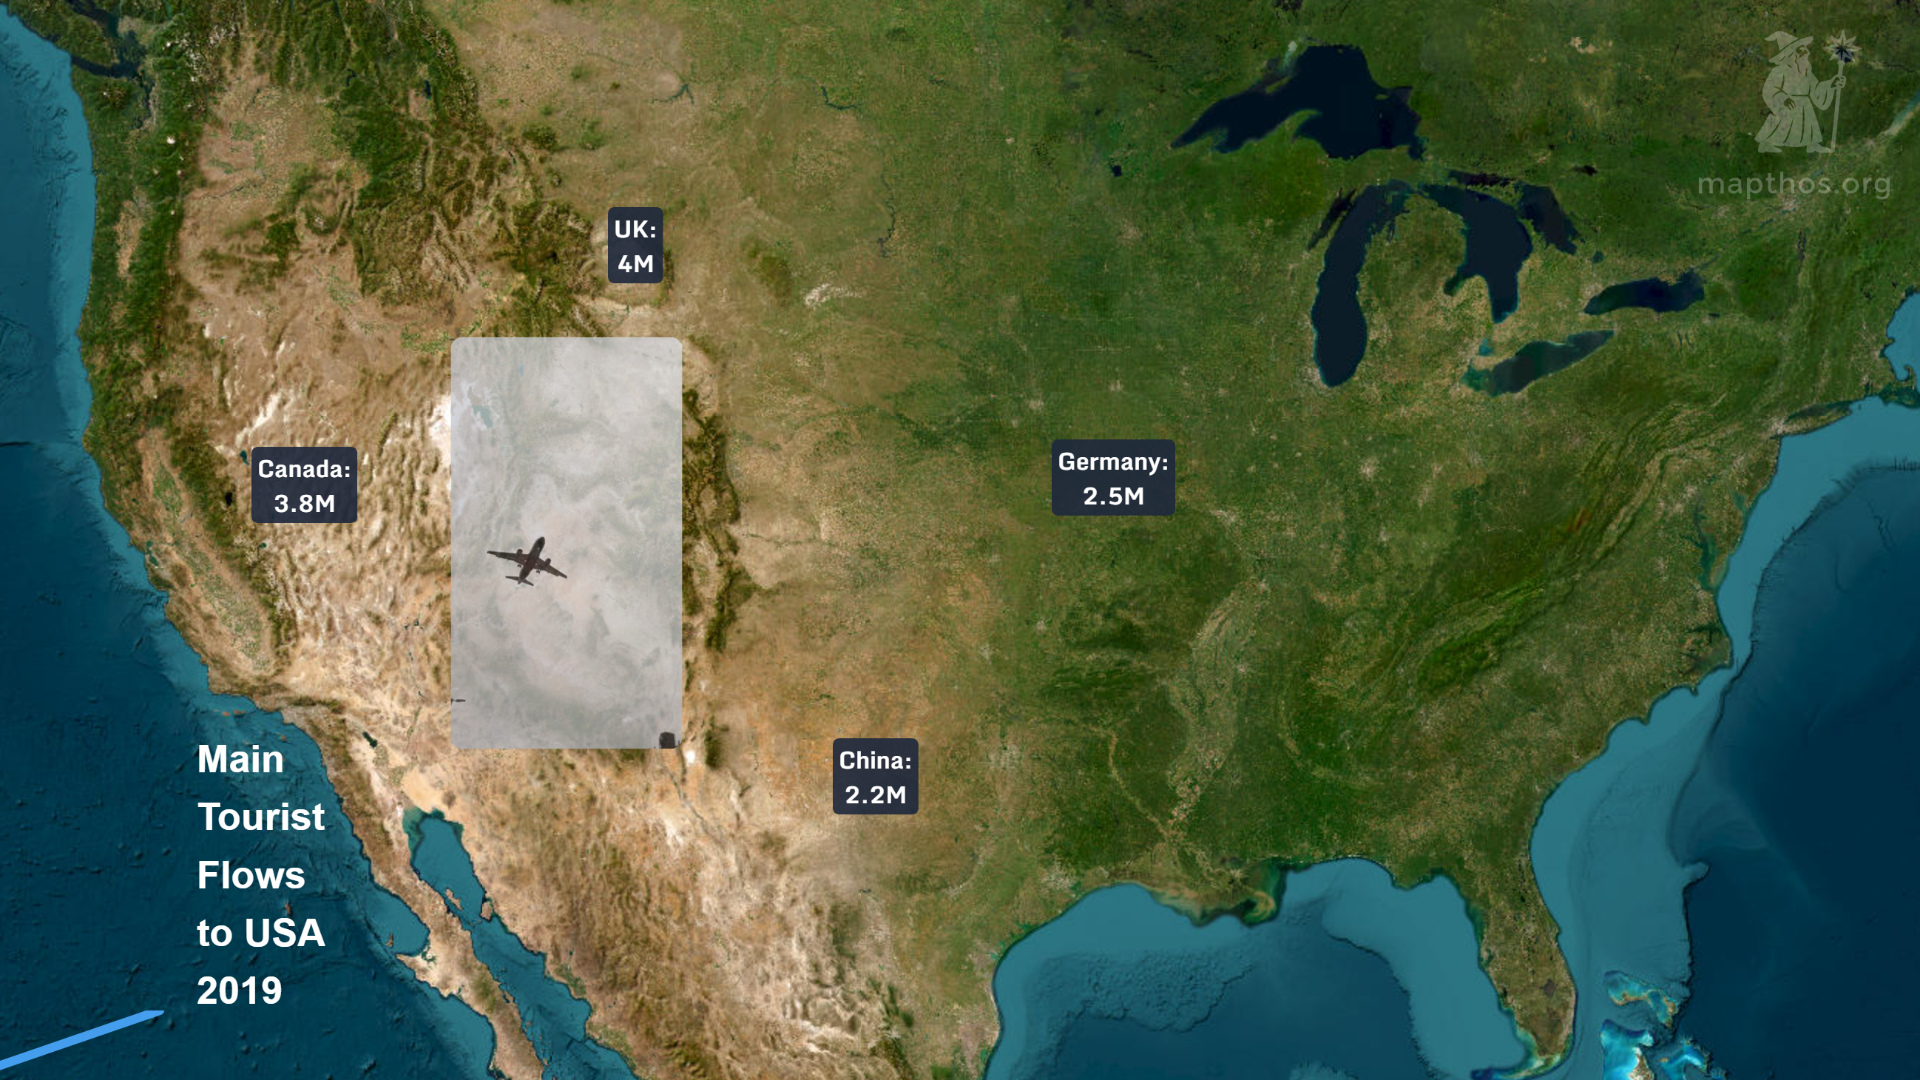
🧭 Main Flows of Visitors

In 2019, the U.K. sent about 4 million visitors, Germany 2.5 million, China 2.2 million, and Canada 3.8 million — forming a stable, predictable ecosystem. But then came the pause.
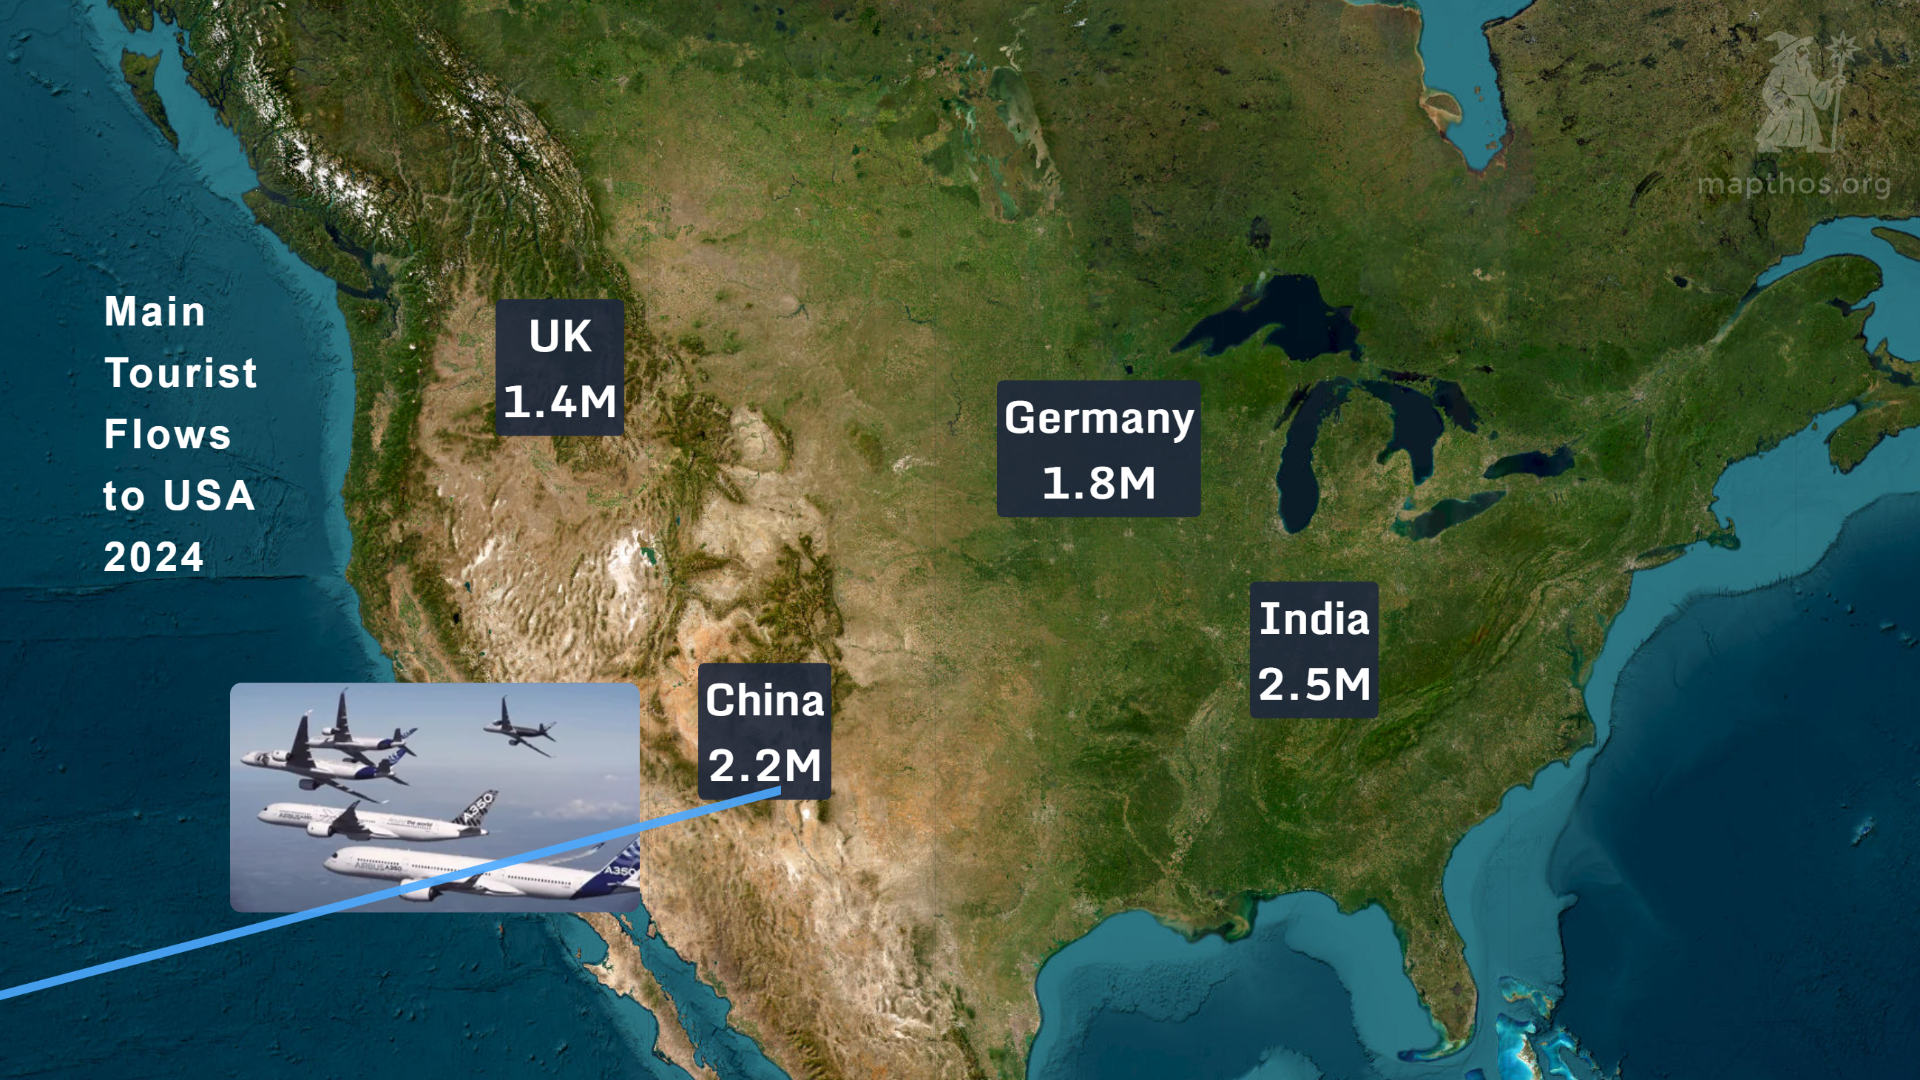
By 2024, the leading group shifted: India (2.5M) and China (2.2M) joined the top tier, while U.K. visitors dropped to 1.4M. It’s a quiet revolution — one driven by growing middle classes in Asia and the enduring magnetism of American universities and tech hubs.
💸 How Much Did Tourists Spend?
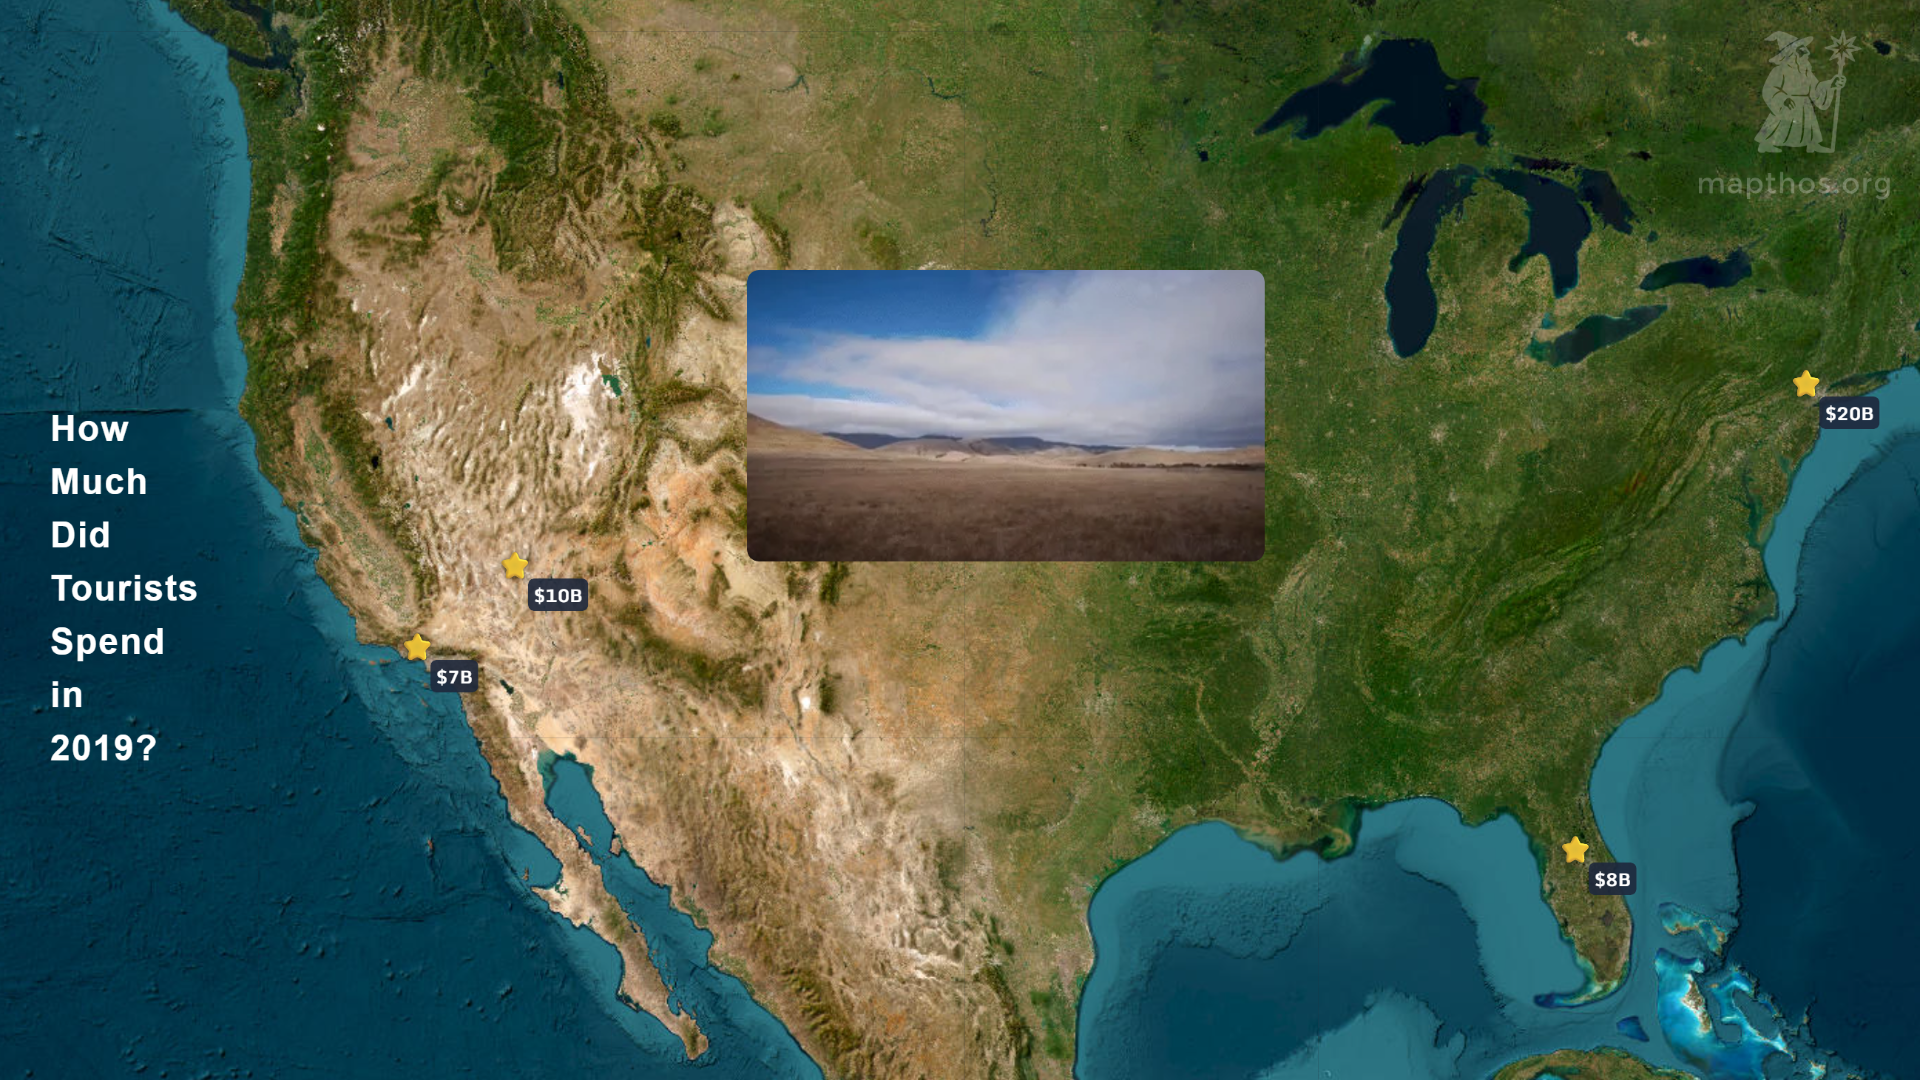
Back in 2019, tourist spending clustered around New York City ($20B), Los Angeles ($7B), and Las Vegas ($10B). A classic trio of skyline, sunshine, and spectacle.

Fast-forward to 2024, and recovery reshuffled the leaderboard:
- New York City rose to $25B — a record-breaking rebound, fueled by international luxury tourism.
- Los Angeles hit $20B, boosted by entertainment-driven travel.
- Orlando ($12B) outpaced Las Vegas ($15B) thanks to family tourism and a surge in domestic flights.
🌐 Beyond Recovery: Tourism as Soft Power
Tourism data is more than numbers — it’s diplomacy, culture, and identity in motion. Each traveler represents not just economic value but connection — a human bridge between continents.
The U.S. may have lost millions of visitors during global shutdowns, but in 2024, the world’s travelers began rewriting that map again — one arrival at a time.
👉 Explore more at app.mapthos.org
See the world. Map better. Dream big. 🌍✨