🎮 Teen Digital Leisure & Youth Crime Risk in 2025
Teenagers grow up inside systems they never designed.
Demographics, technology, inequality, connectivity — all of it shapes how young people spend their time. In this global data visualization, we mapped teen digital leisure hours, youth population share, internet access, and juvenile crime rates by country. The result is not a simple story — but a revealing one.
🌍 Teen Digital Leisure in 2007 vs 2019
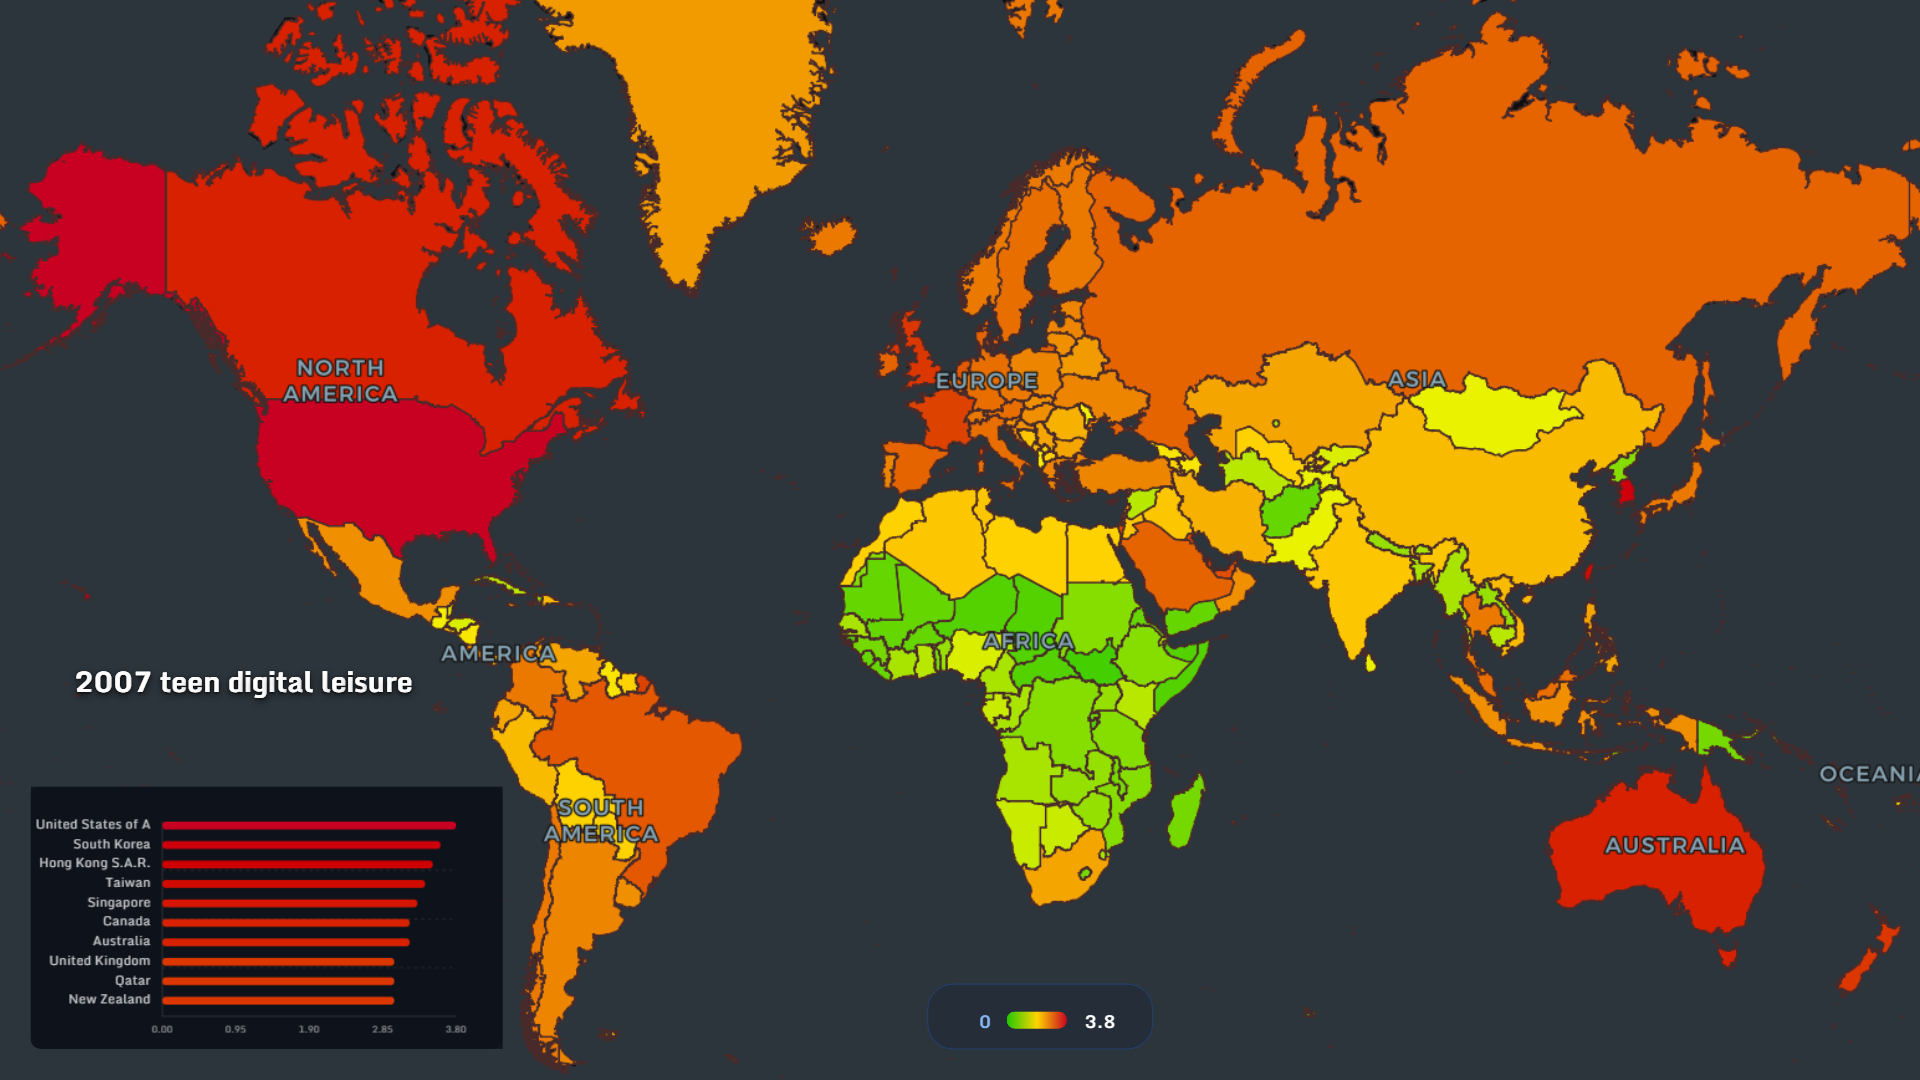
In 2007, teen digital leisure was already concentrated in high-income countries.
- The United States, South Korea, Hong Kong, and Singapore led with ~3–3.8 hours per day.
- Much of Africa remained under 1.5 hours.
- Latin America and Eastern Europe sat in the middle.
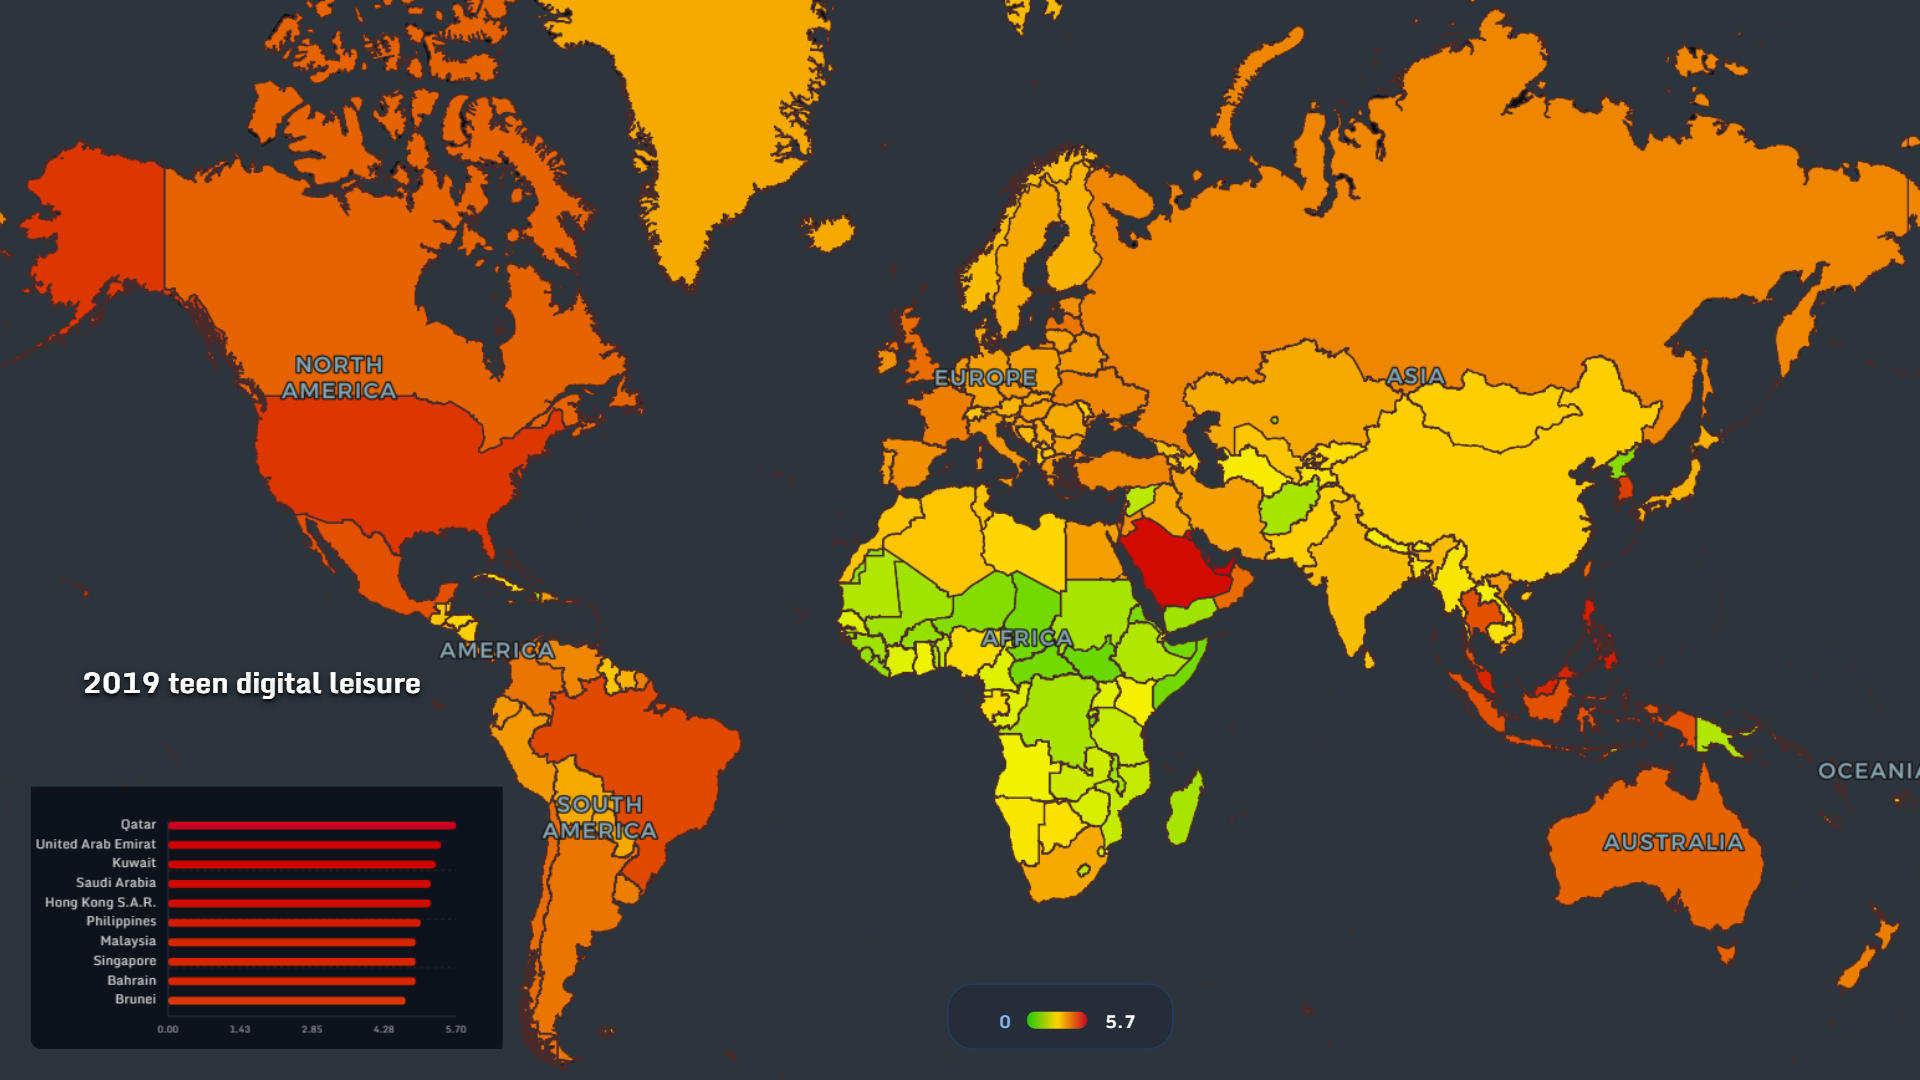
By 2019, the map shifts dramatically.
- Gulf countries like Qatar, UAE, and Kuwait approach 5–6 hours daily.
- East Asia and North America remain high.
- Southeast Asia accelerates rapidly.
📶 Internet Users Share: The Infrastructure Layer
Digital leisure cannot grow without connectivity.
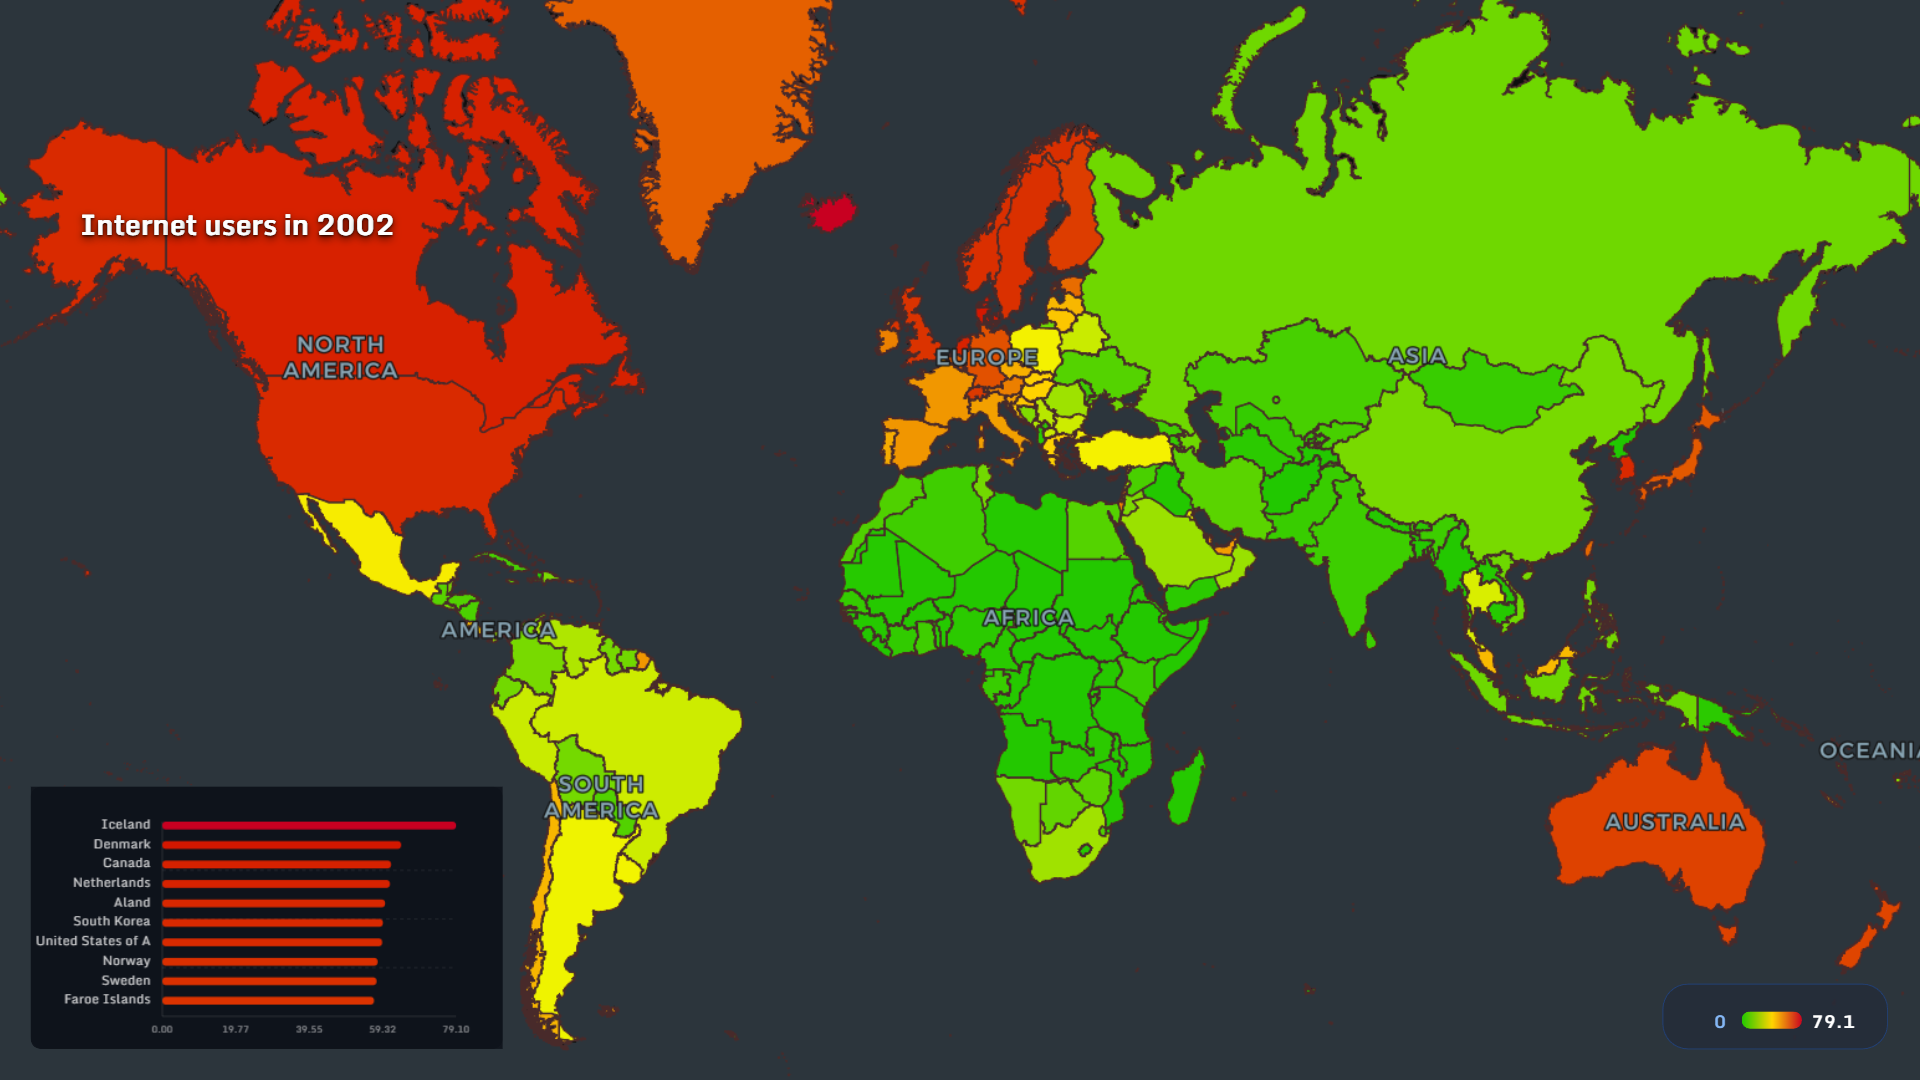
In 2002:
- Northern Europe exceeded 60–70% internet penetration.
- The United States was ahead of most of the world.
- Sub-Saharan Africa remained largely offline.
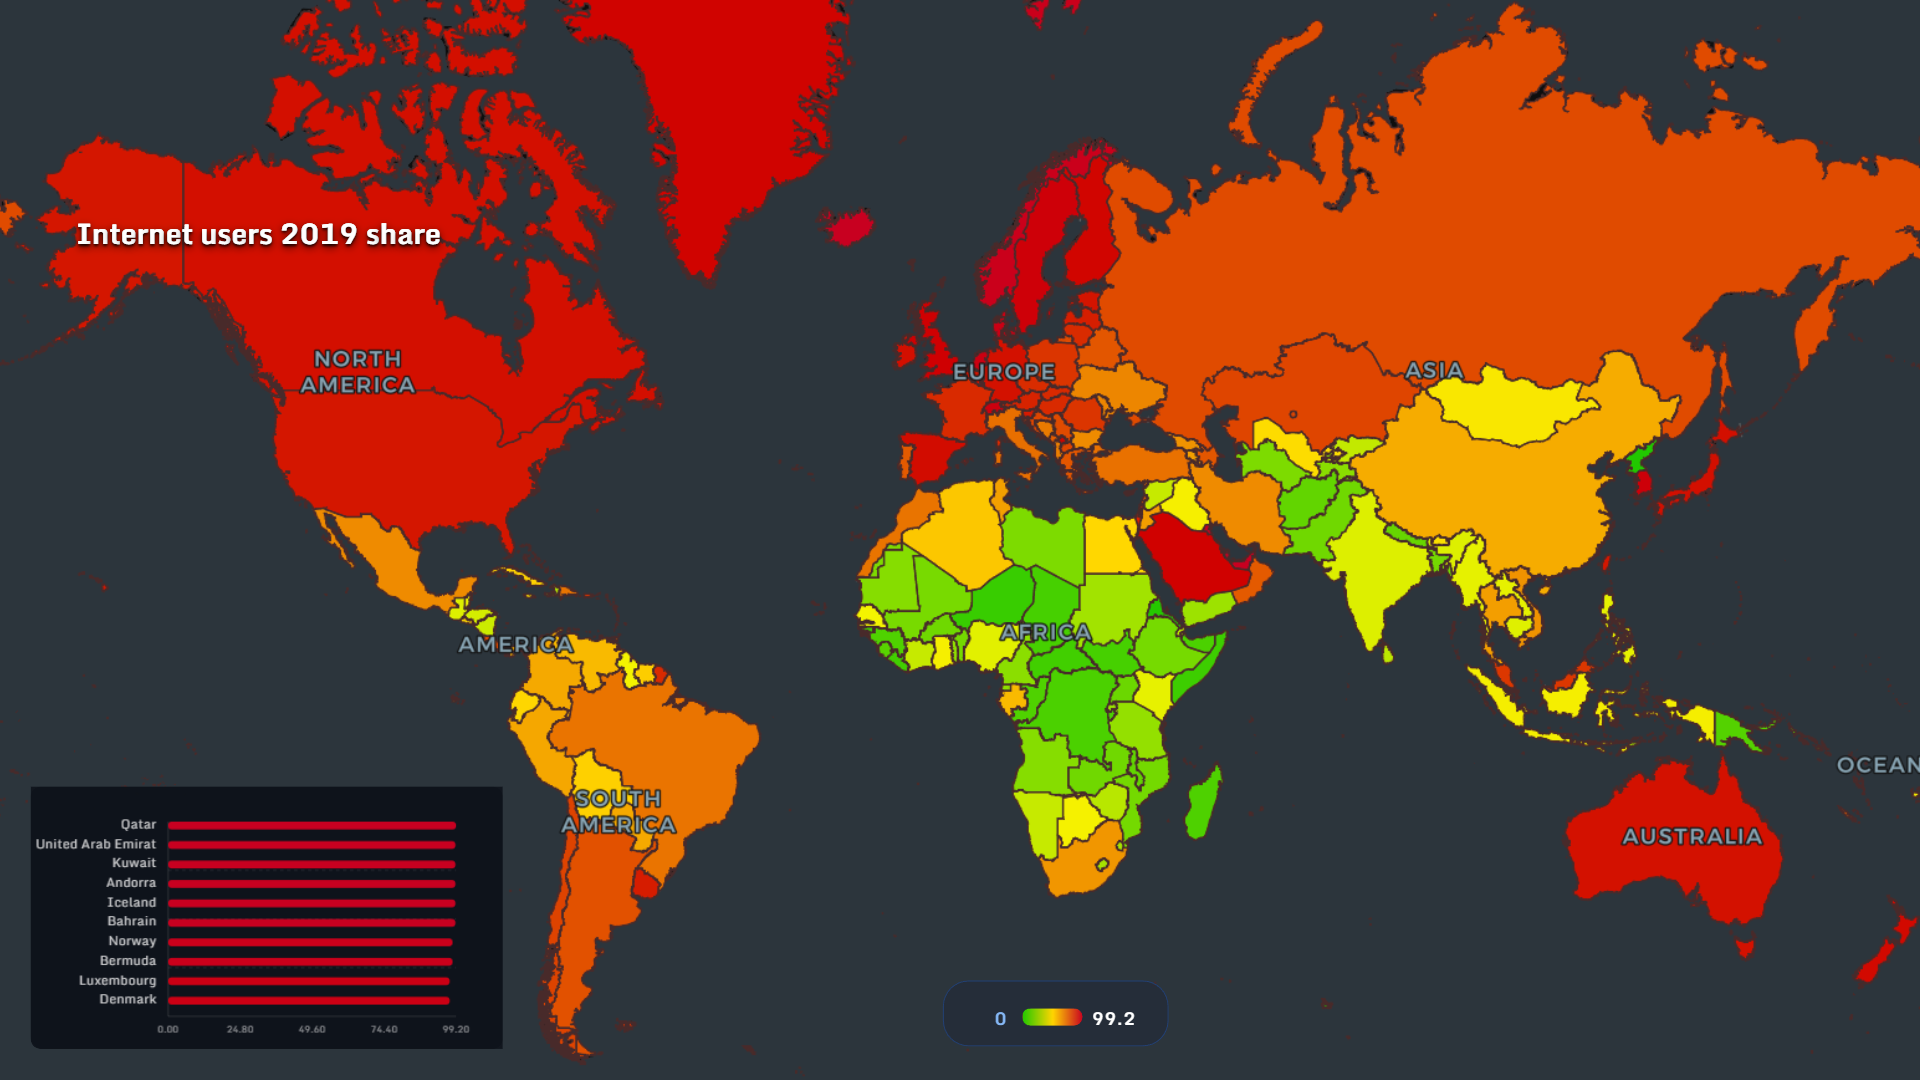
By 2019:
- Many European and Gulf countries approach 95–99% usage.
- Latin America surpasses 70–80%.
- Africa improves, but remains structurally uneven.
👥 Youth Share of Population (13–24)
Where young people are numerous, the social system looks different.
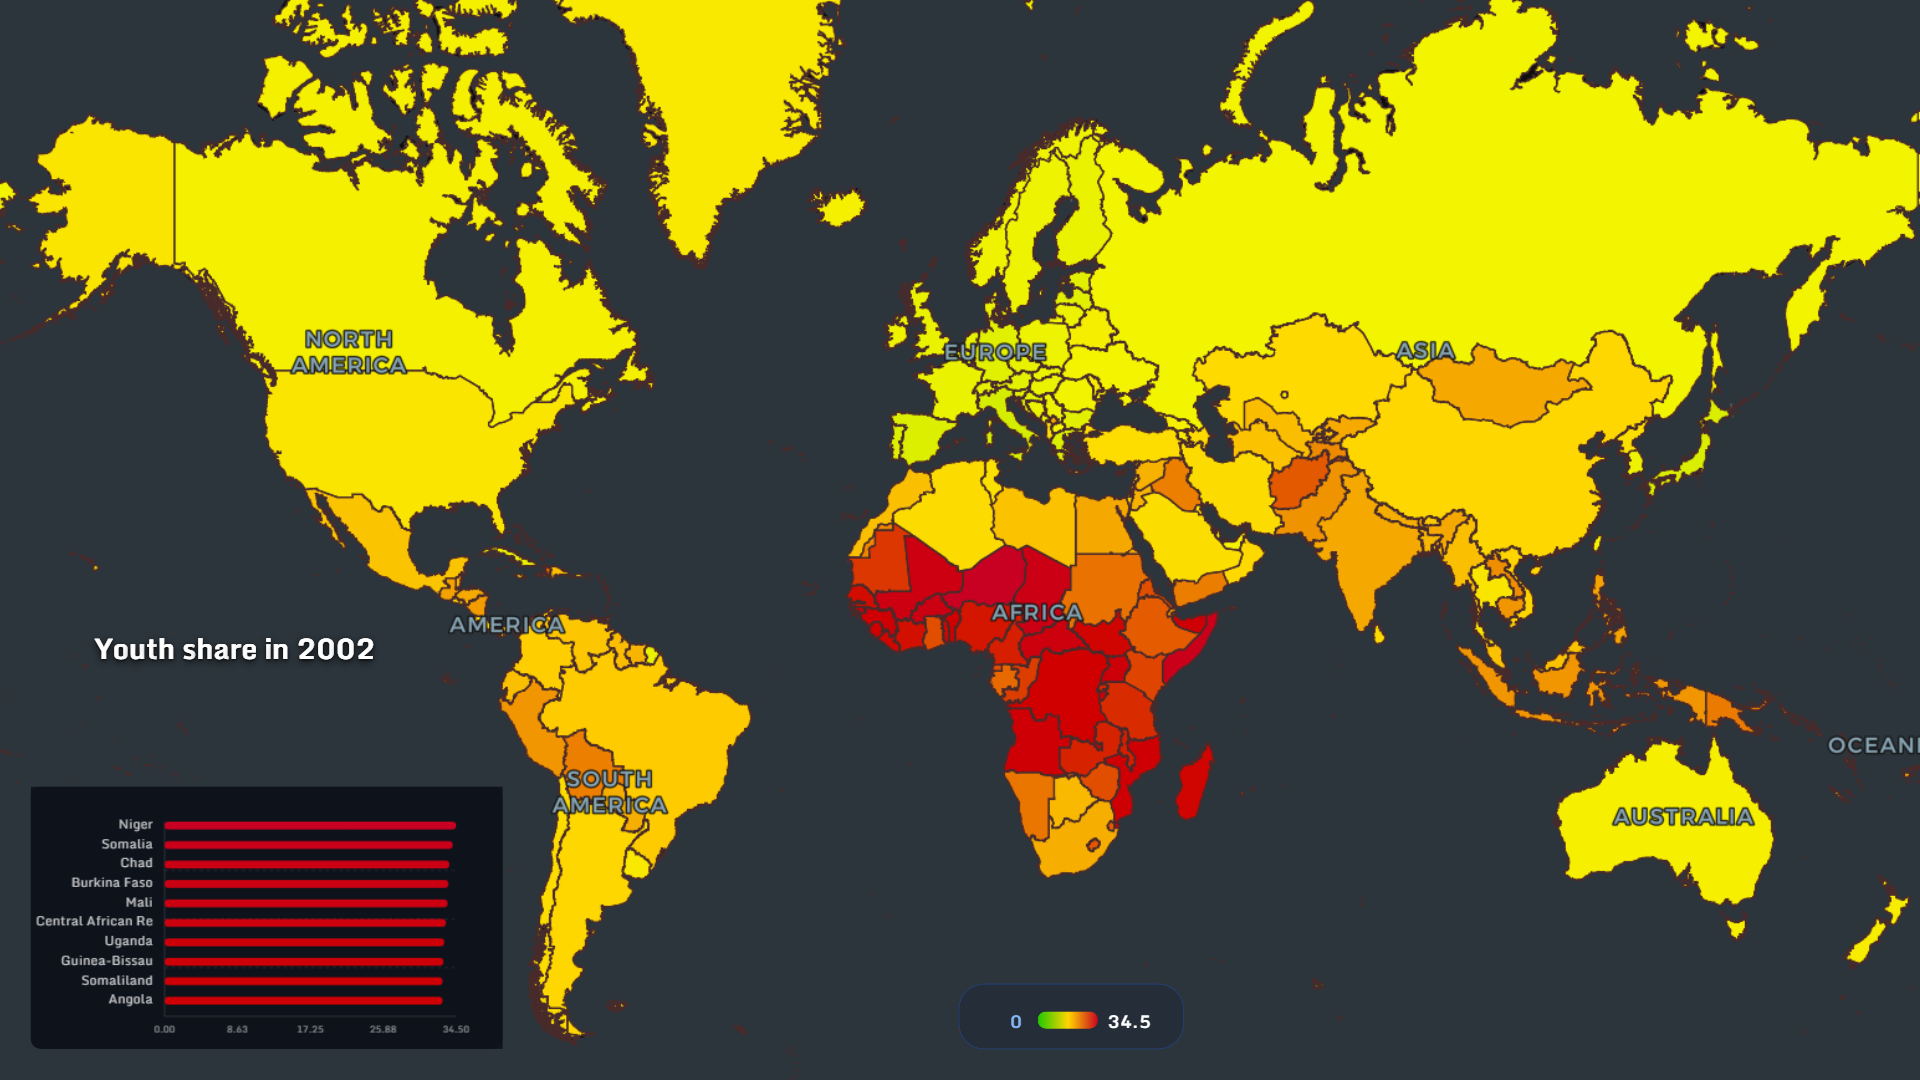
In 2002:
- Sub-Saharan Africa shows youth shares above 30–34%.
- Europe and Japan are aging rapidly.
- North America and Latin America sit between.
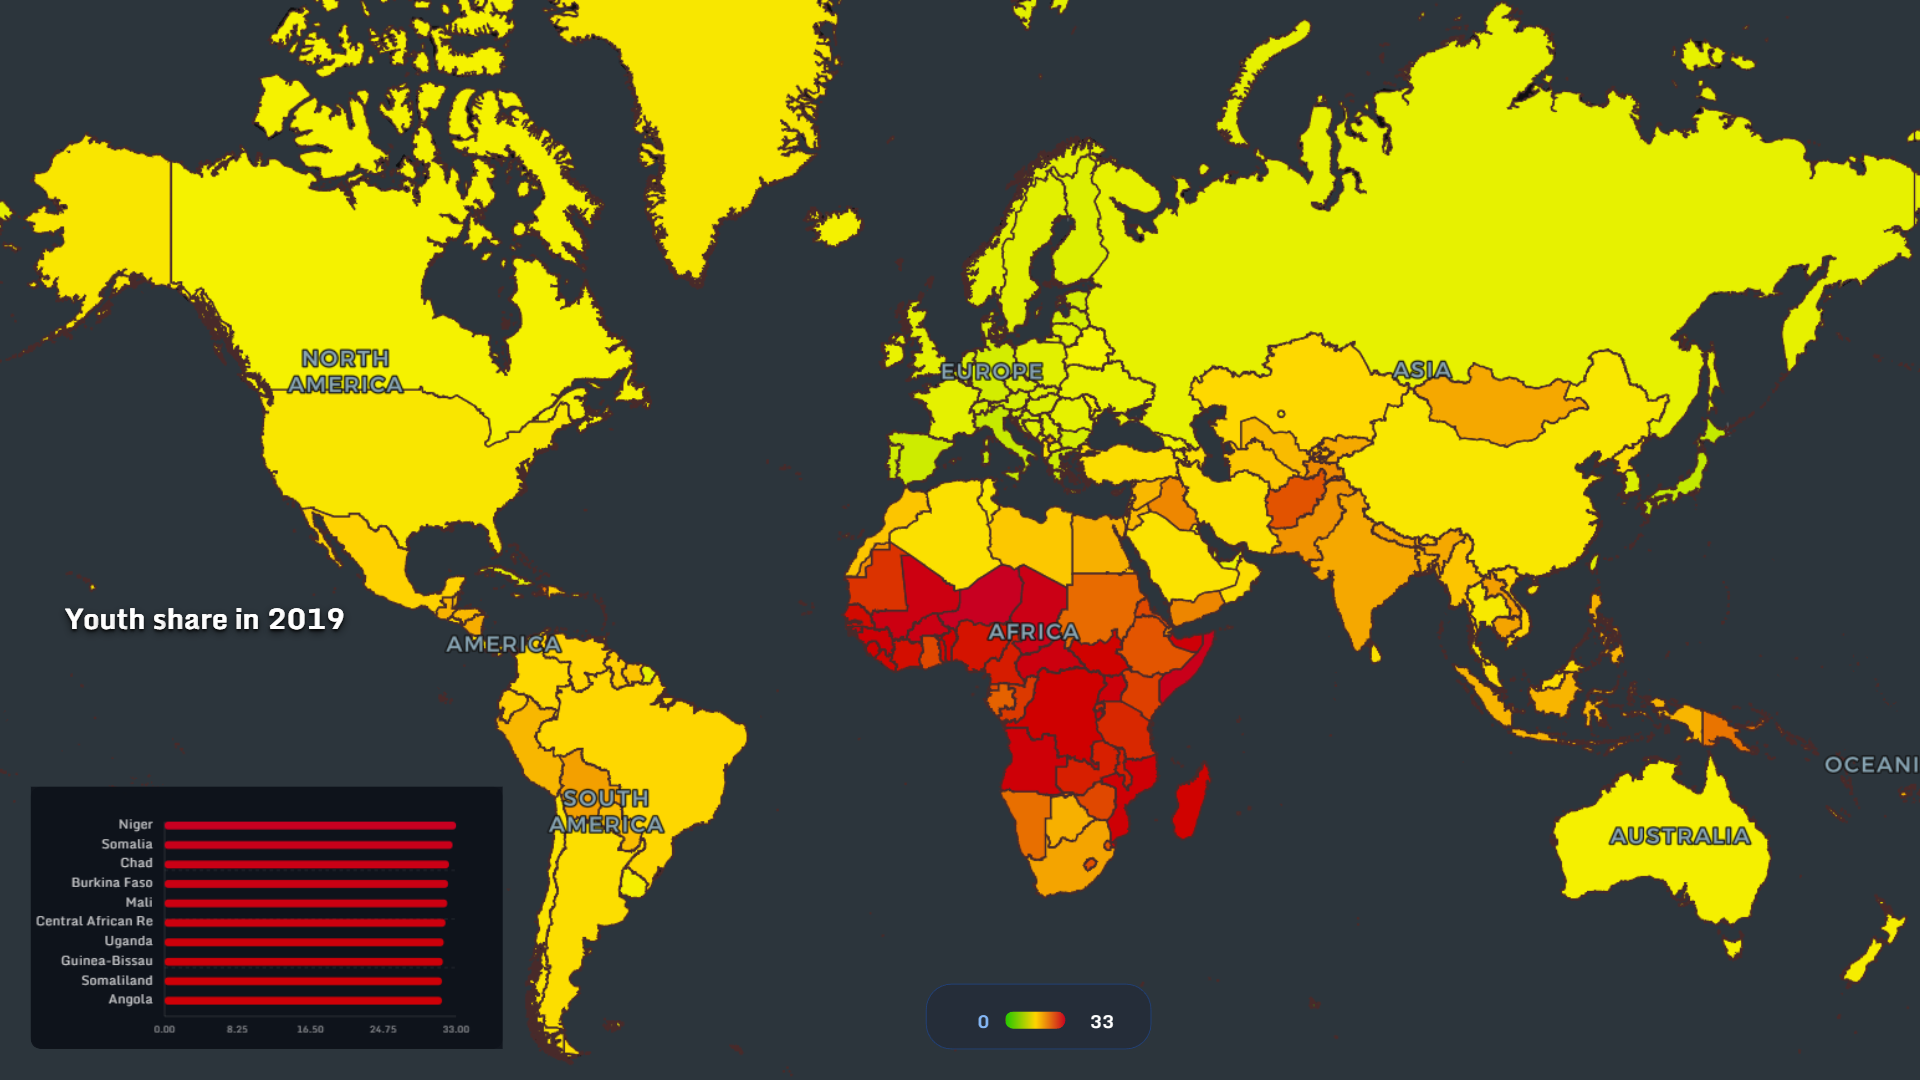
By 2019:
- Africa remains the youngest region globally.
- Europe and East Asia continue demographic contraction.
- Middle Eastern states retain relatively high youth proportions.
🚨 Juvenile Crime Rates: 2002 → 2007 → 2019
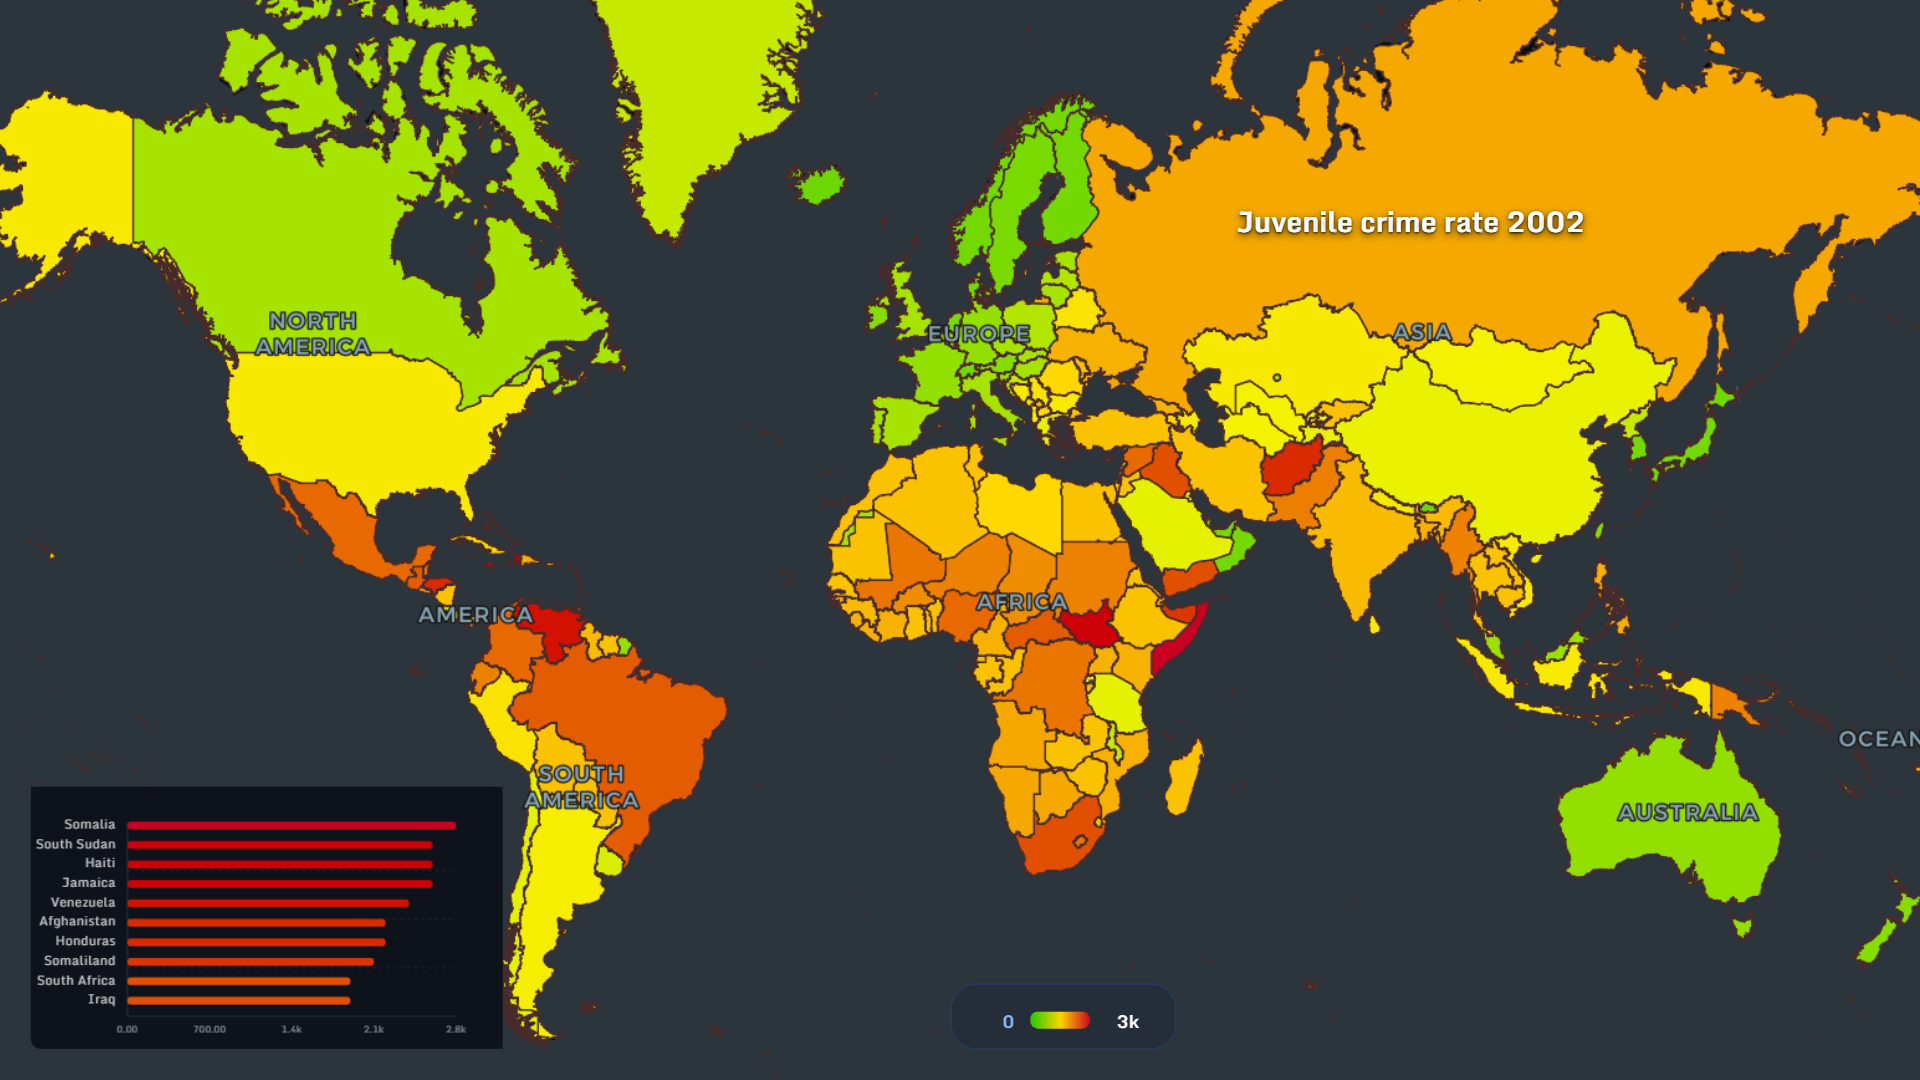
In 2002:
- Higher juvenile crime rates appear in parts of Latin America and conflict-affected regions.
- Europe and East Asia remain comparatively lower.
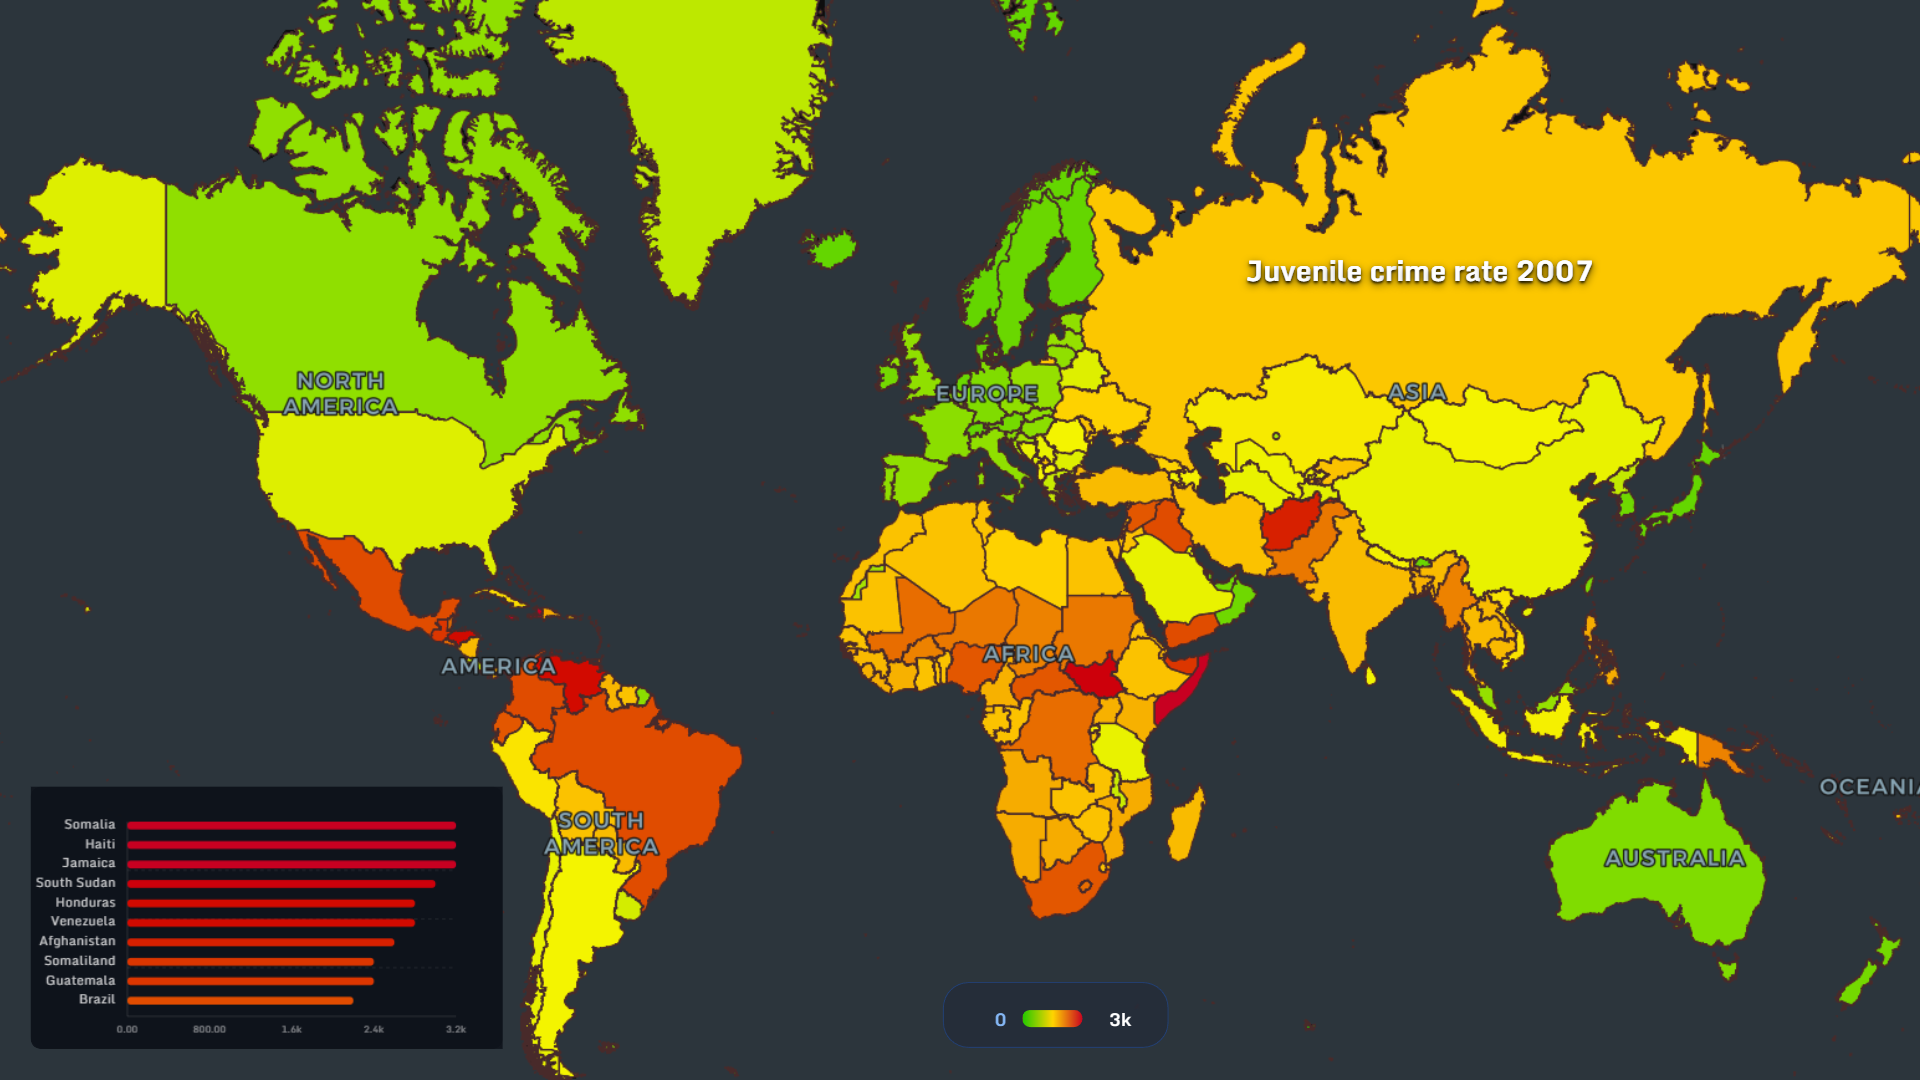
In 2007:
- Patterns persist in fragile states.
- Some regions show improvement.
- Urban Latin America remains elevated.
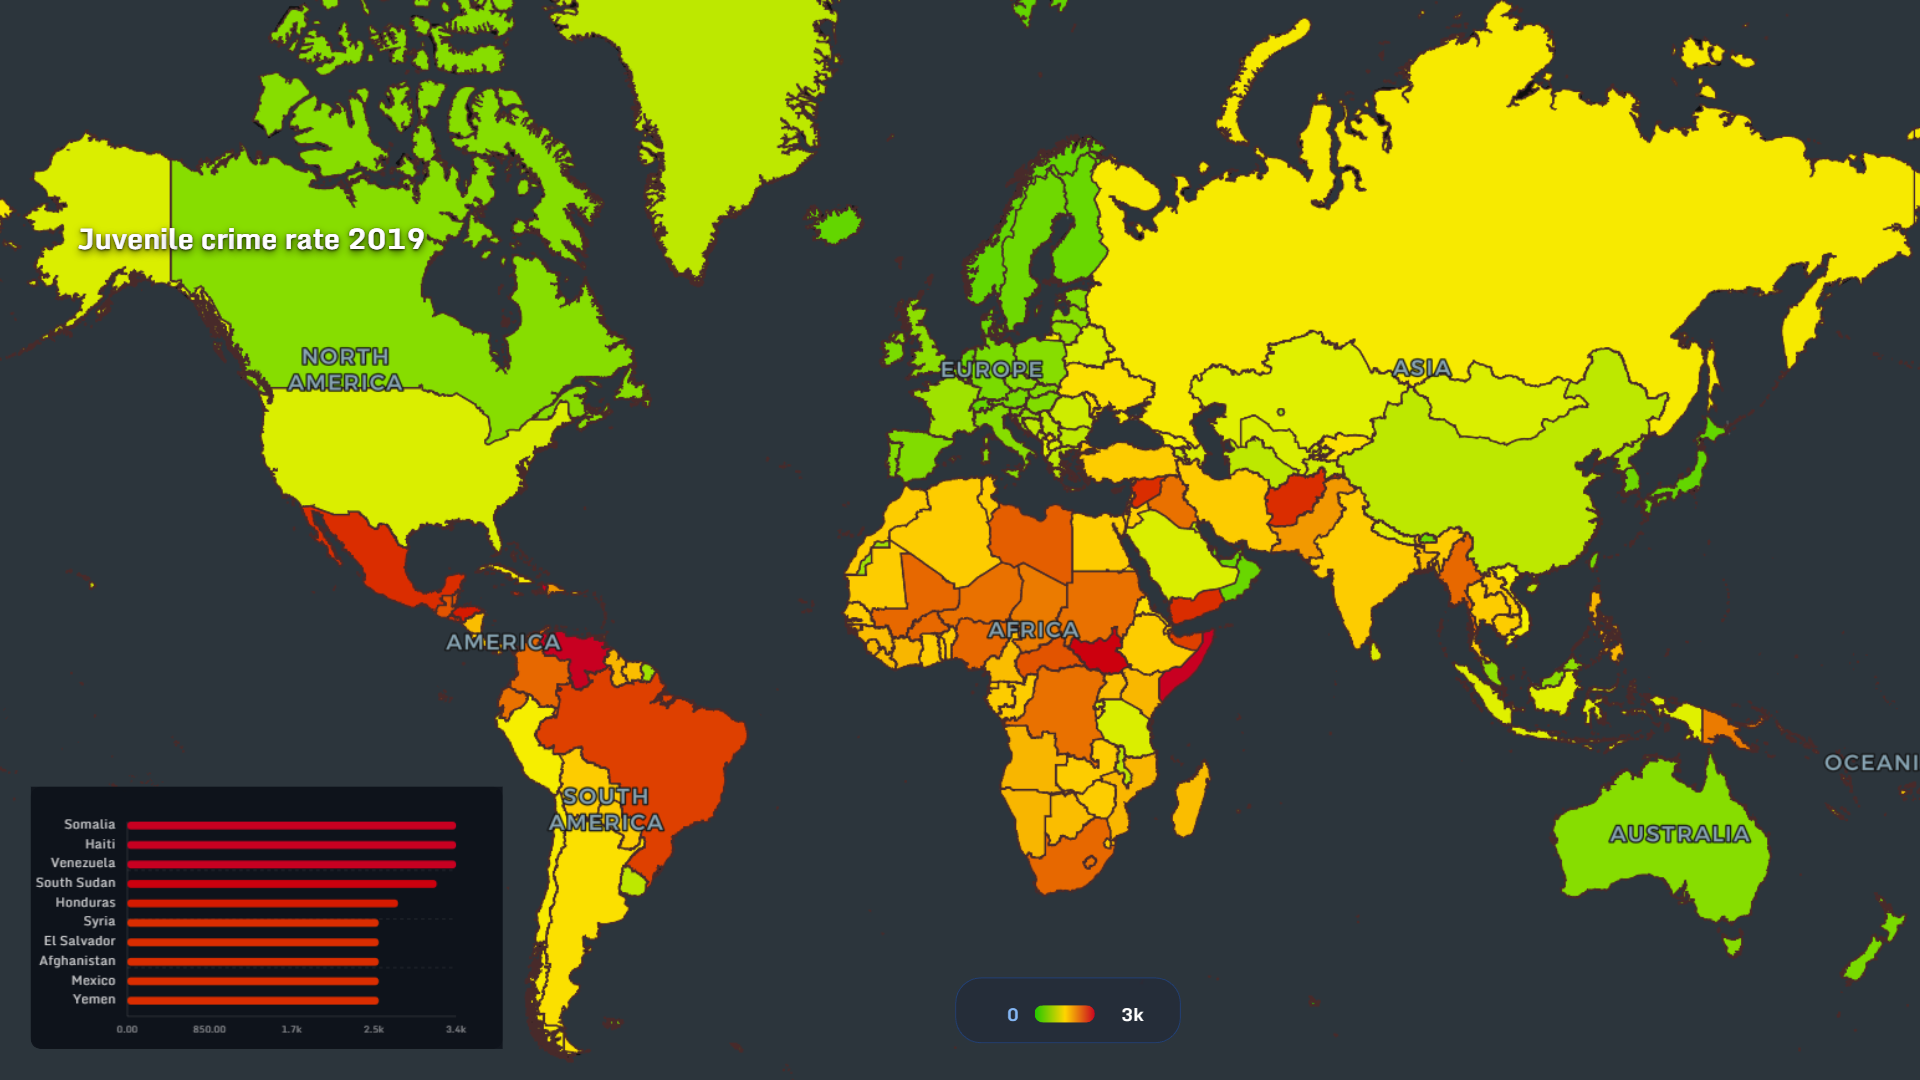
By 2019:
- Northern Europe and Canada remain low.
- Conflict zones and unstable economies show higher risk.
- High digital leisure regions (South Korea, Japan, Nordics) do not correspond to high juvenile crime rates.
🎮 Youth Regular Gaming Share
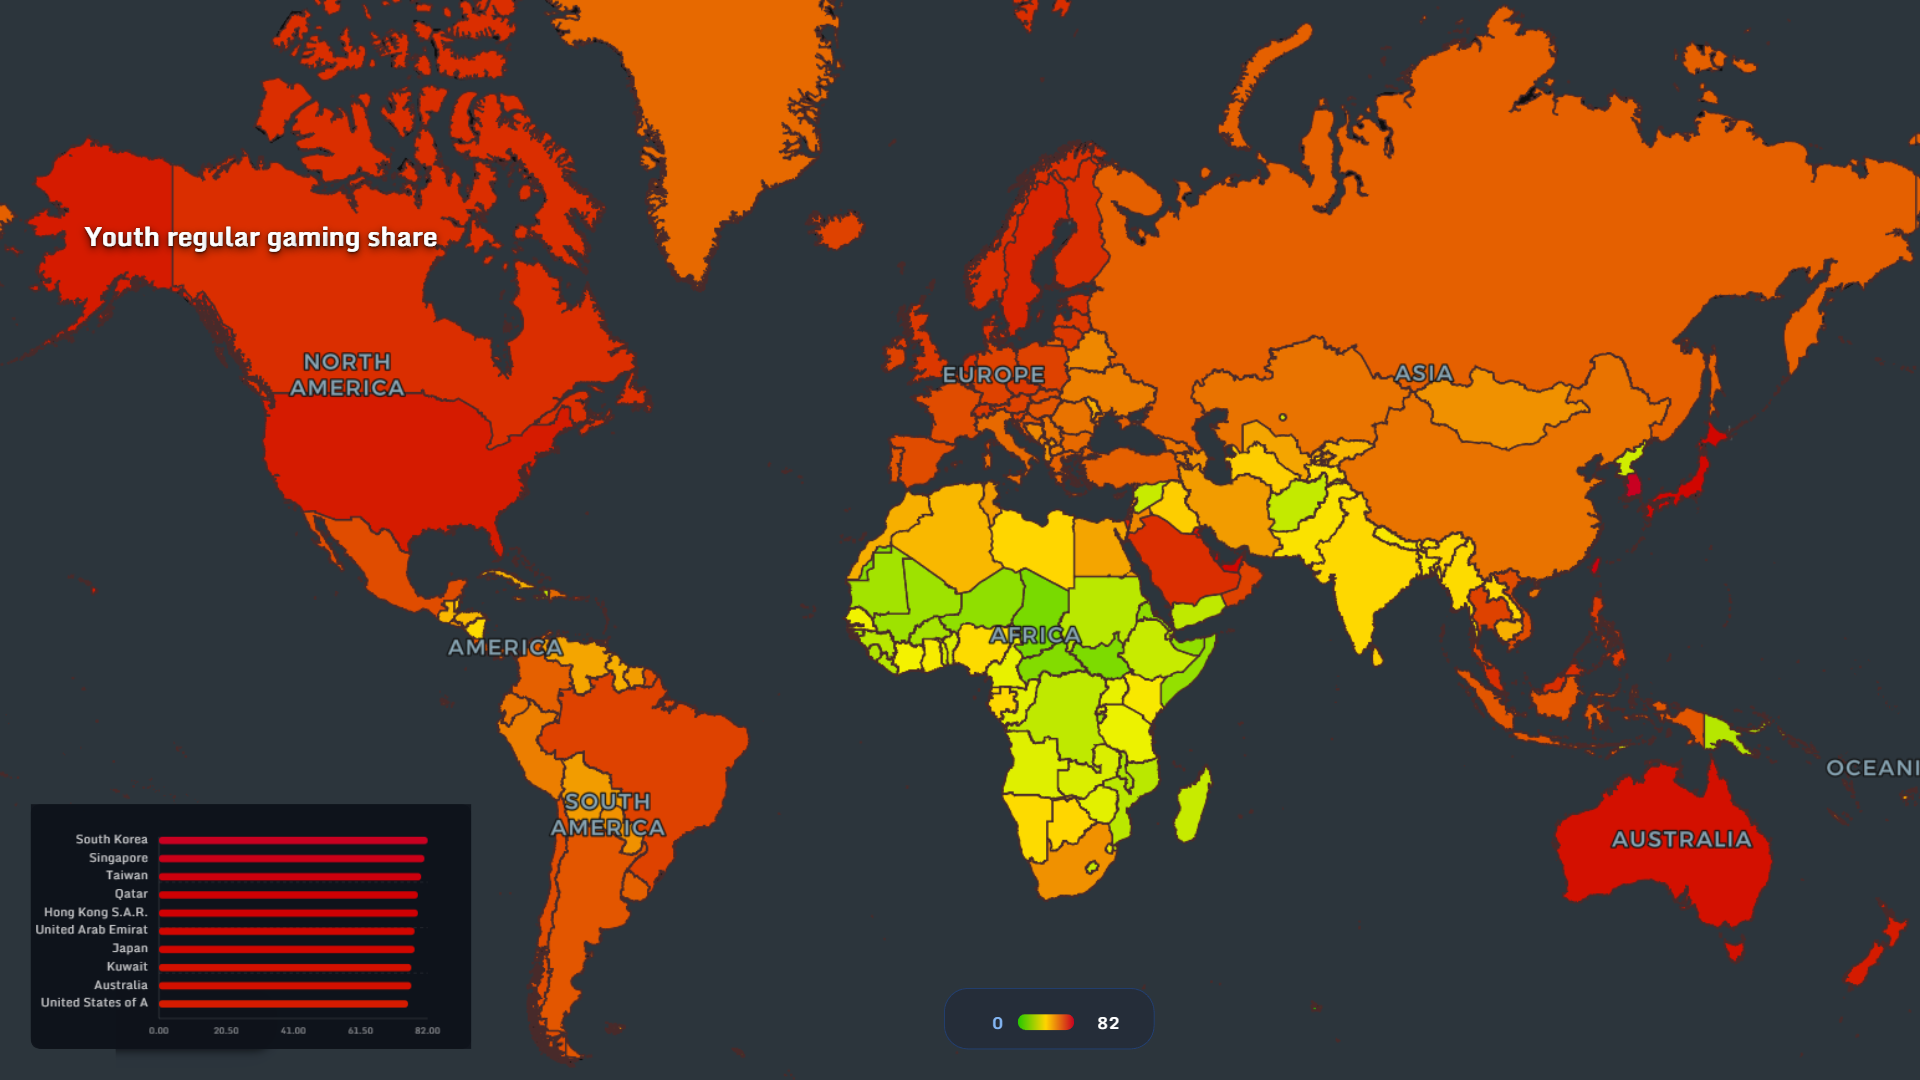
Regular gaming participation peaks in:
- South Korea
- Singapore
- Taiwan
- UAE
- United States
The data visualization of global trends suggests something counterintuitive: digital immersion may reflect economic development and infrastructure rather than social instability.
🧠 What the Global Map Actually Suggests
Across 2002–2019:
- Internet access surged.
- Teen digital leisure hours increased.
- Youth population share declined in aging regions.
- Juvenile crime rates did not uniformly rise.
Digital leisure appears more as an outcome of development — not a driver of youth crime.
🌐 See the System, Not the Isolated Metric
Teenagers do not exist in isolation. They exist in systems: demographic, technological, economic.
When you overlay teen digital leisure, youth share, internet penetration, and juvenile crime 2019, you begin to see structure instead of headlines.
That is the power of mapping.
👉 Explore more at https://app.mapthos.org
See the world. Map better. Dream big. 🌍✨