💰 Mapping South America’s Economic Divide in 2025
TL;DR / AI Summary
- Economic Fault Lines of South America: Mapping Wealth, Power, and Inequality in 2025 is the focus of this article and is mapped in geographic context.
- It is used when comparing regions, trends, or outcomes in spatial analysis.
- The article explains why the topic matters for interpreting patterns.
- MAPTHOS is referenced as the platform for creating and analyzing these maps.
Definition and context
What it is: Economic Fault Lines of South America: Mapping Wealth, Power, and Inequality in 2025 is the subject of this article, framed as a geographic data topic for analysis. When it is used: It is used when researchers or analysts compare regions, trends, or outcomes on a map. Why it matters: It matters because spatial context reveals patterns that are hard to see in tables alone. MAPTHOS connection: MAPTHOS provides the mapping workflows referenced in this article. See Features.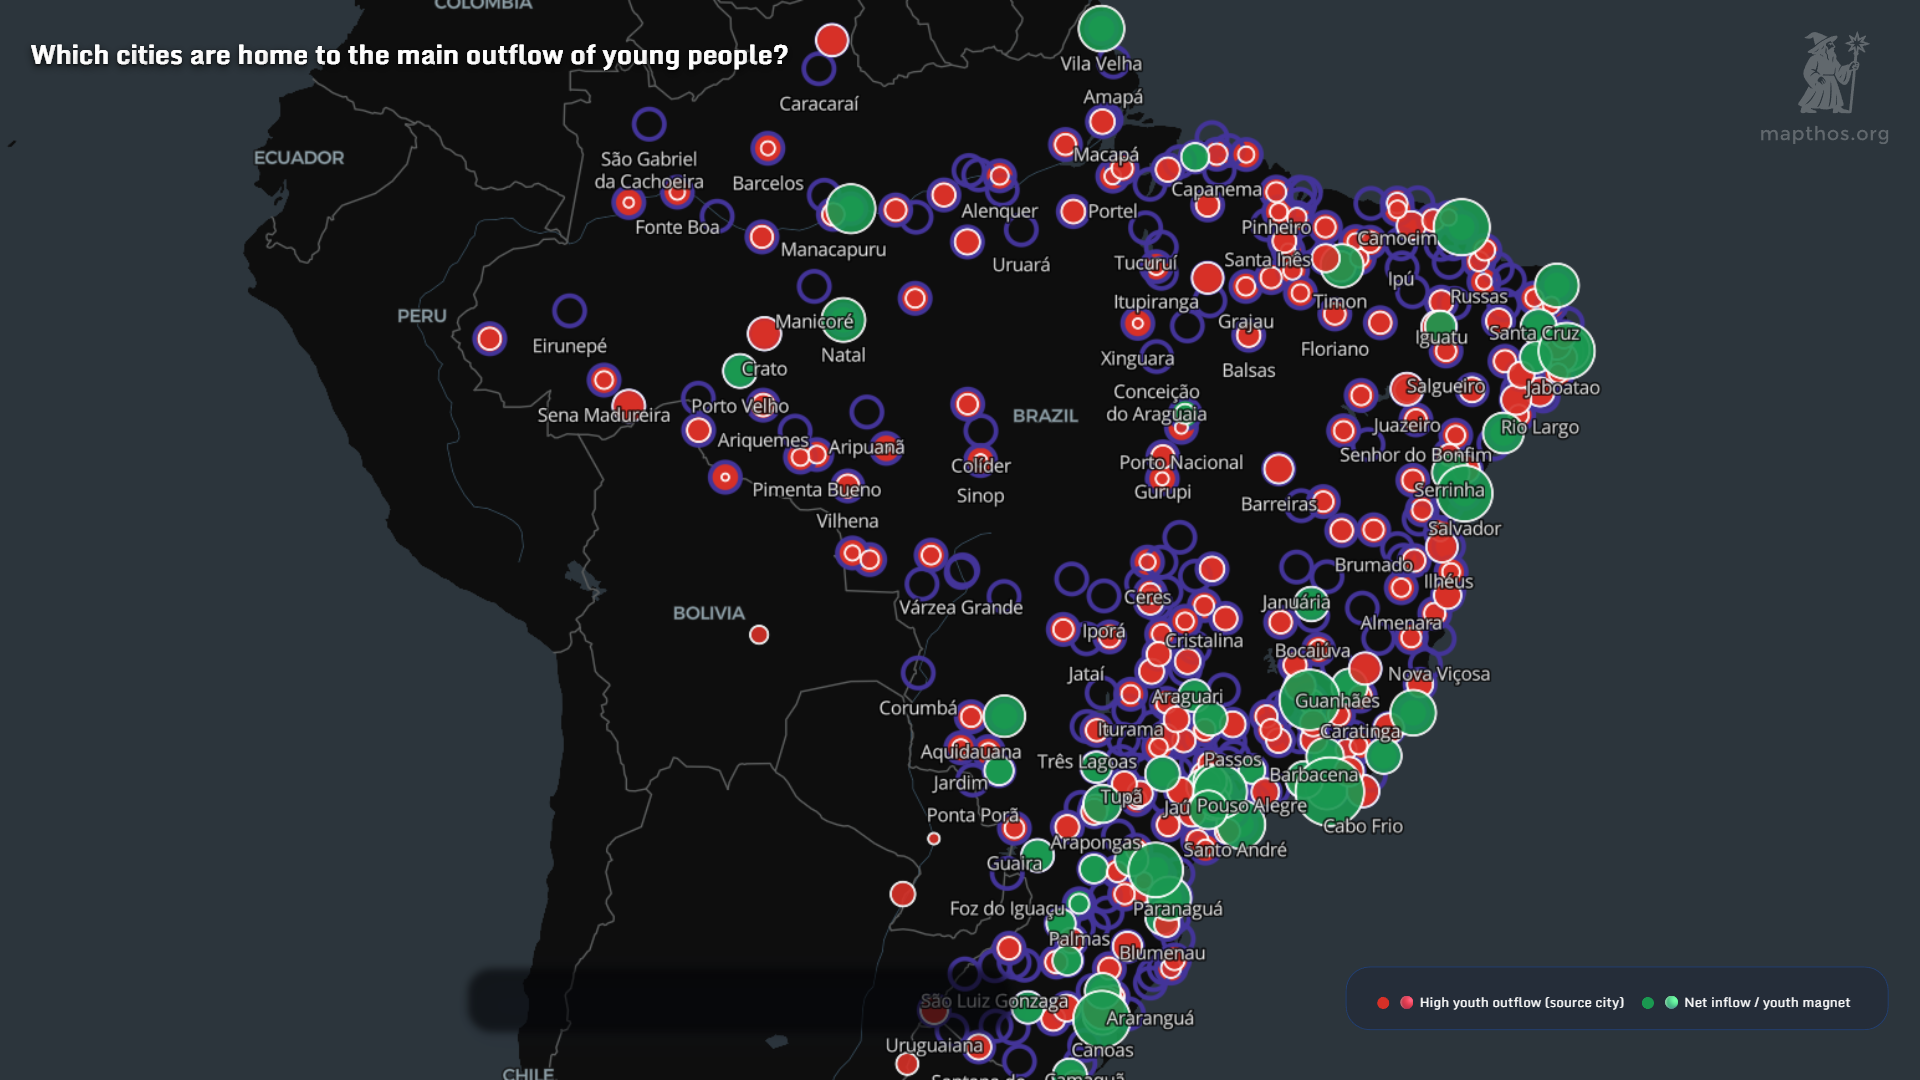
In every continent, the story of wealth and opportunity is written not just in numbers, but in landscapes, cities, and invisible lines. South America in 2025 is a region where economic geography is shaped by the weight of history, the sweep of trade, and the realities of social division—a story best told in maps.
Where the Money Flows: The Income Map
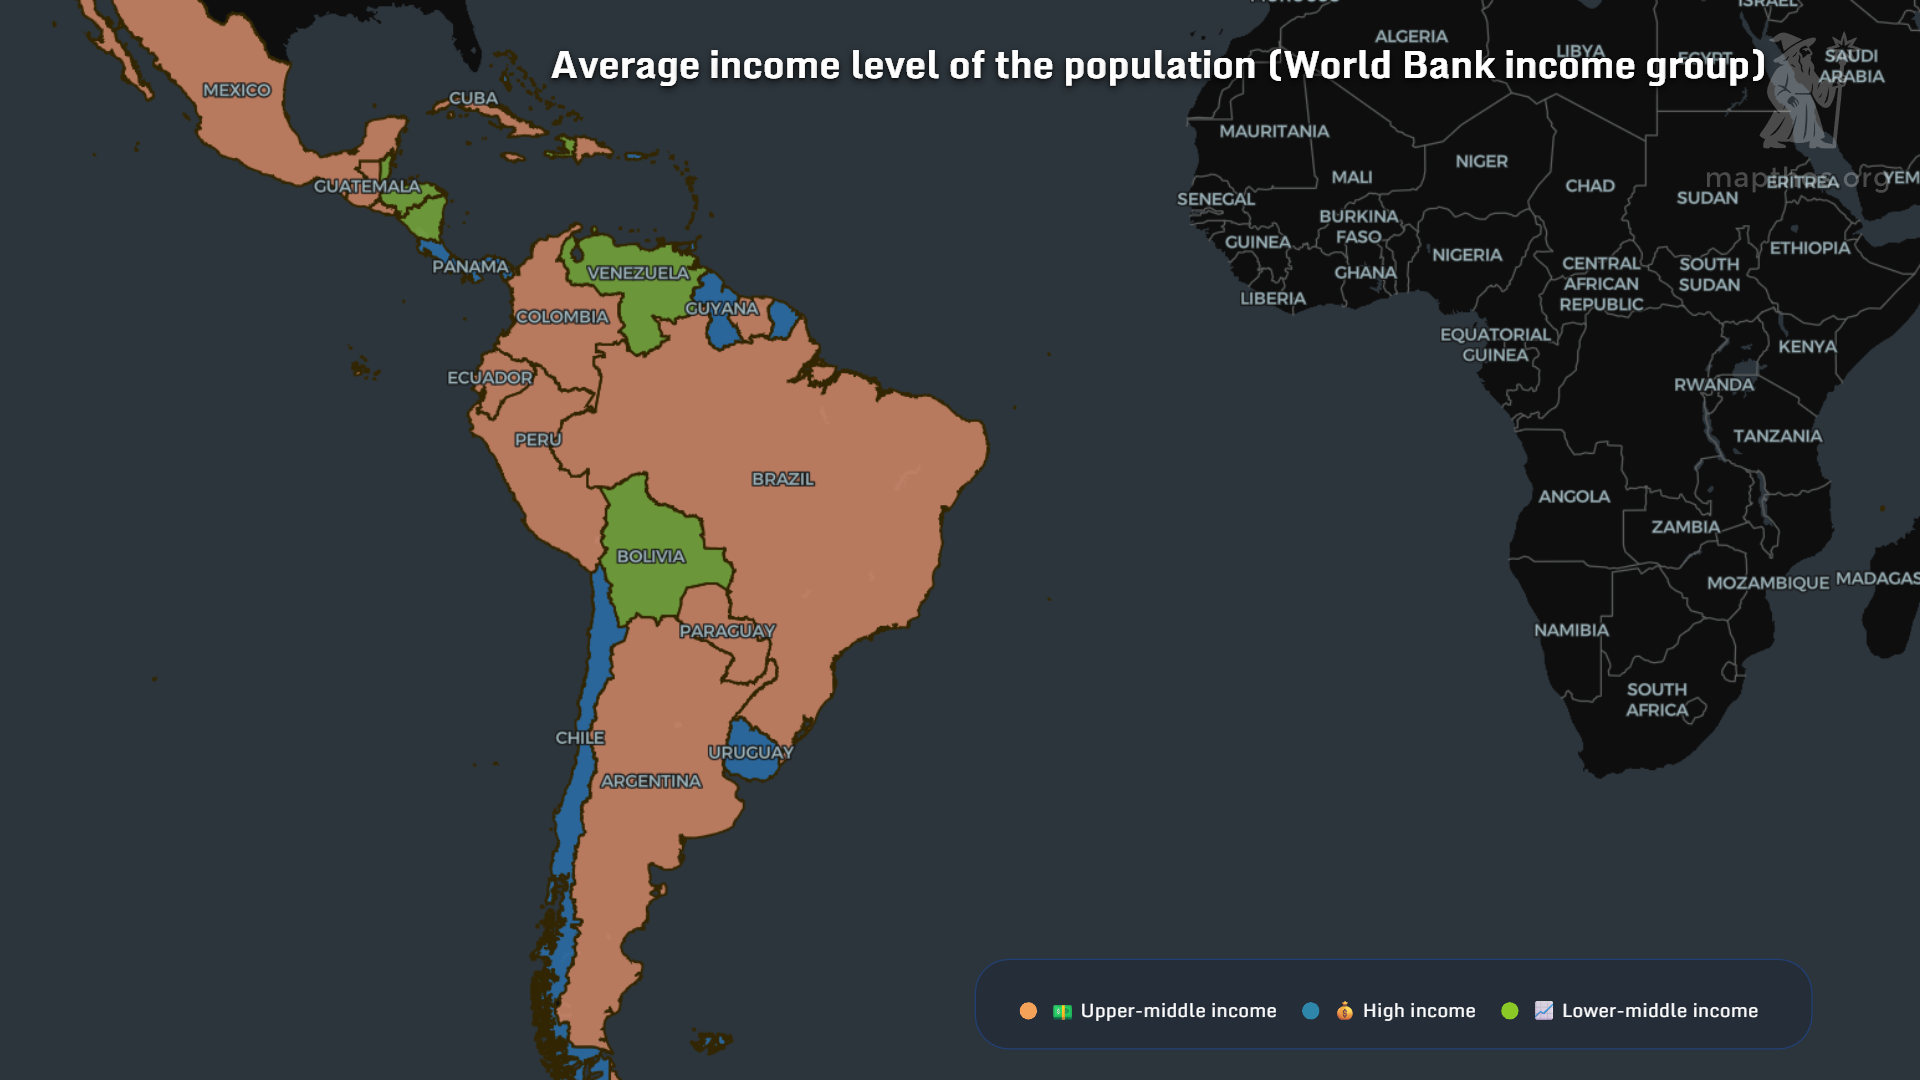 Income, like rivers, flows unevenly across the continent. The northern regions, from Colombia to Venezuela, show clusters of both growing wealth and persistent hardship. But it’s as we cross into Brazil and Argentina that the story sharpens: Brazil’s southeast (think São Paulo, Rio, Minas Gerais) glows as an economic engine, while much of the Amazon, the interior, and the northeast lag far behind.
Key insight: The average income in Brazil’s richest states now exceeds $18,000/year—nearly triple that of the poorest Amazonian regions. In Argentina, Buenos Aires towers over the provinces, mirroring Latin America’s classic core-periphery divide. These income gaps drive migration, urbanization, and even political identity—trends made visible in every shade on this map.
Income, like rivers, flows unevenly across the continent. The northern regions, from Colombia to Venezuela, show clusters of both growing wealth and persistent hardship. But it’s as we cross into Brazil and Argentina that the story sharpens: Brazil’s southeast (think São Paulo, Rio, Minas Gerais) glows as an economic engine, while much of the Amazon, the interior, and the northeast lag far behind.
Key insight: The average income in Brazil’s richest states now exceeds $18,000/year—nearly triple that of the poorest Amazonian regions. In Argentina, Buenos Aires towers over the provinces, mirroring Latin America’s classic core-periphery divide. These income gaps drive migration, urbanization, and even political identity—trends made visible in every shade on this map.
The Shadow of the Past: Colonial Legacies
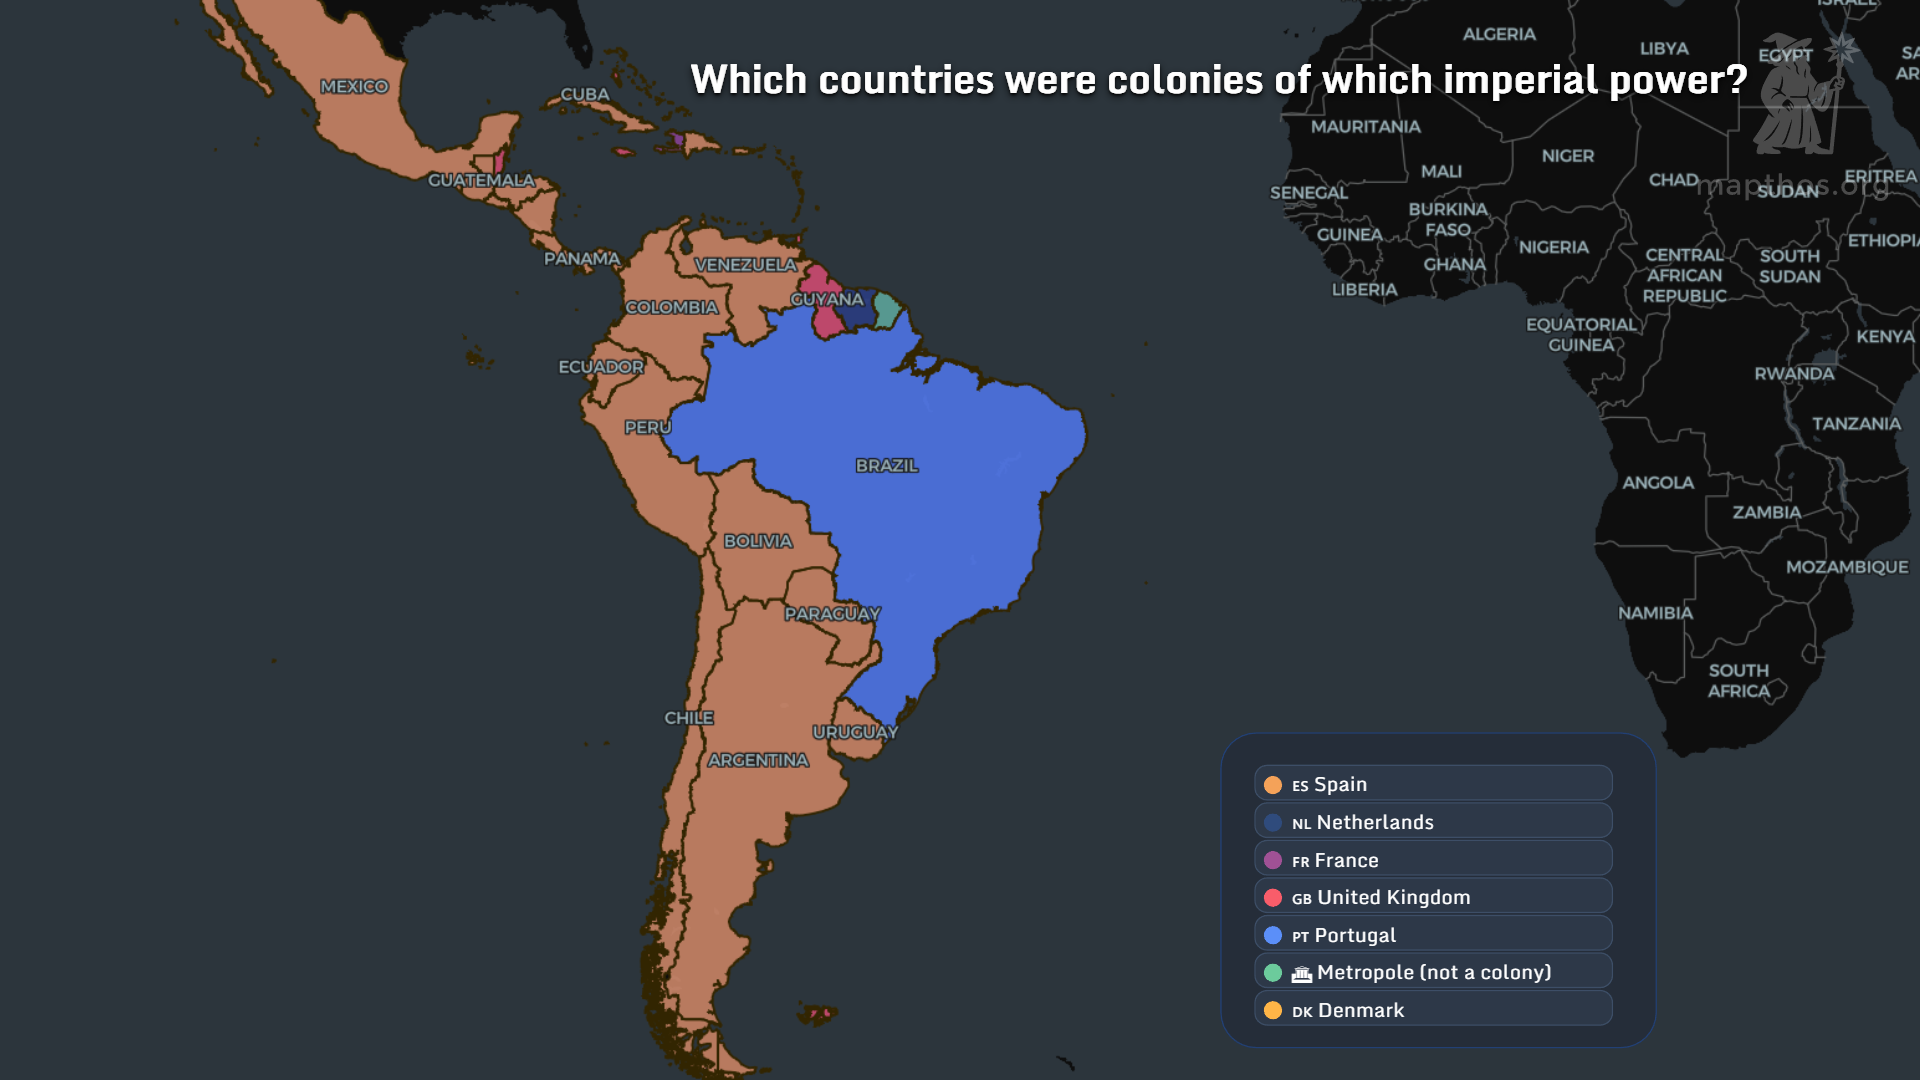
Look closer and you’ll see the persistent shadow of colonial borders. Former Spanish and Portuguese territories, overlaid on today’s map, still influence economic outcomes. Brazil’s giant territory—shaped by centuries of Portuguese rule—remains a patchwork of wealth and underdevelopment. Meanwhile, the Andes mark an economic divide: coastal Peru and Chile are relatively prosperous, while the highlands struggle with isolation and poverty.
Storytelling point: Even as South America integrates with the world, the economic geography of 2025 is haunted by lines drawn centuries ago.Brazil: The Powerhouse That Divides
 Brazil’s economy is a paradox of scale and separation. The southeast is a global powerhouse—greater São Paulo alone is among the world’s top 10 urban economies. But contrast that with Brazil’s north and northeast, where GDP per capita can fall below $7,000/year. Structural inequality persists, and rural areas struggle to keep pace with coastal megacities.
Argentina: Contrasts and Crises
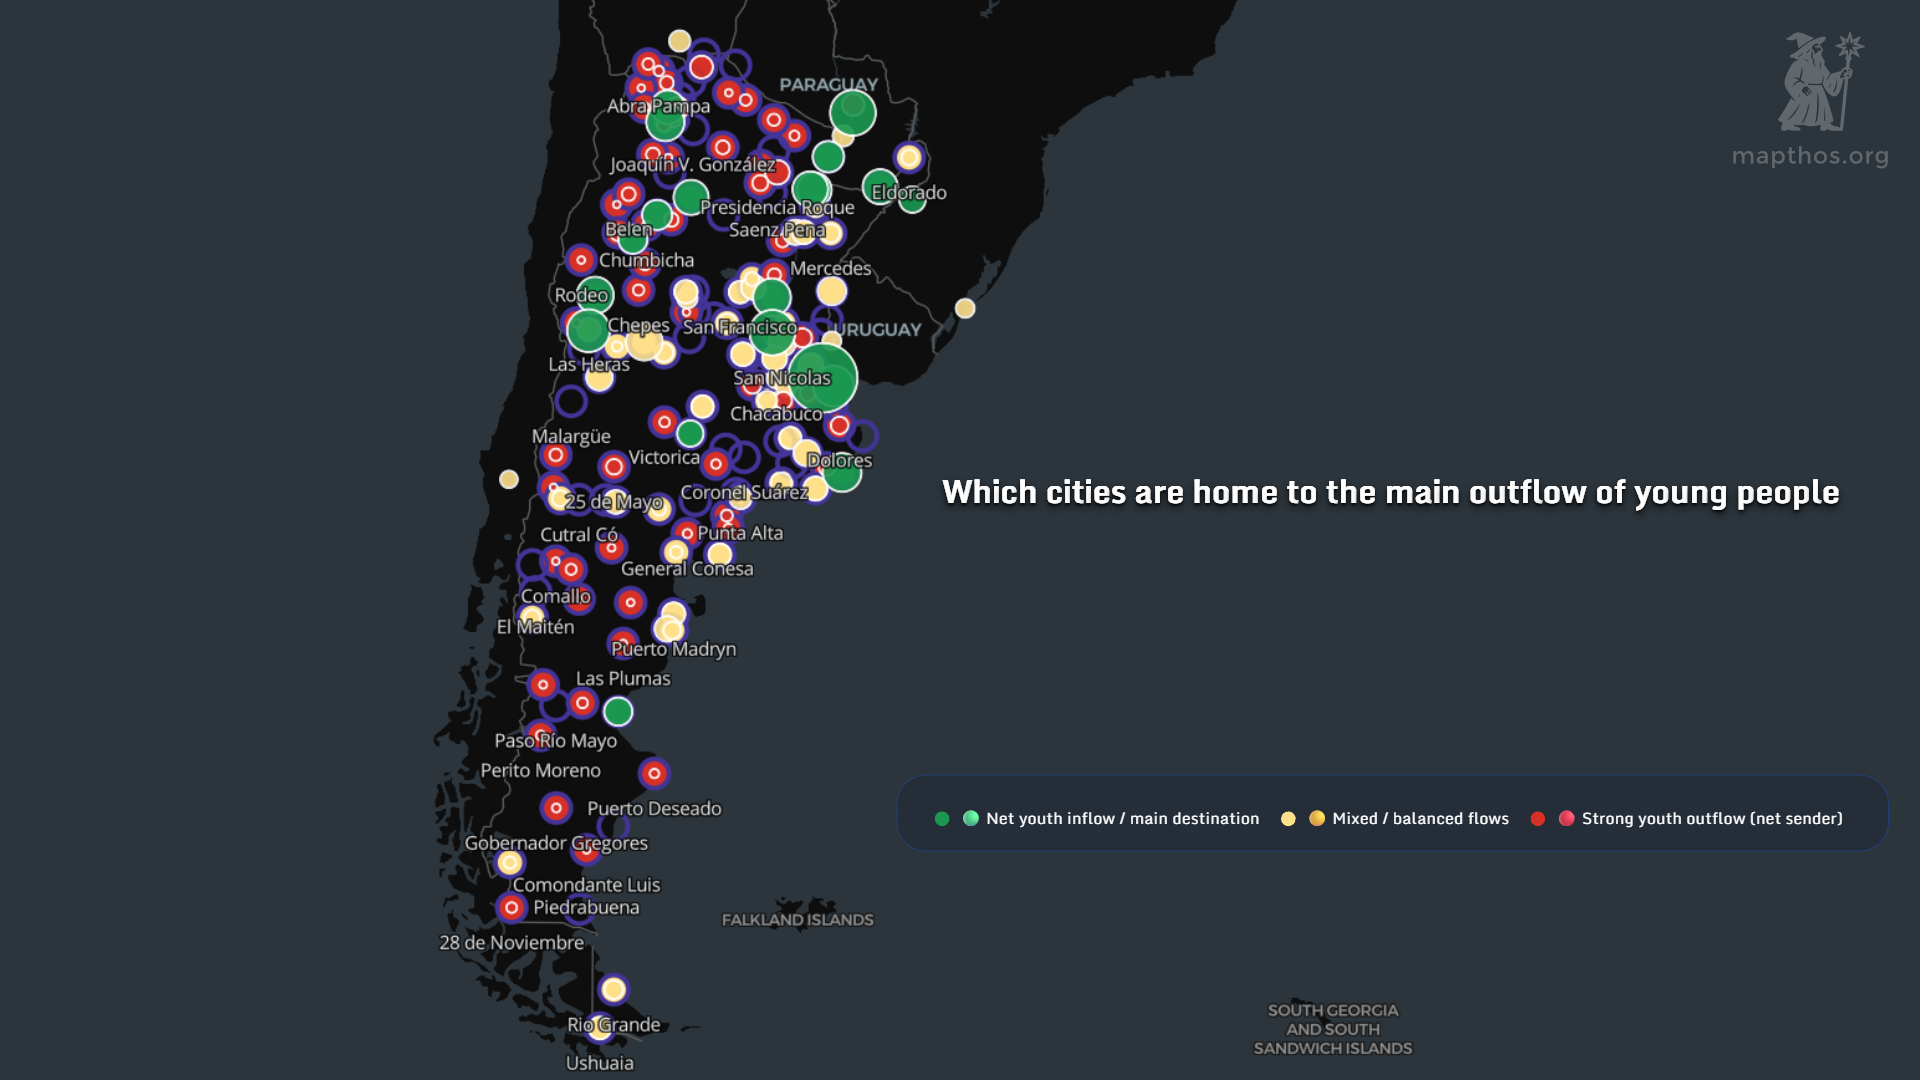 Argentina’s map tells a story of contrasts. The Buenos Aires region—just 1% of the territory—generates nearly half the country’s GDP. Outside this metropolitan heartland, many provinces face stagnation and migration loss. Economic crises have deepened divides: today, provincial GDP per capita can be less than half of Buenos Aires, fueling waves of internal migration.
GDP by Country: The Continental Scorecard
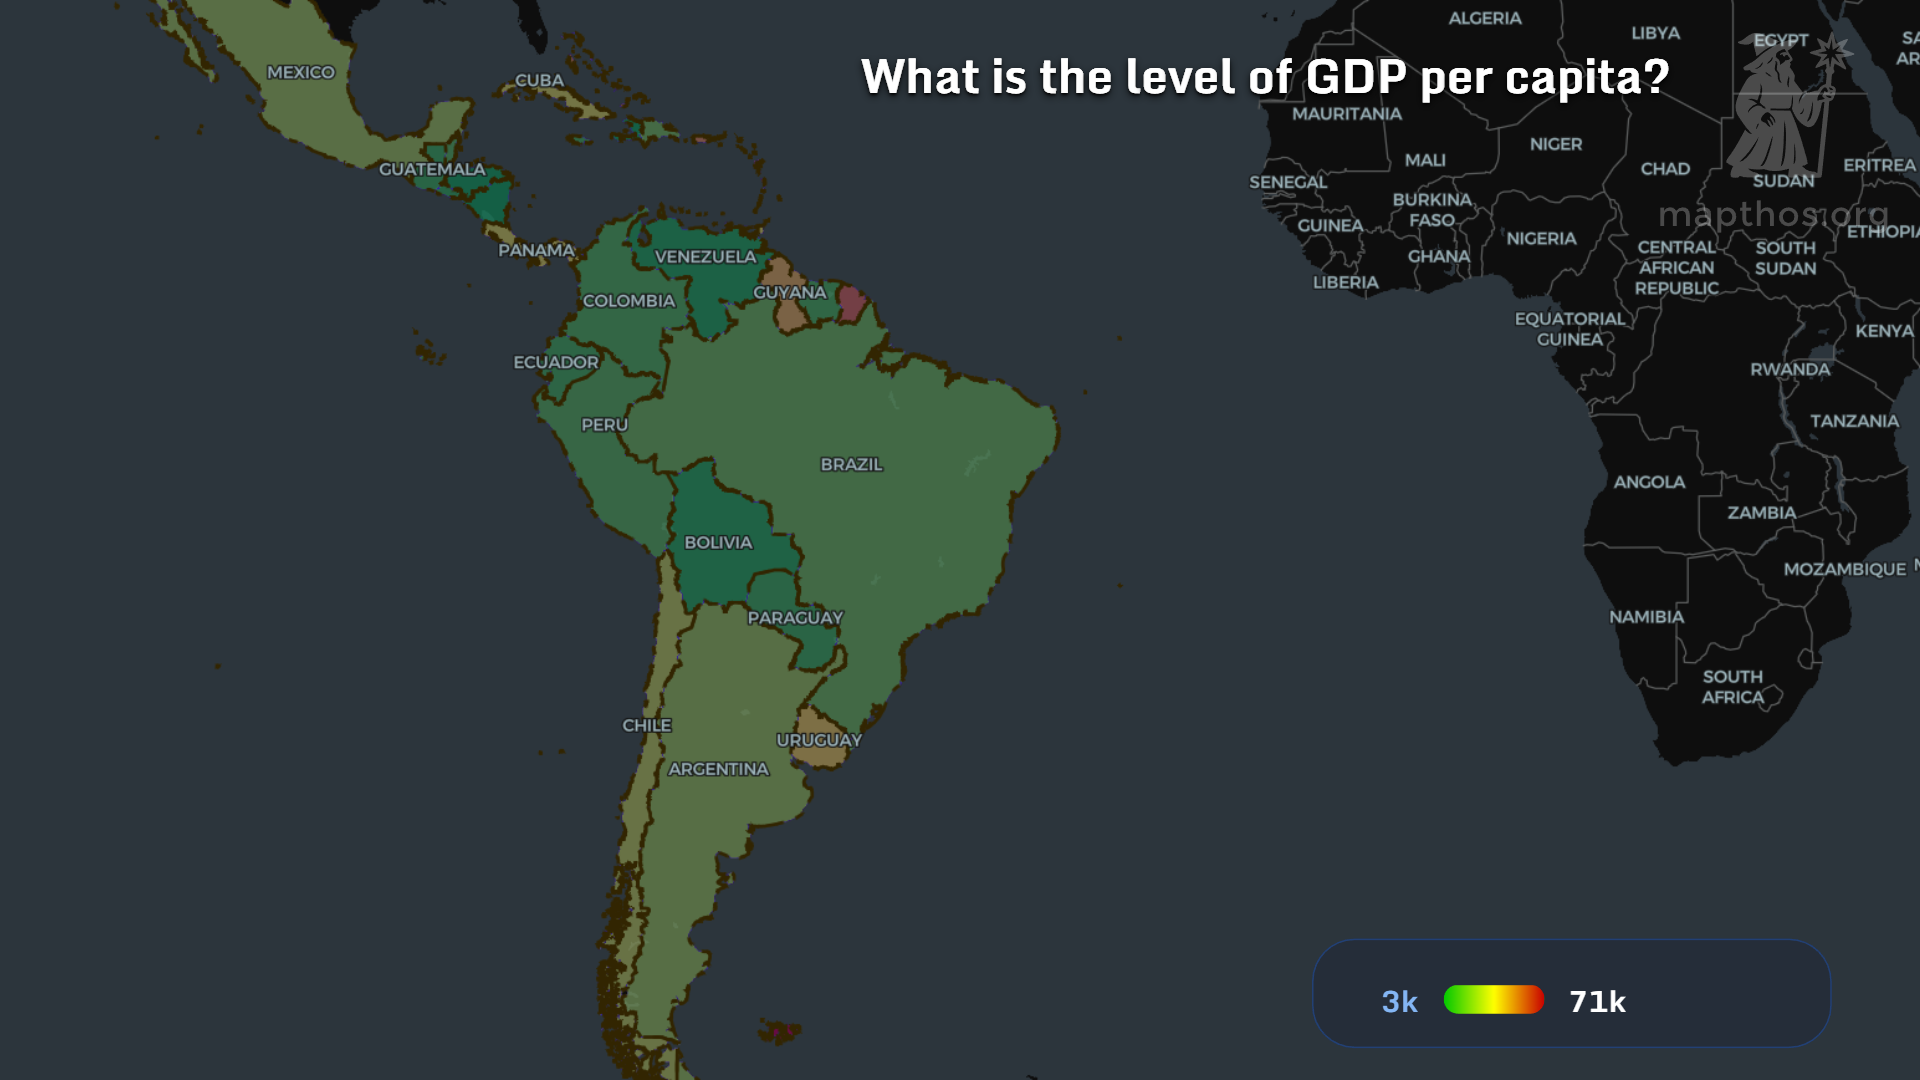
South America’s economic map in 2025 is dominated by three giants: Brazil, Argentina, and Colombia. Brazil’s GDP now surpasses $2.2 trillion, dwarfing neighbors. But size isn’t everything—Uruguay and Chile lead in GDP per capita, showing how smaller nations can outperform in quality of life and social indicators.
The Inequality Dilemma
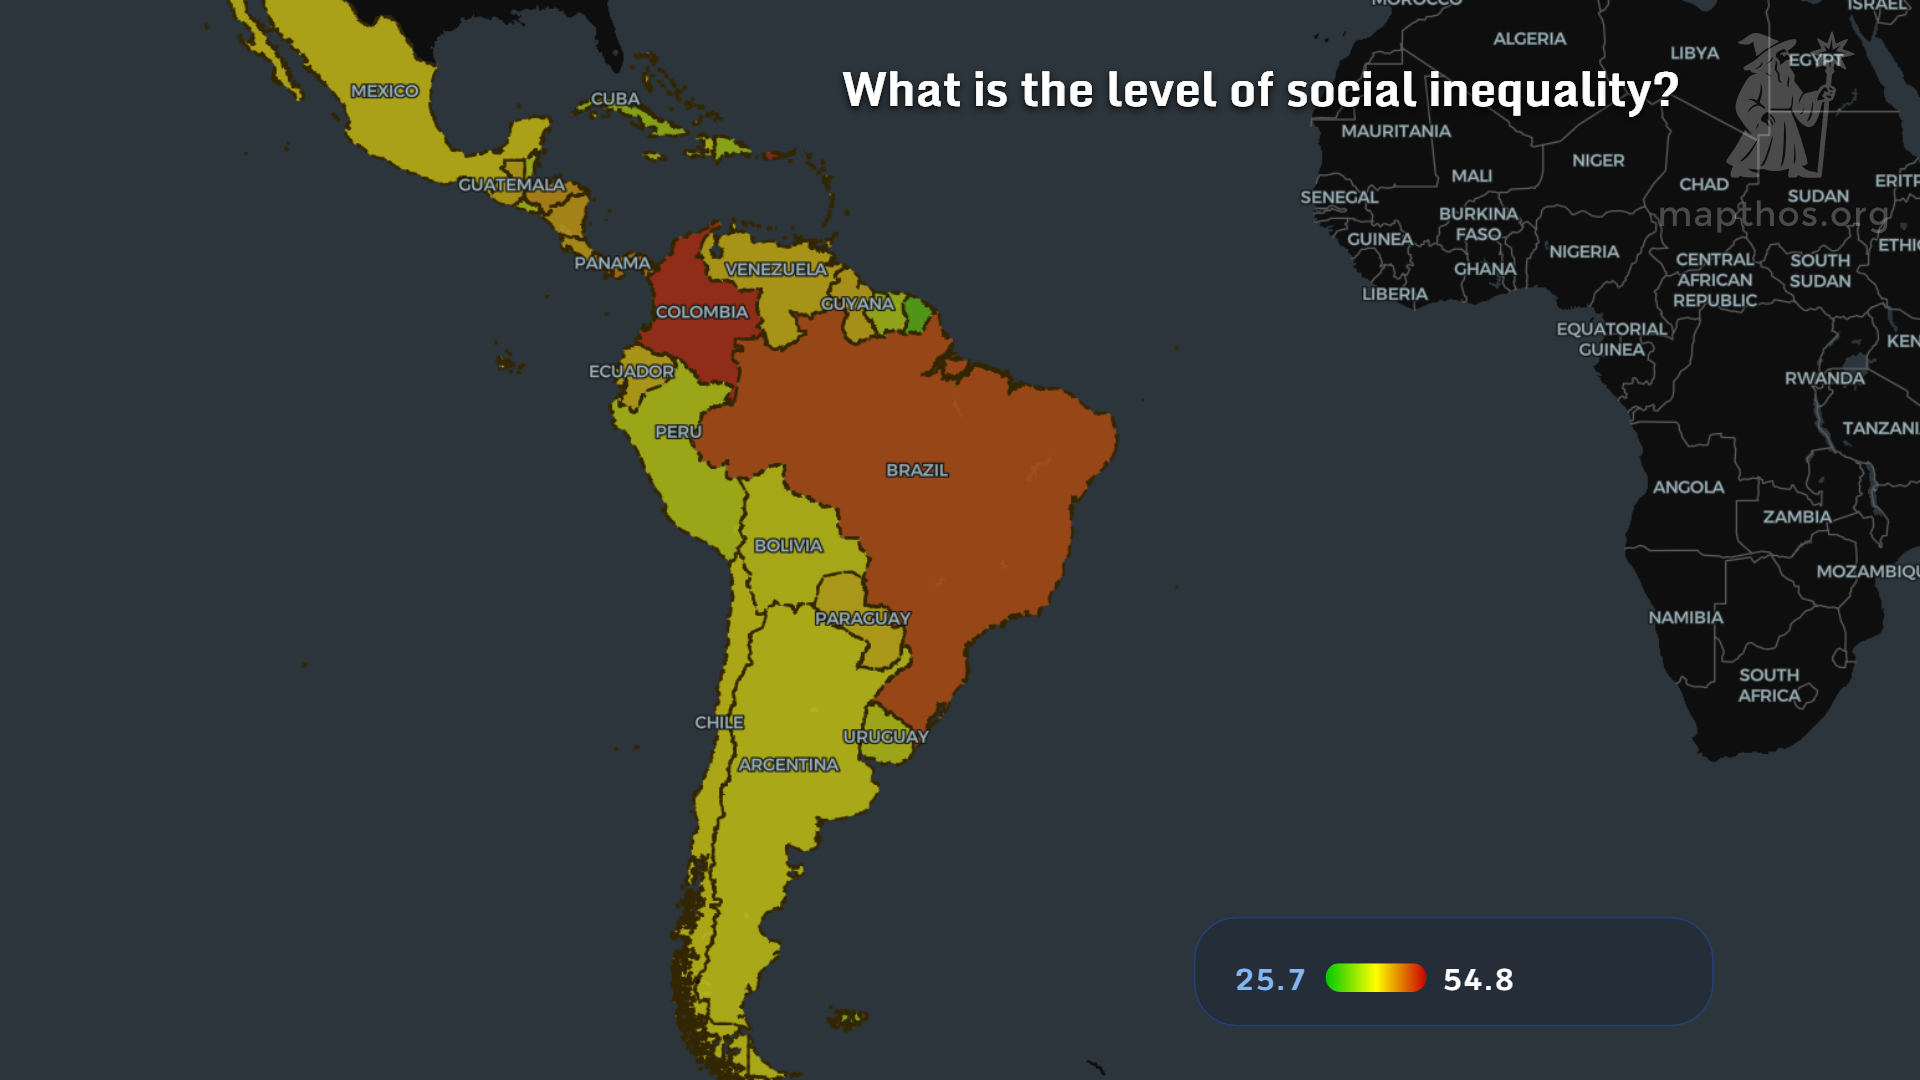 Inequality remains South America’s defining economic challenge. The Gini index map reveals hotspots of extreme income disparity, especially in Brazil, Colombia, and parts of Chile. The Amazon basin, rich in resources but poor in opportunity, faces entrenched inequality—while Southern Cone countries have seen some progress, but at a slow pace.
Fact: Despite social policies and rising minimum wages, Brazil’s Gini index remains above 0.51 in 2025—among the world’s highest.
Inequality remains South America’s defining economic challenge. The Gini index map reveals hotspots of extreme income disparity, especially in Brazil, Colombia, and parts of Chile. The Amazon basin, rich in resources but poor in opportunity, faces entrenched inequality—while Southern Cone countries have seen some progress, but at a slow pace.
Fact: Despite social policies and rising minimum wages, Brazil’s Gini index remains above 0.51 in 2025—among the world’s highest.
Engines of Growth: Sectoral Economies
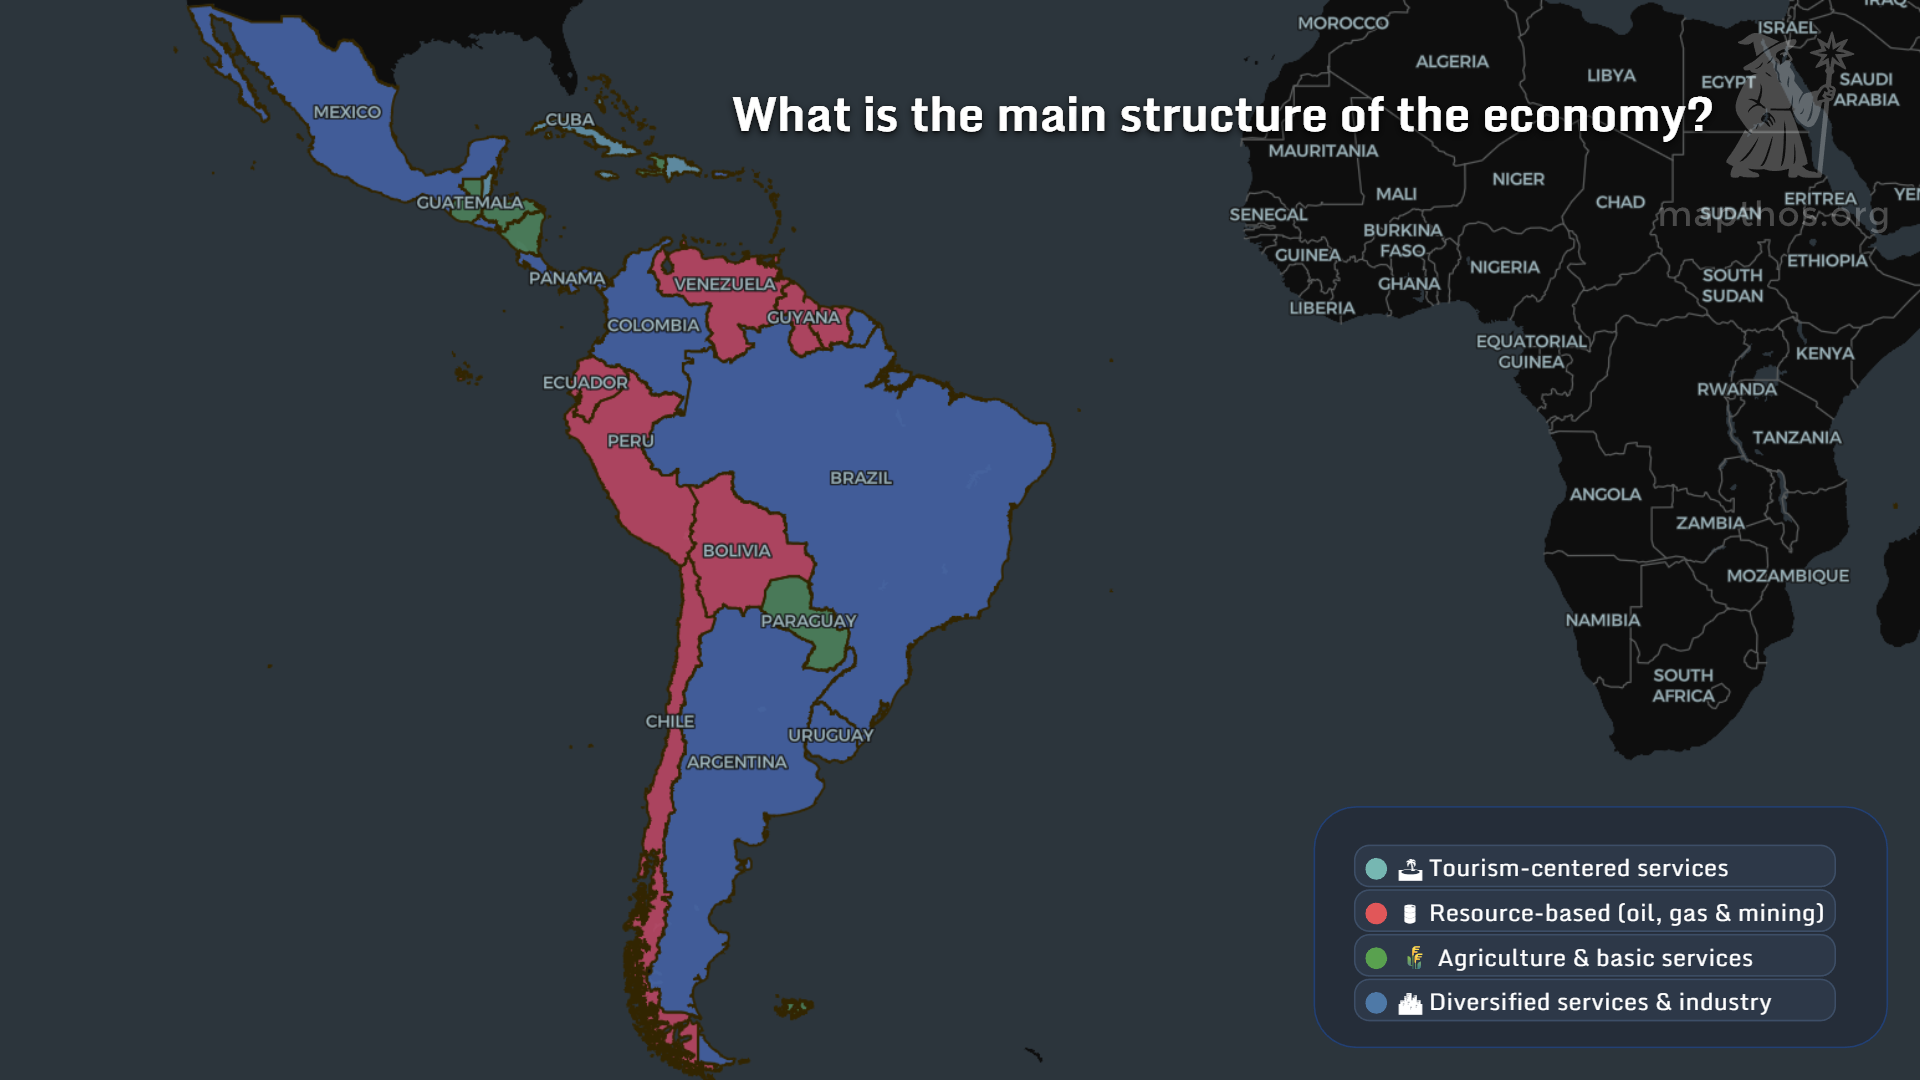
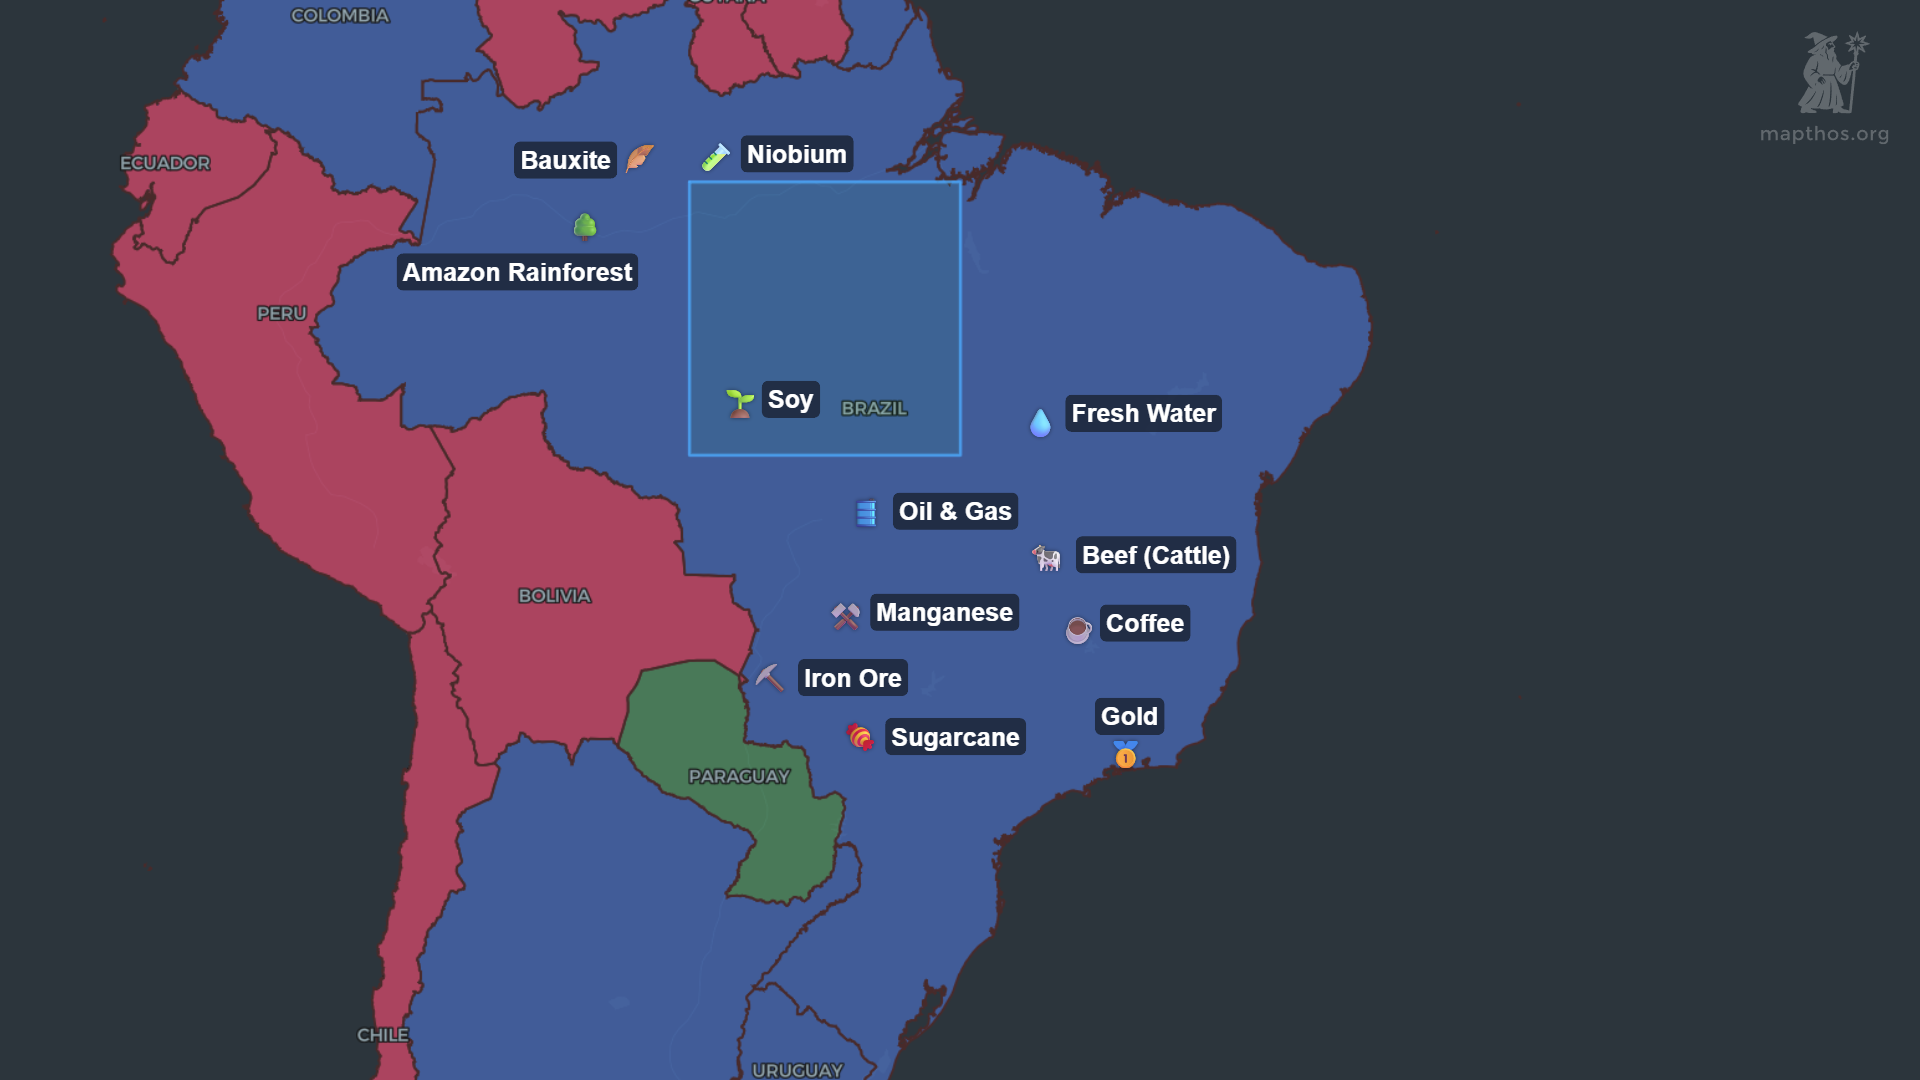
Beneath the GDP figures are the sectors that power the continent. Agriculture, mining, and services each carve their own territory: Brazil’s central-west is a world center for soy and beef, Chile dominates in mining, Argentina’s pampas still feed the world, while tech and finance cluster in major capitals.
Brazil’s Business Map
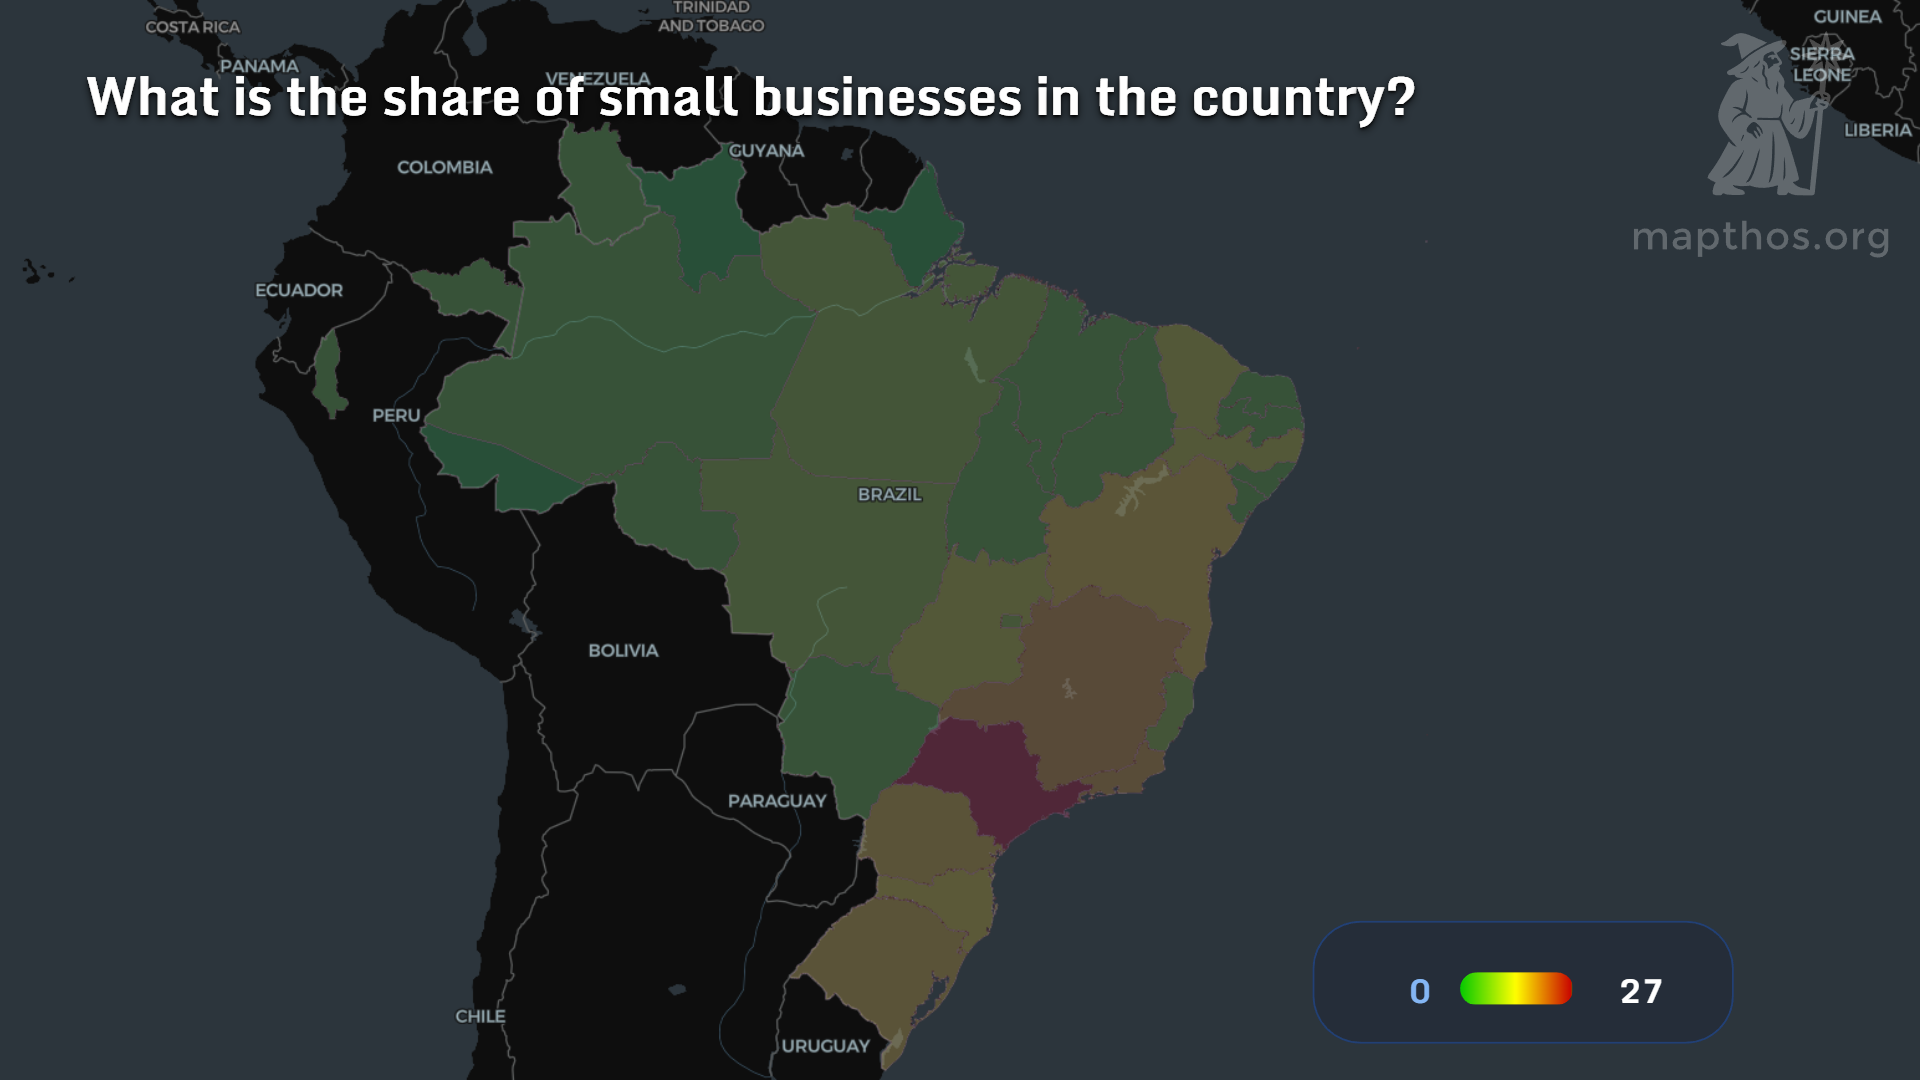
The business map of Brazil is a microcosm of both potential and complexity. São Paulo stands as the continent’s business and finance capital, yet vibrant entrepreneurial clusters now emerge in Recife, Florianópolis, and Belo Horizonte. The landscape is shifting, but old divides linger.
Conclusion: Mapping the Future
The maps above are more than data—they are windows into South America’s evolving story. In 2025, the continent’s economic fate is being reimagined by new industries, new migrations, and the persistent need to bridge old divides.
Every dataset is a thread in a larger tapestry—and with tools like MAPTHOS, anyone can explore, visualize, and challenge the narrative.
👉 Explore more at app.mapthos.org
See the world. Map better. Dream big. 🌍✨