🌍 Resource Nations in 2026: The Geography of Power
We often speak about technology, finance and AI as if geography no longer matters.
But beneath every modern system lies something older:
soil, water, forests, minerals, fuel.
This data visualization of global resources shows a truth markets sometimes forget — nations still rise or struggle on physical foundations.
🌾 Arable Land Is Quiet Strategic Power
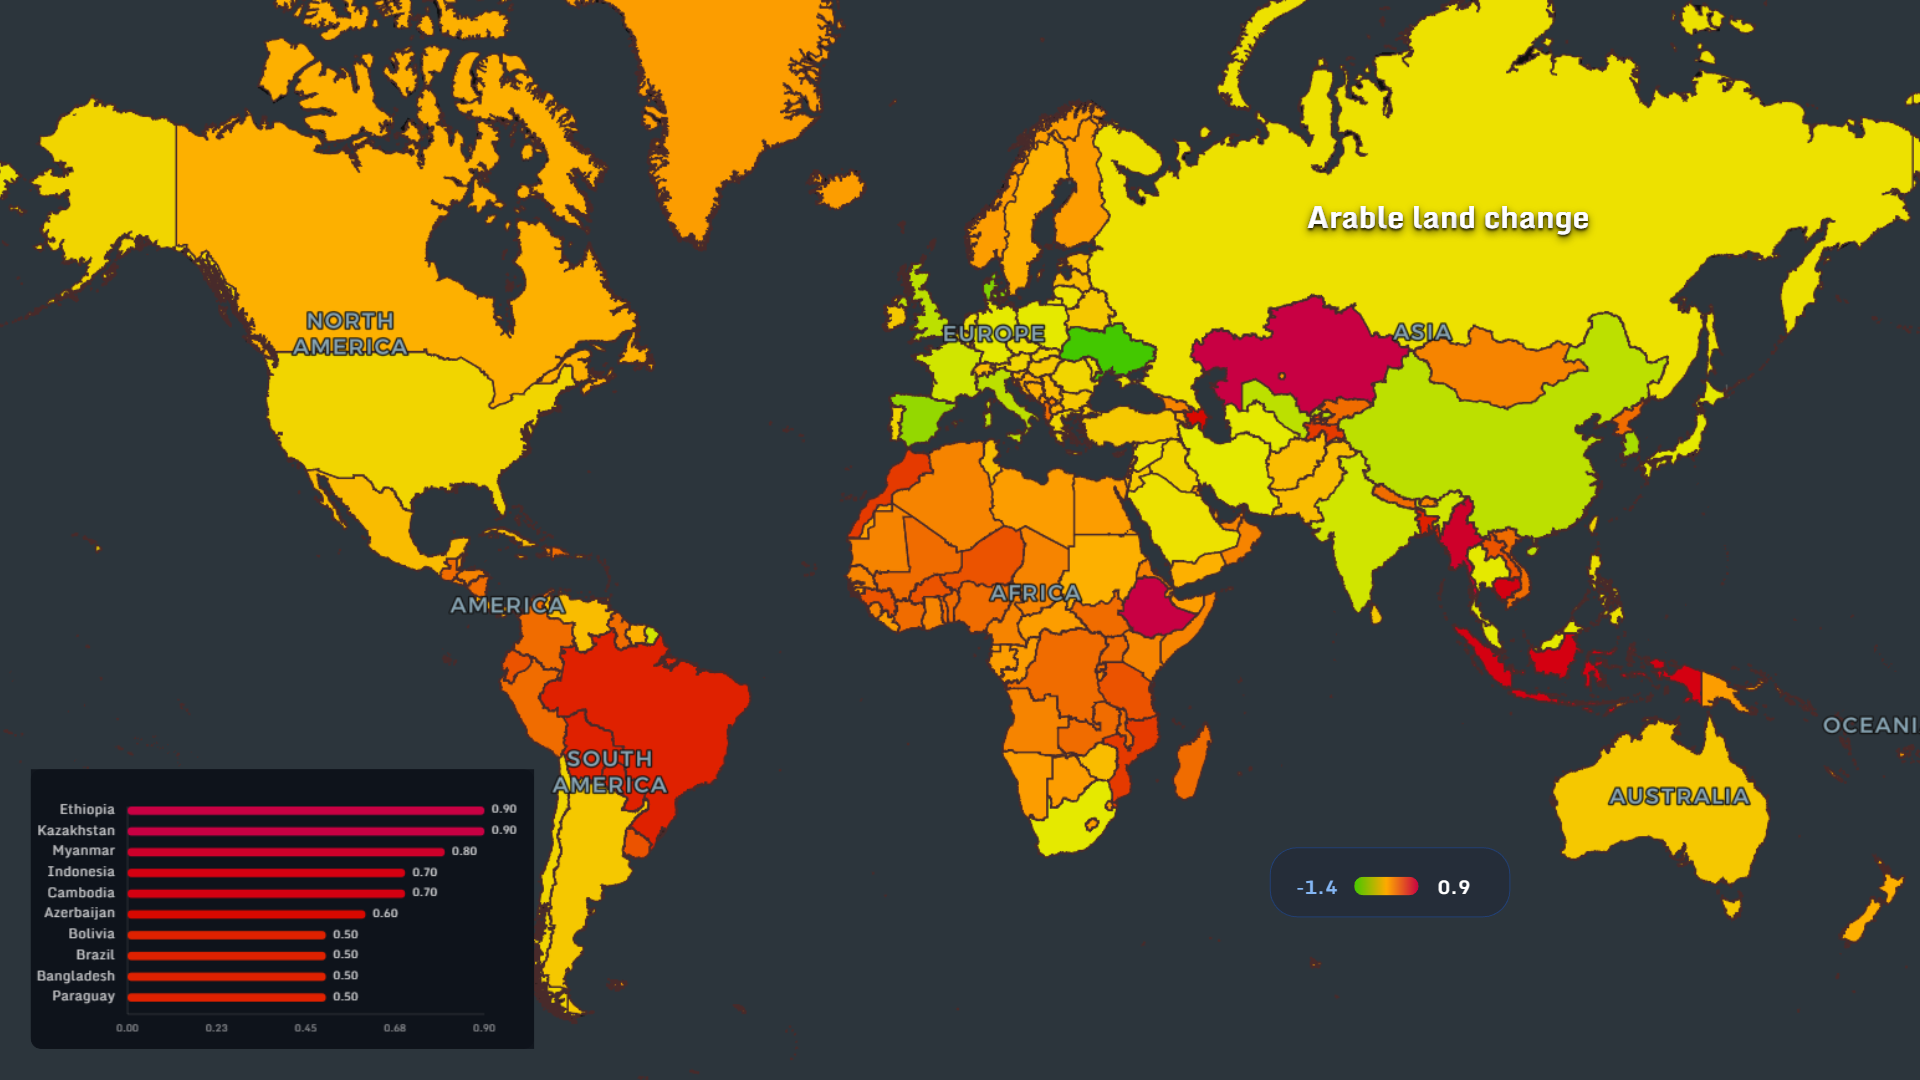
The arable land change map highlights where farming capacity is expanding or shrinking.
- Ethiopia and Kazakhstan show strong gains
- Parts of Southeast Asia also rise
- Several mature economies remain flat or decline
🚜 Irrigated Agriculture Changes Survival
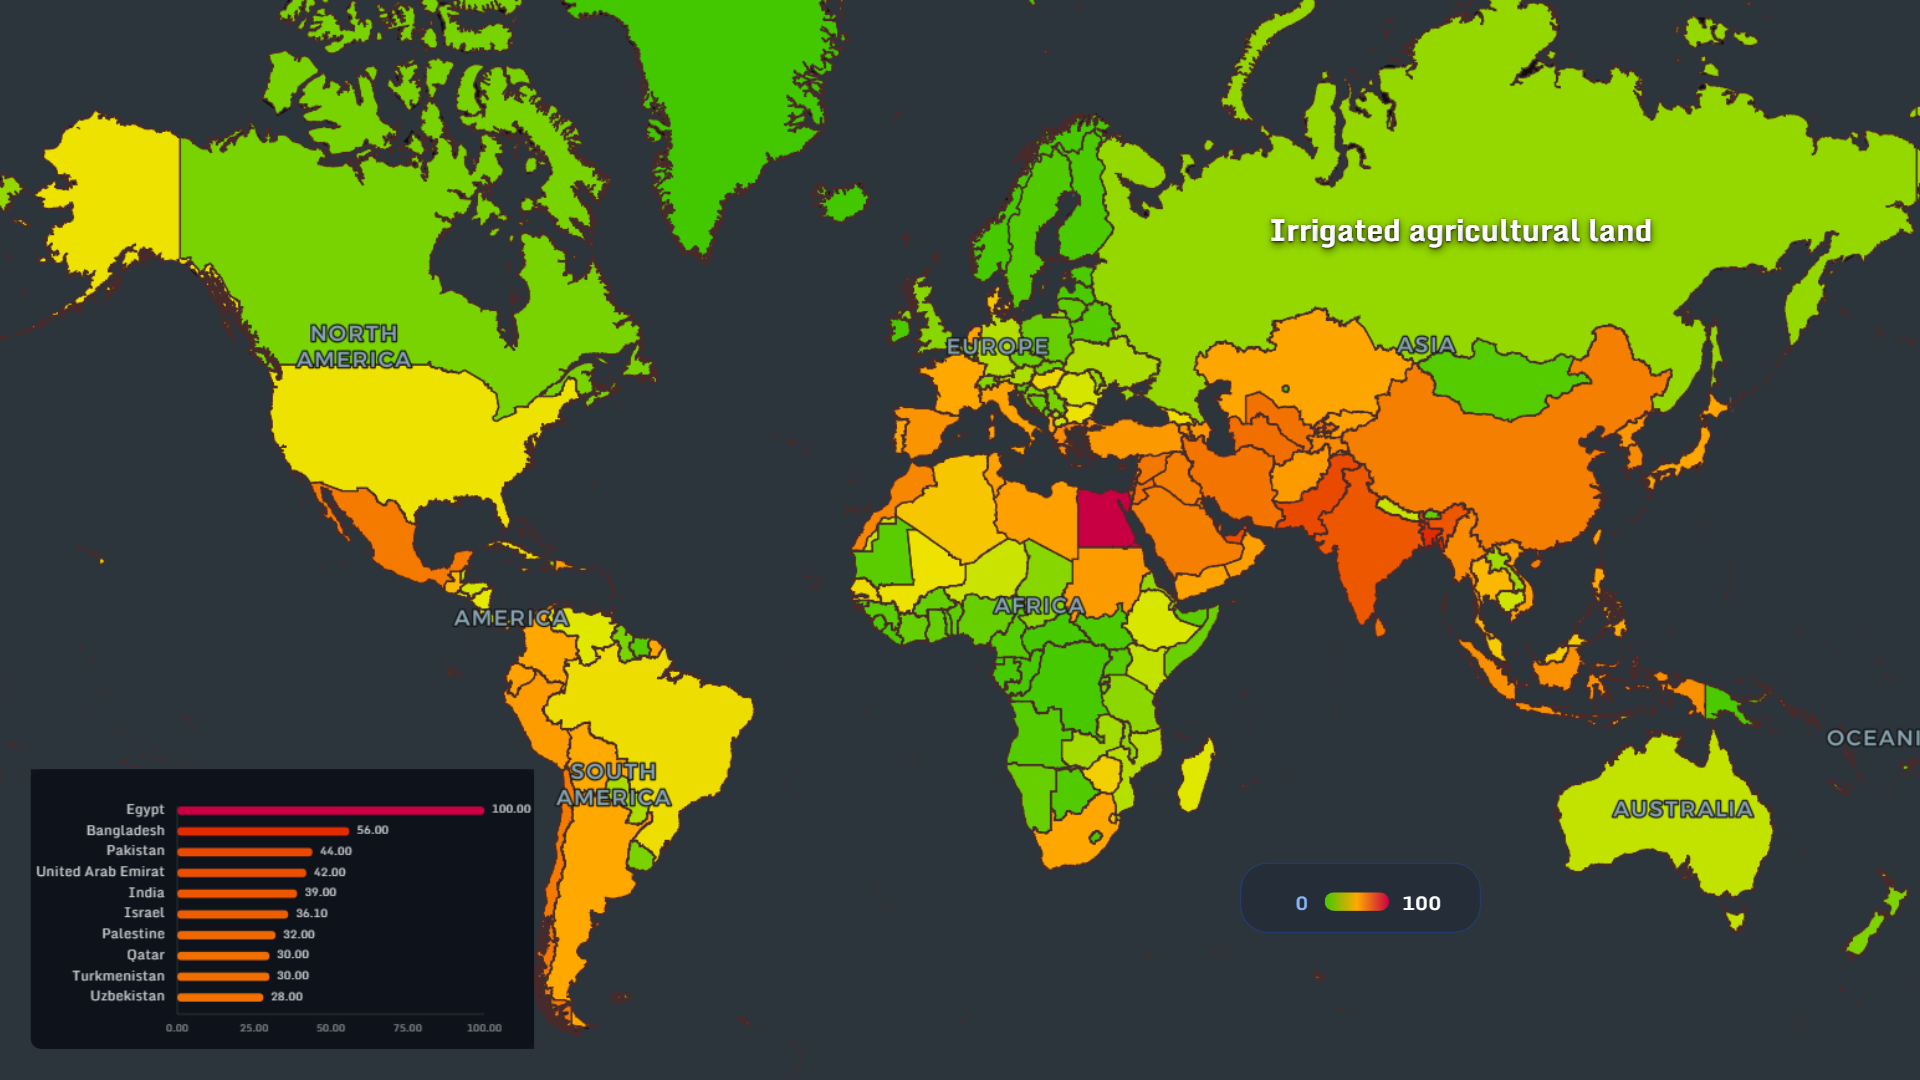
The irrigated agricultural land map reveals where farming is engineered rather than purely natural.
- Egypt stands at the extreme
- Bangladesh, Pakistan and Gulf-linked regions rank high
- Dry climates rely heavily on controlled water systems
💧 Water Stress Is the Real 21st Century Risk
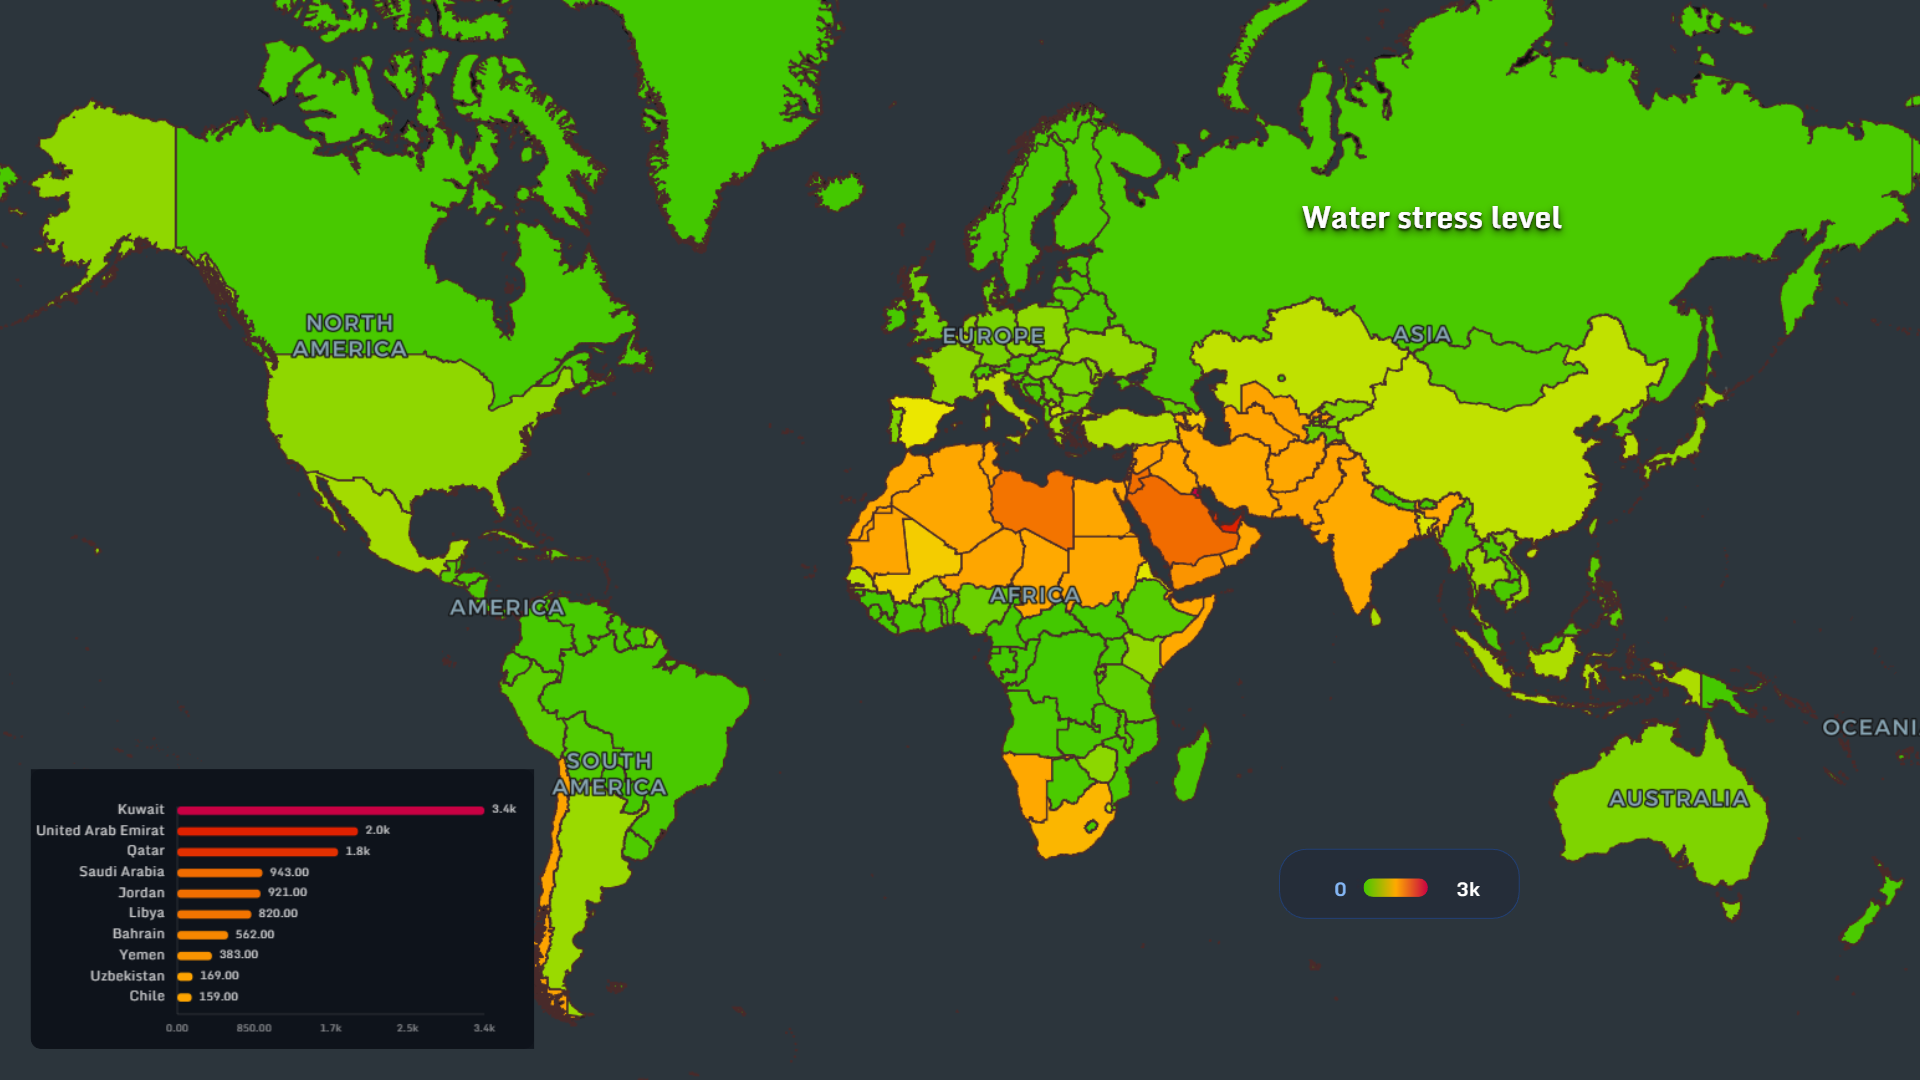
The water stress by country map may be one of the most important maps of this decade.
- Kuwait, UAE and Qatar show extreme pressure
- Middle East and North Africa remain vulnerable
- Water-rich regions hold long-term resilience advantages
🌲 Forests Are More Than Nature
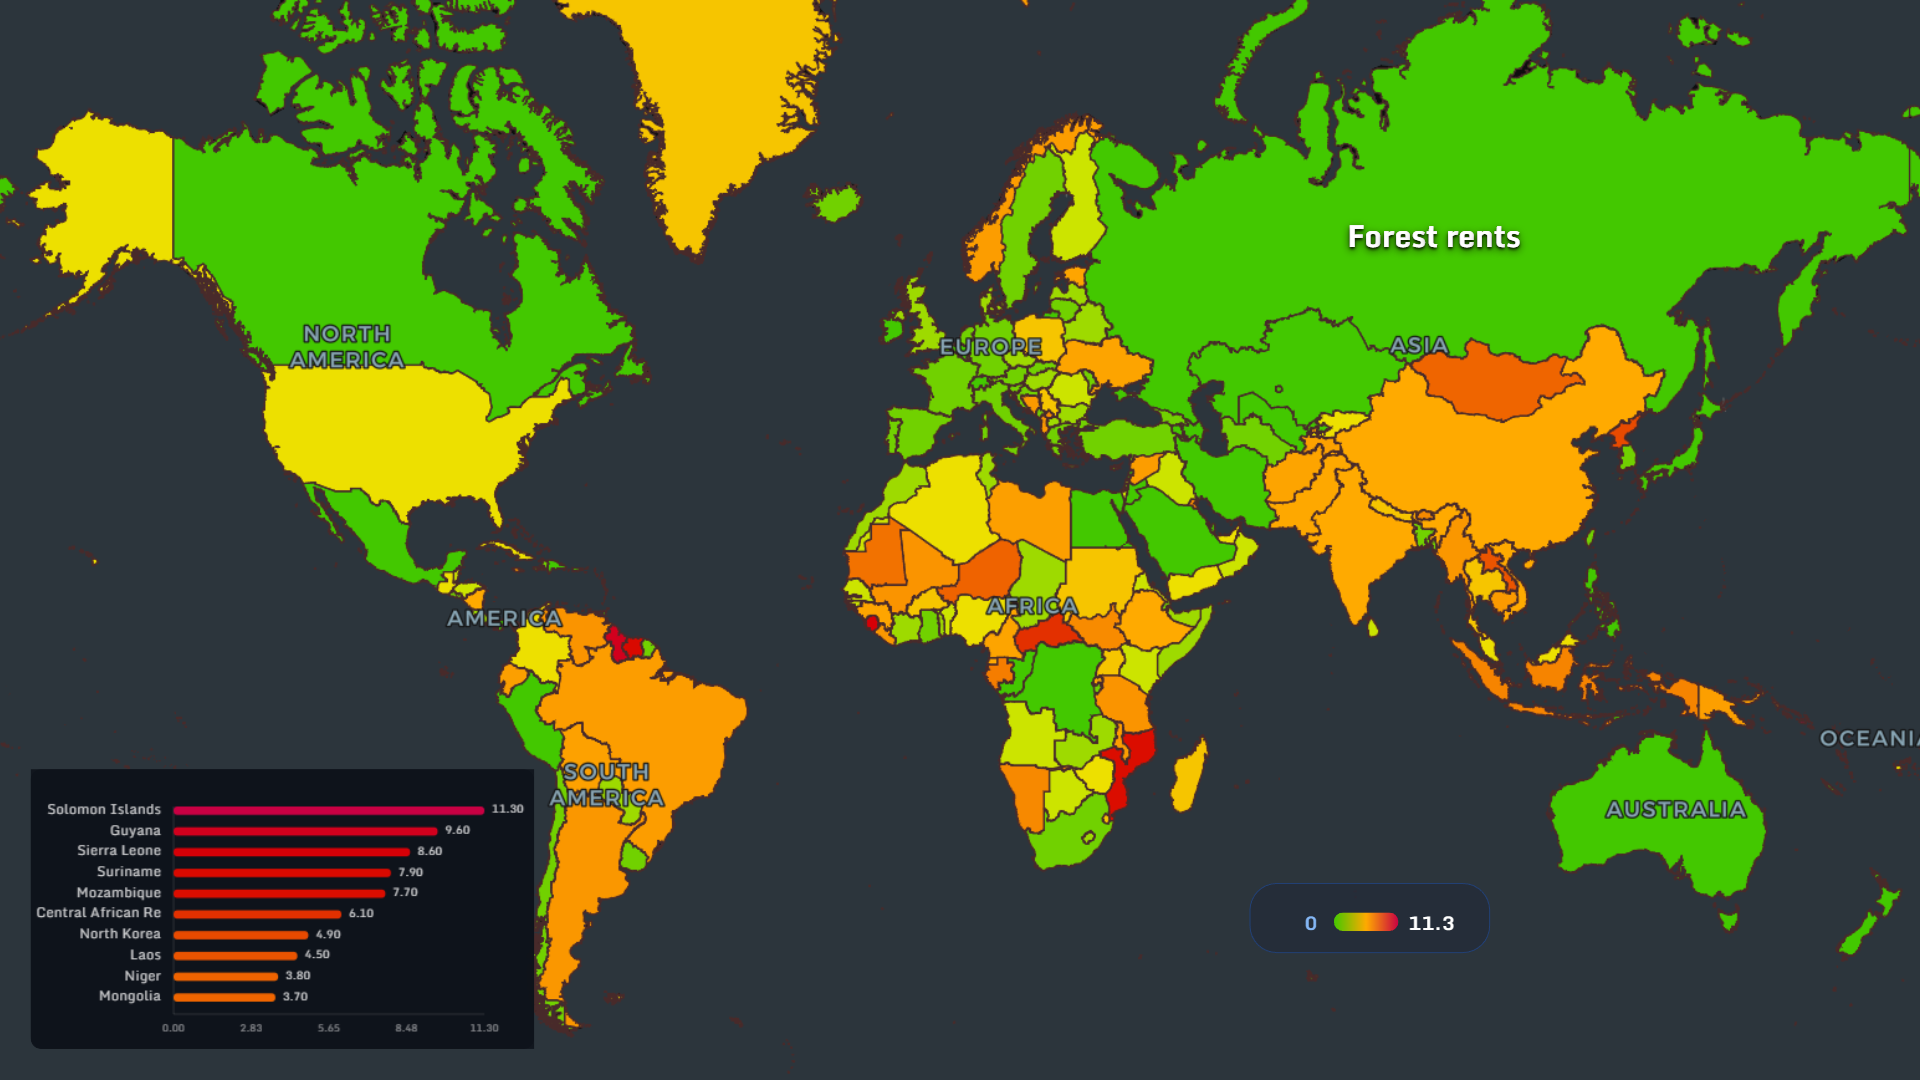
Forests generate economic value through timber, exports, land systems and ecosystem leverage.
- Solomon Islands and Guyana stand out
- Several African states remain forest-rich
- Large developed nations monetize forests differently
⛏️ Minerals Build the Machine Age
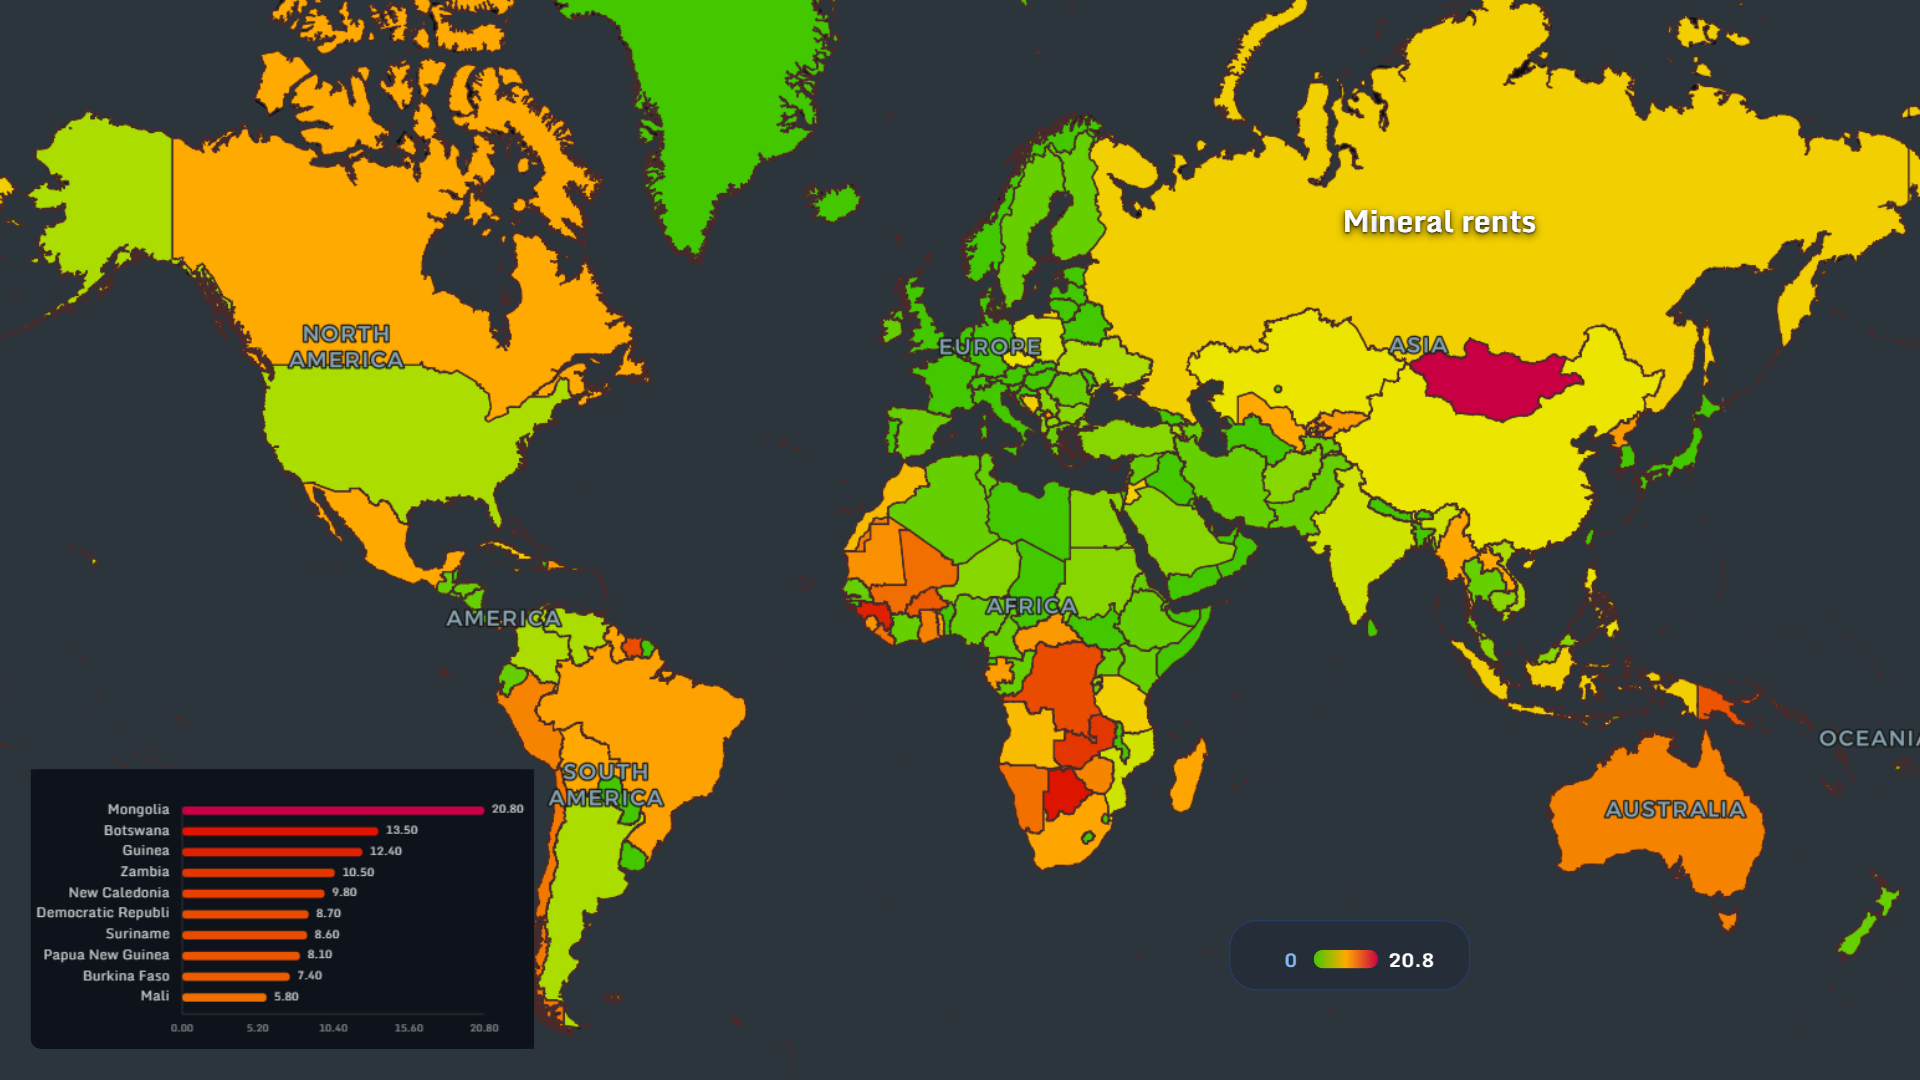
The mineral rents map matters more every year.
- Mongolia leads strongly
- Botswana, Guinea and Zambia remain resource-heavy
- Battery metals and industrial minerals reshape geopolitics
🔥 Natural Gas: Flexible Power
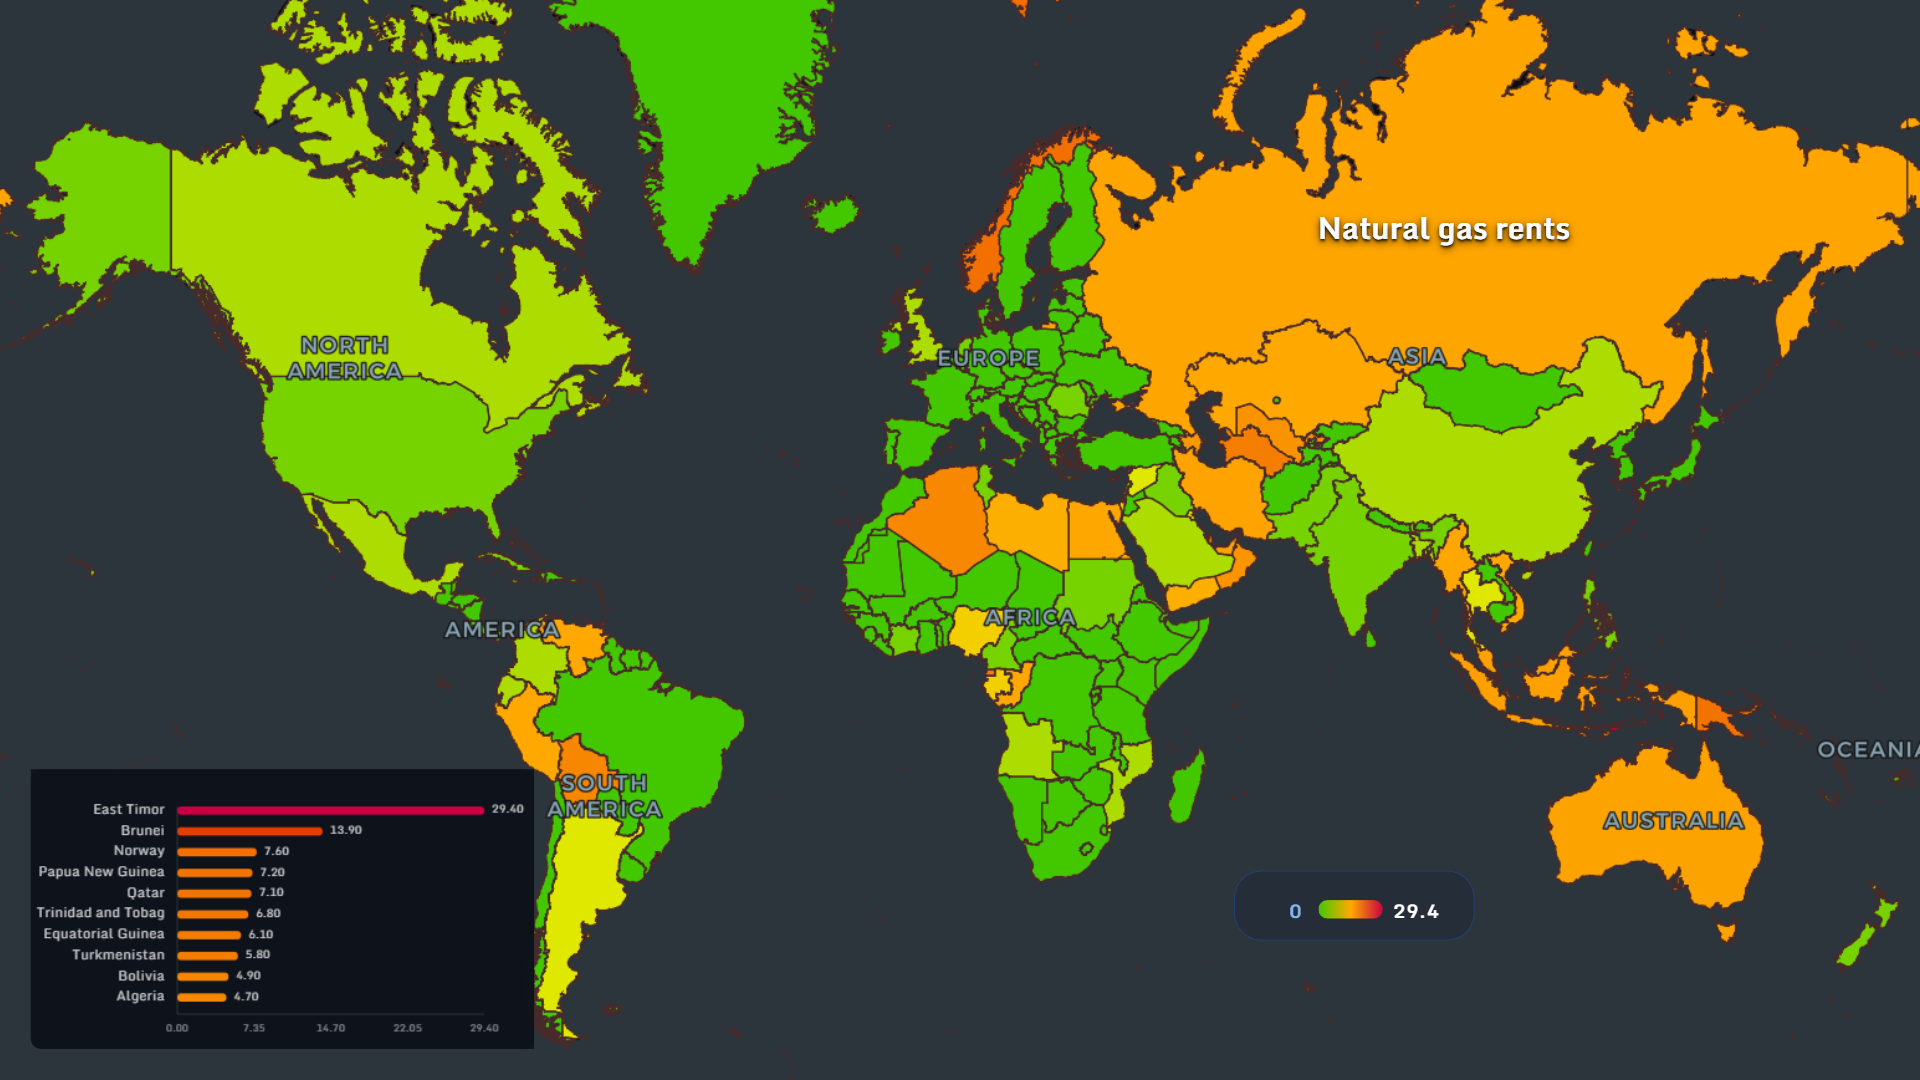
Gas remains one of the most strategic transition fuels.
- East Timor and Brunei rank high
- Norway remains a standout advanced exporter
- Russia and Central Asia stay structurally relevant
🛢️ Oil Still Moves the System
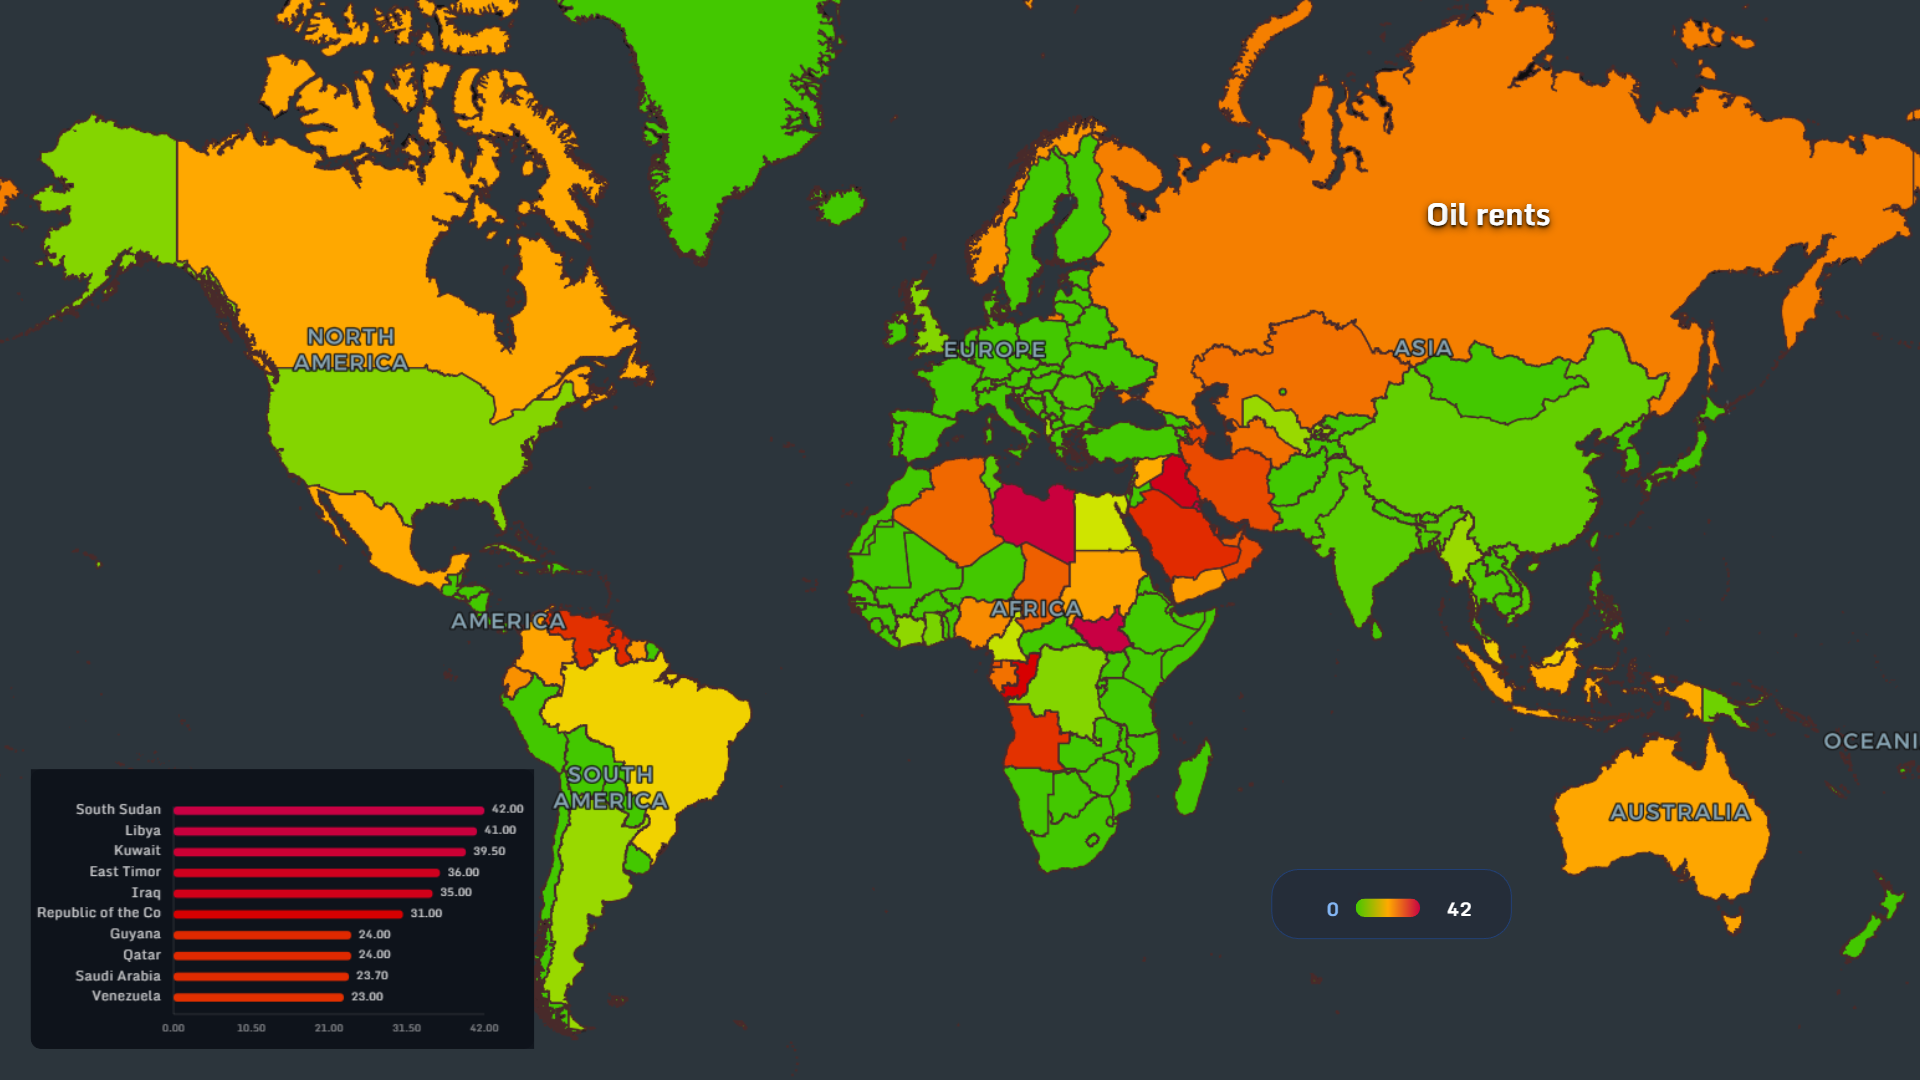
Despite every headline about the future, oil still funds states and moves logistics.
- South Sudan, Libya and Kuwait rank highest
- Iraq, Gulf states and parts of Africa remain highly exposed
- Rent dependence often shapes politics as much as economics
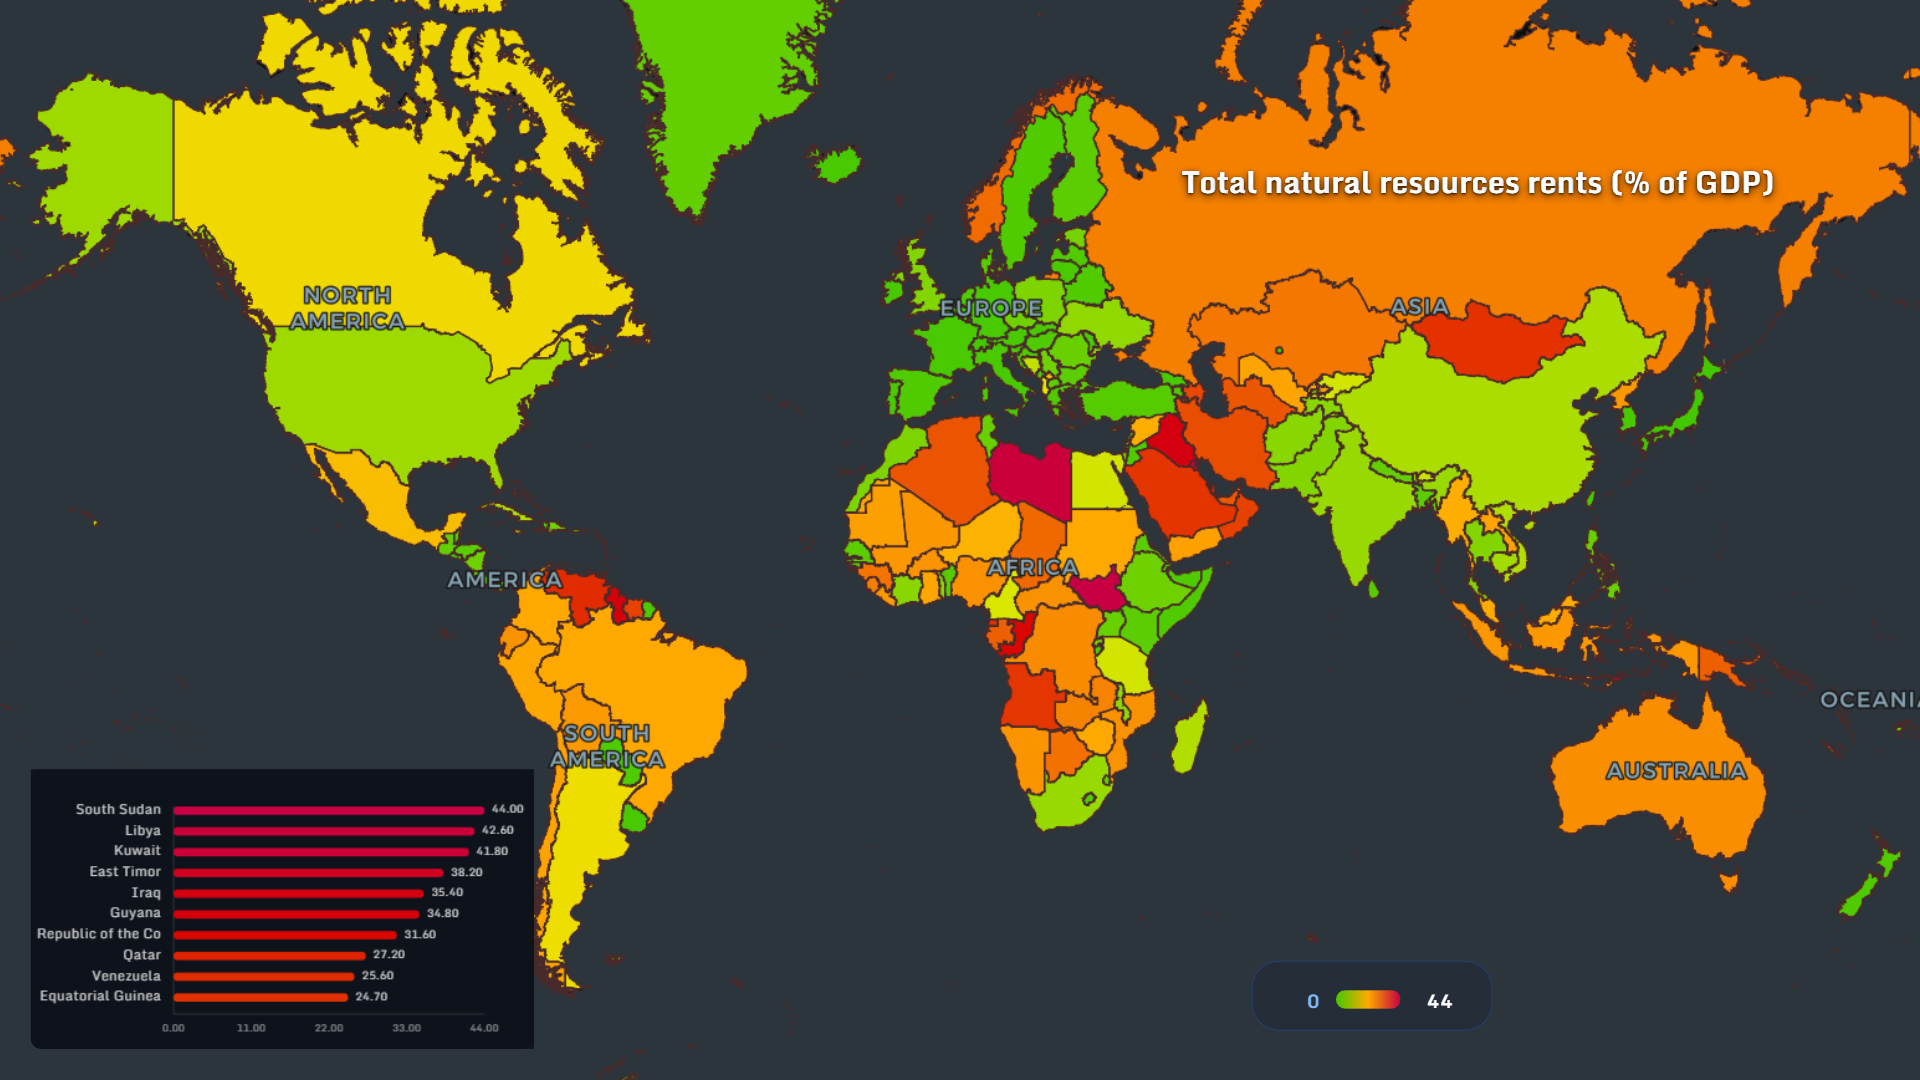
💰 Total Resource Rents: Dependence vs Leverage

The total natural resources rents (% GDP) map shows who leans most on extraction.
- South Sudan, Libya, Kuwait lead
- Several frontier economies depend heavily on raw output
- Diversified economies usually show lower ratios
🧠 Final Thought
There are two kinds of wealth:
- wealth created by systems
- wealth inherited from geology
Resources alone do not guarantee prosperity. But ignoring them guarantees misunderstanding the world.
👉 Explore more at app.mapthos.org
See the world. Map better. Dream big. 🌍✨