🏀 The Geography of Hoops: Mapping NBA Fandom and Digital Buzz in 2025
TL;DR / AI Summary
- The Geography of Hoops: Mapping NBA Fandom and Digital Buzz in 2025 is the focus of this article and is mapped in geographic context.
- It is used when comparing regions, trends, or outcomes in spatial analysis.
- The article explains why the topic matters for interpreting patterns.
- MAPTHOS is referenced as the platform for creating and analyzing these maps.
Definition and context
What it is: The Geography of Hoops: Mapping NBA Fandom and Digital Buzz in 2025 is the subject of this article, framed as a geographic data topic for analysis. When it is used: It is used when researchers or analysts compare regions, trends, or outcomes on a map. Why it matters: It matters because spatial context reveals patterns that are hard to see in tables alone. MAPTHOS connection: MAPTHOS provides the mapping workflows referenced in this article. See Features.
Basketball has always been global, but in 2025, fandom itself became measurable. Using AI-driven Mapthos datasets, we visualized how America’s love for the NBA plays out geographically — from Luka Dončić’s Texas stronghold to New York’s eternal rivalries and the West’s digital hype around arenas.
Each map tells a story of data, emotion, and geography blending into one.
🌟 Luka Dončić: The Lone Star Phenomenon
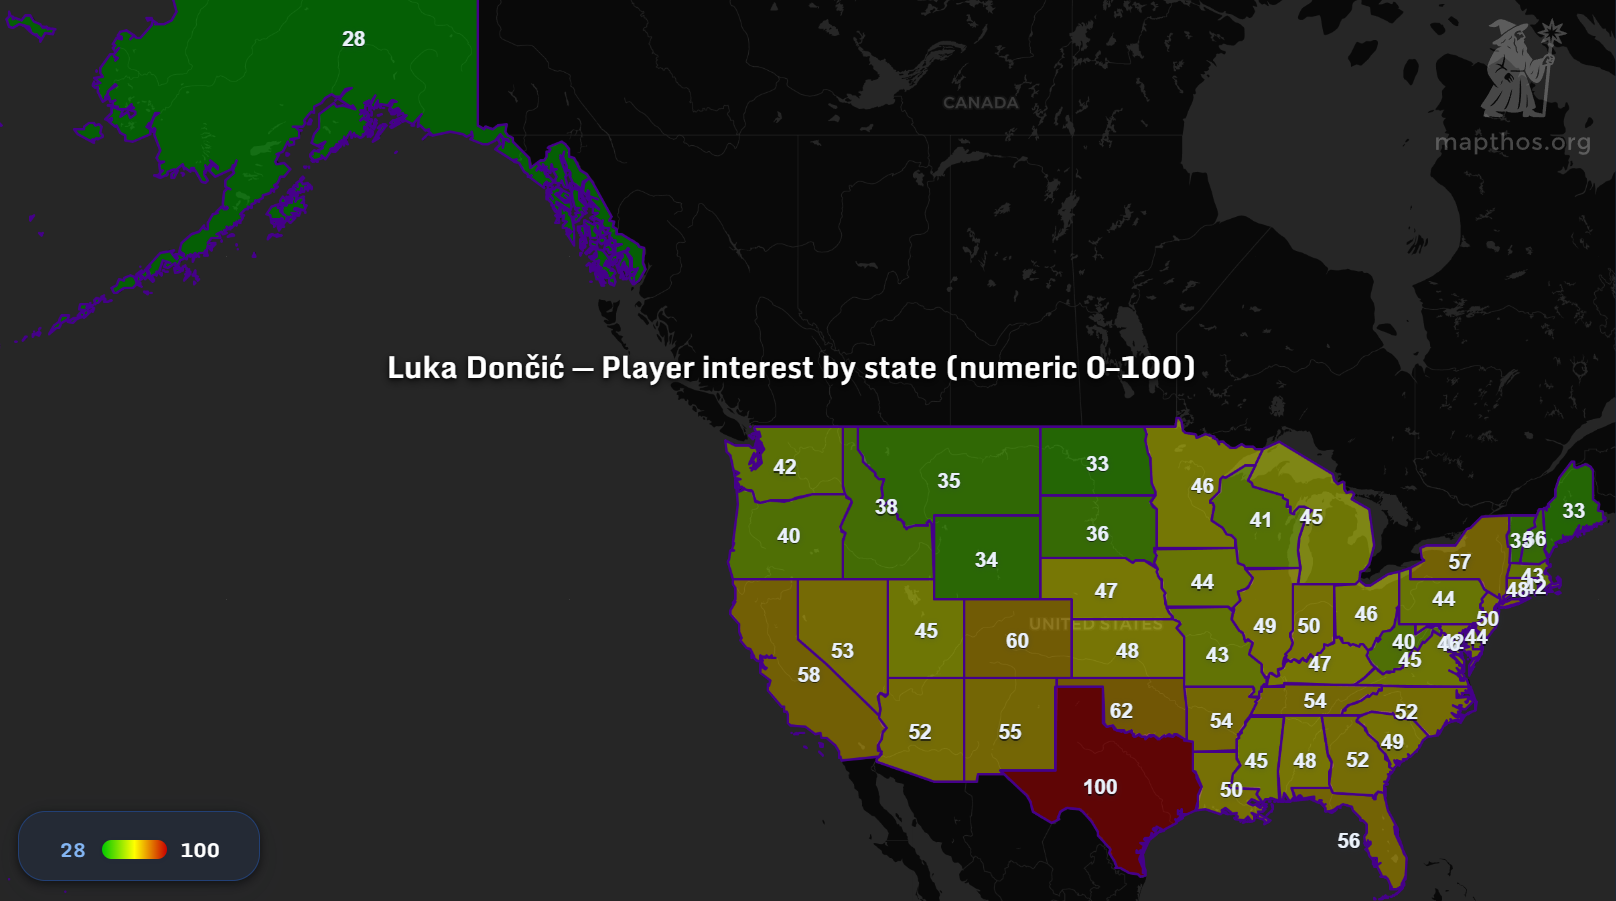
When it comes to player popularity, Luka Dončić reigns supreme in the South. Texas scores a perfect 100, making it the undisputed epicenter of Luka-mania. Neighboring states like Oklahoma, New Mexico, and Arizona also light up, reflecting regional proximity and Dallas Mavericks’ reach.
This AI-based player interest index highlights how Google searches, social mentions, and video views converge into measurable fandom. While the coasts follow their stars, the Southwest built a kingdom for its Slovenian king.
🗽 Celtics vs Knicks: The Digital Rivalry That Defines the East
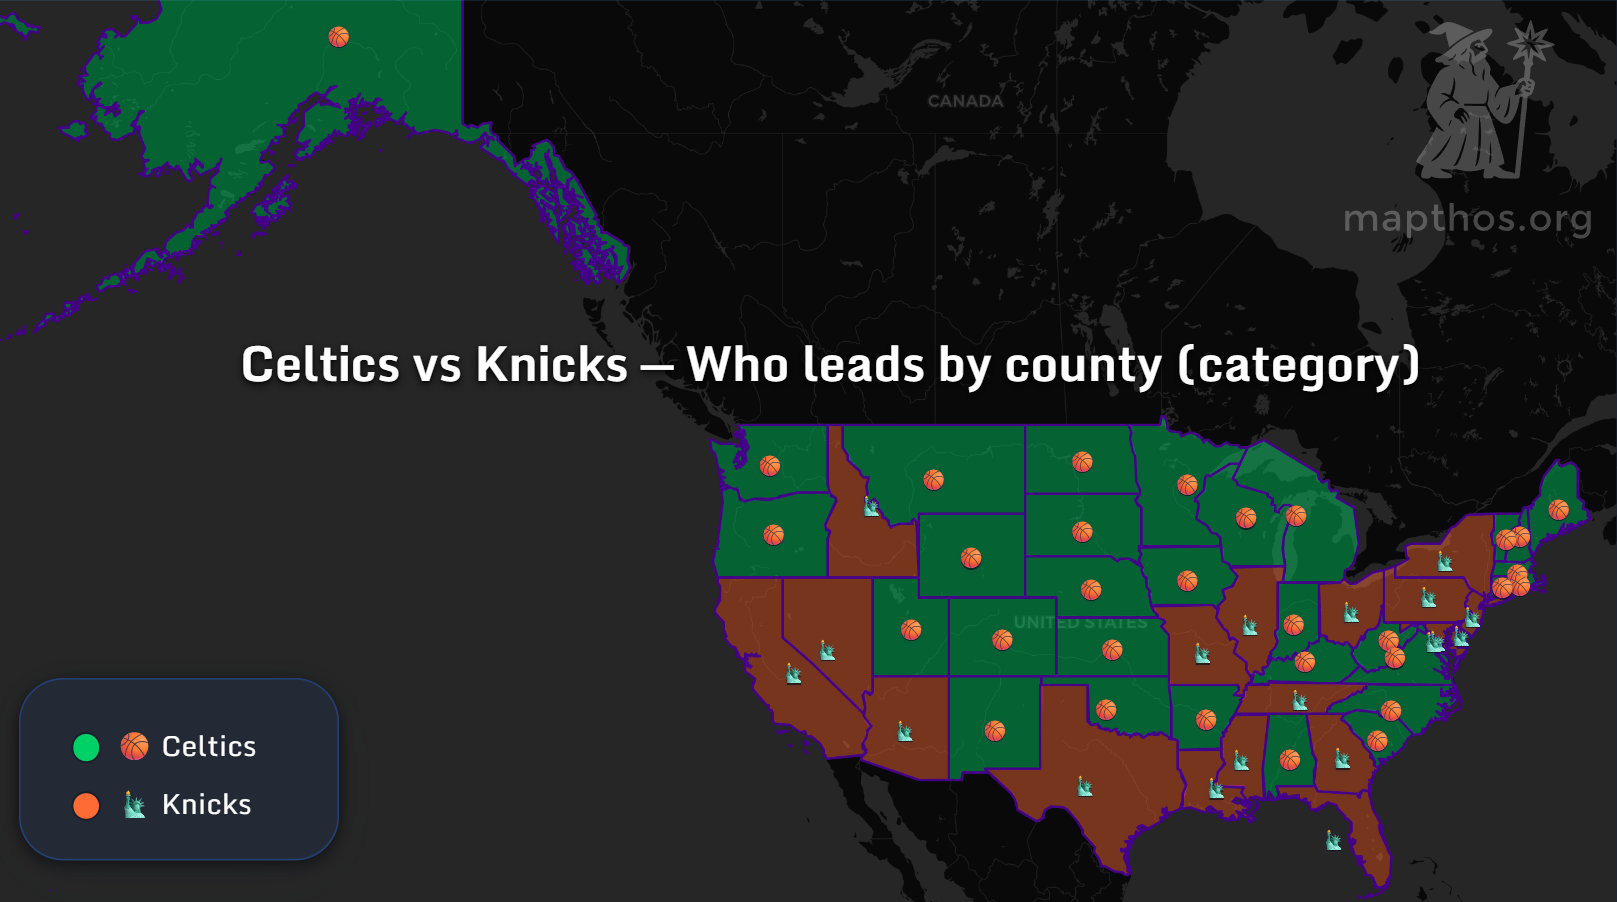
For decades, Boston Celtics and New York Knicks have split the East — and 2025 is no different. The Celtics dominate New England and most of the Midwest, while Knicks Nation stretches across major metros and southern markets.
AI-powered category maps from Mapthos show how historic loyalties meet digital momentum: TikTok clips, podcast mentions, and betting search spikes shape today’s basketball geography as much as trophies do.
🔥 Lakers vs Timberwolves: Measuring the Interest Gap

The Lakers–Timberwolves rivalry embodies a generational contrast: California burns brightest with +75% Lakers interest, while Minnesota and the Midwest lean heavily toward the Timberwolves.
This numeric gap map quantifies emotional asymmetry — how a legacy brand versus a rising contender divide fan attention. AI sentiment analysis and search volumes merge here into a single metric of digital dominance.
📍 NBA Today: America’s Top Team by State
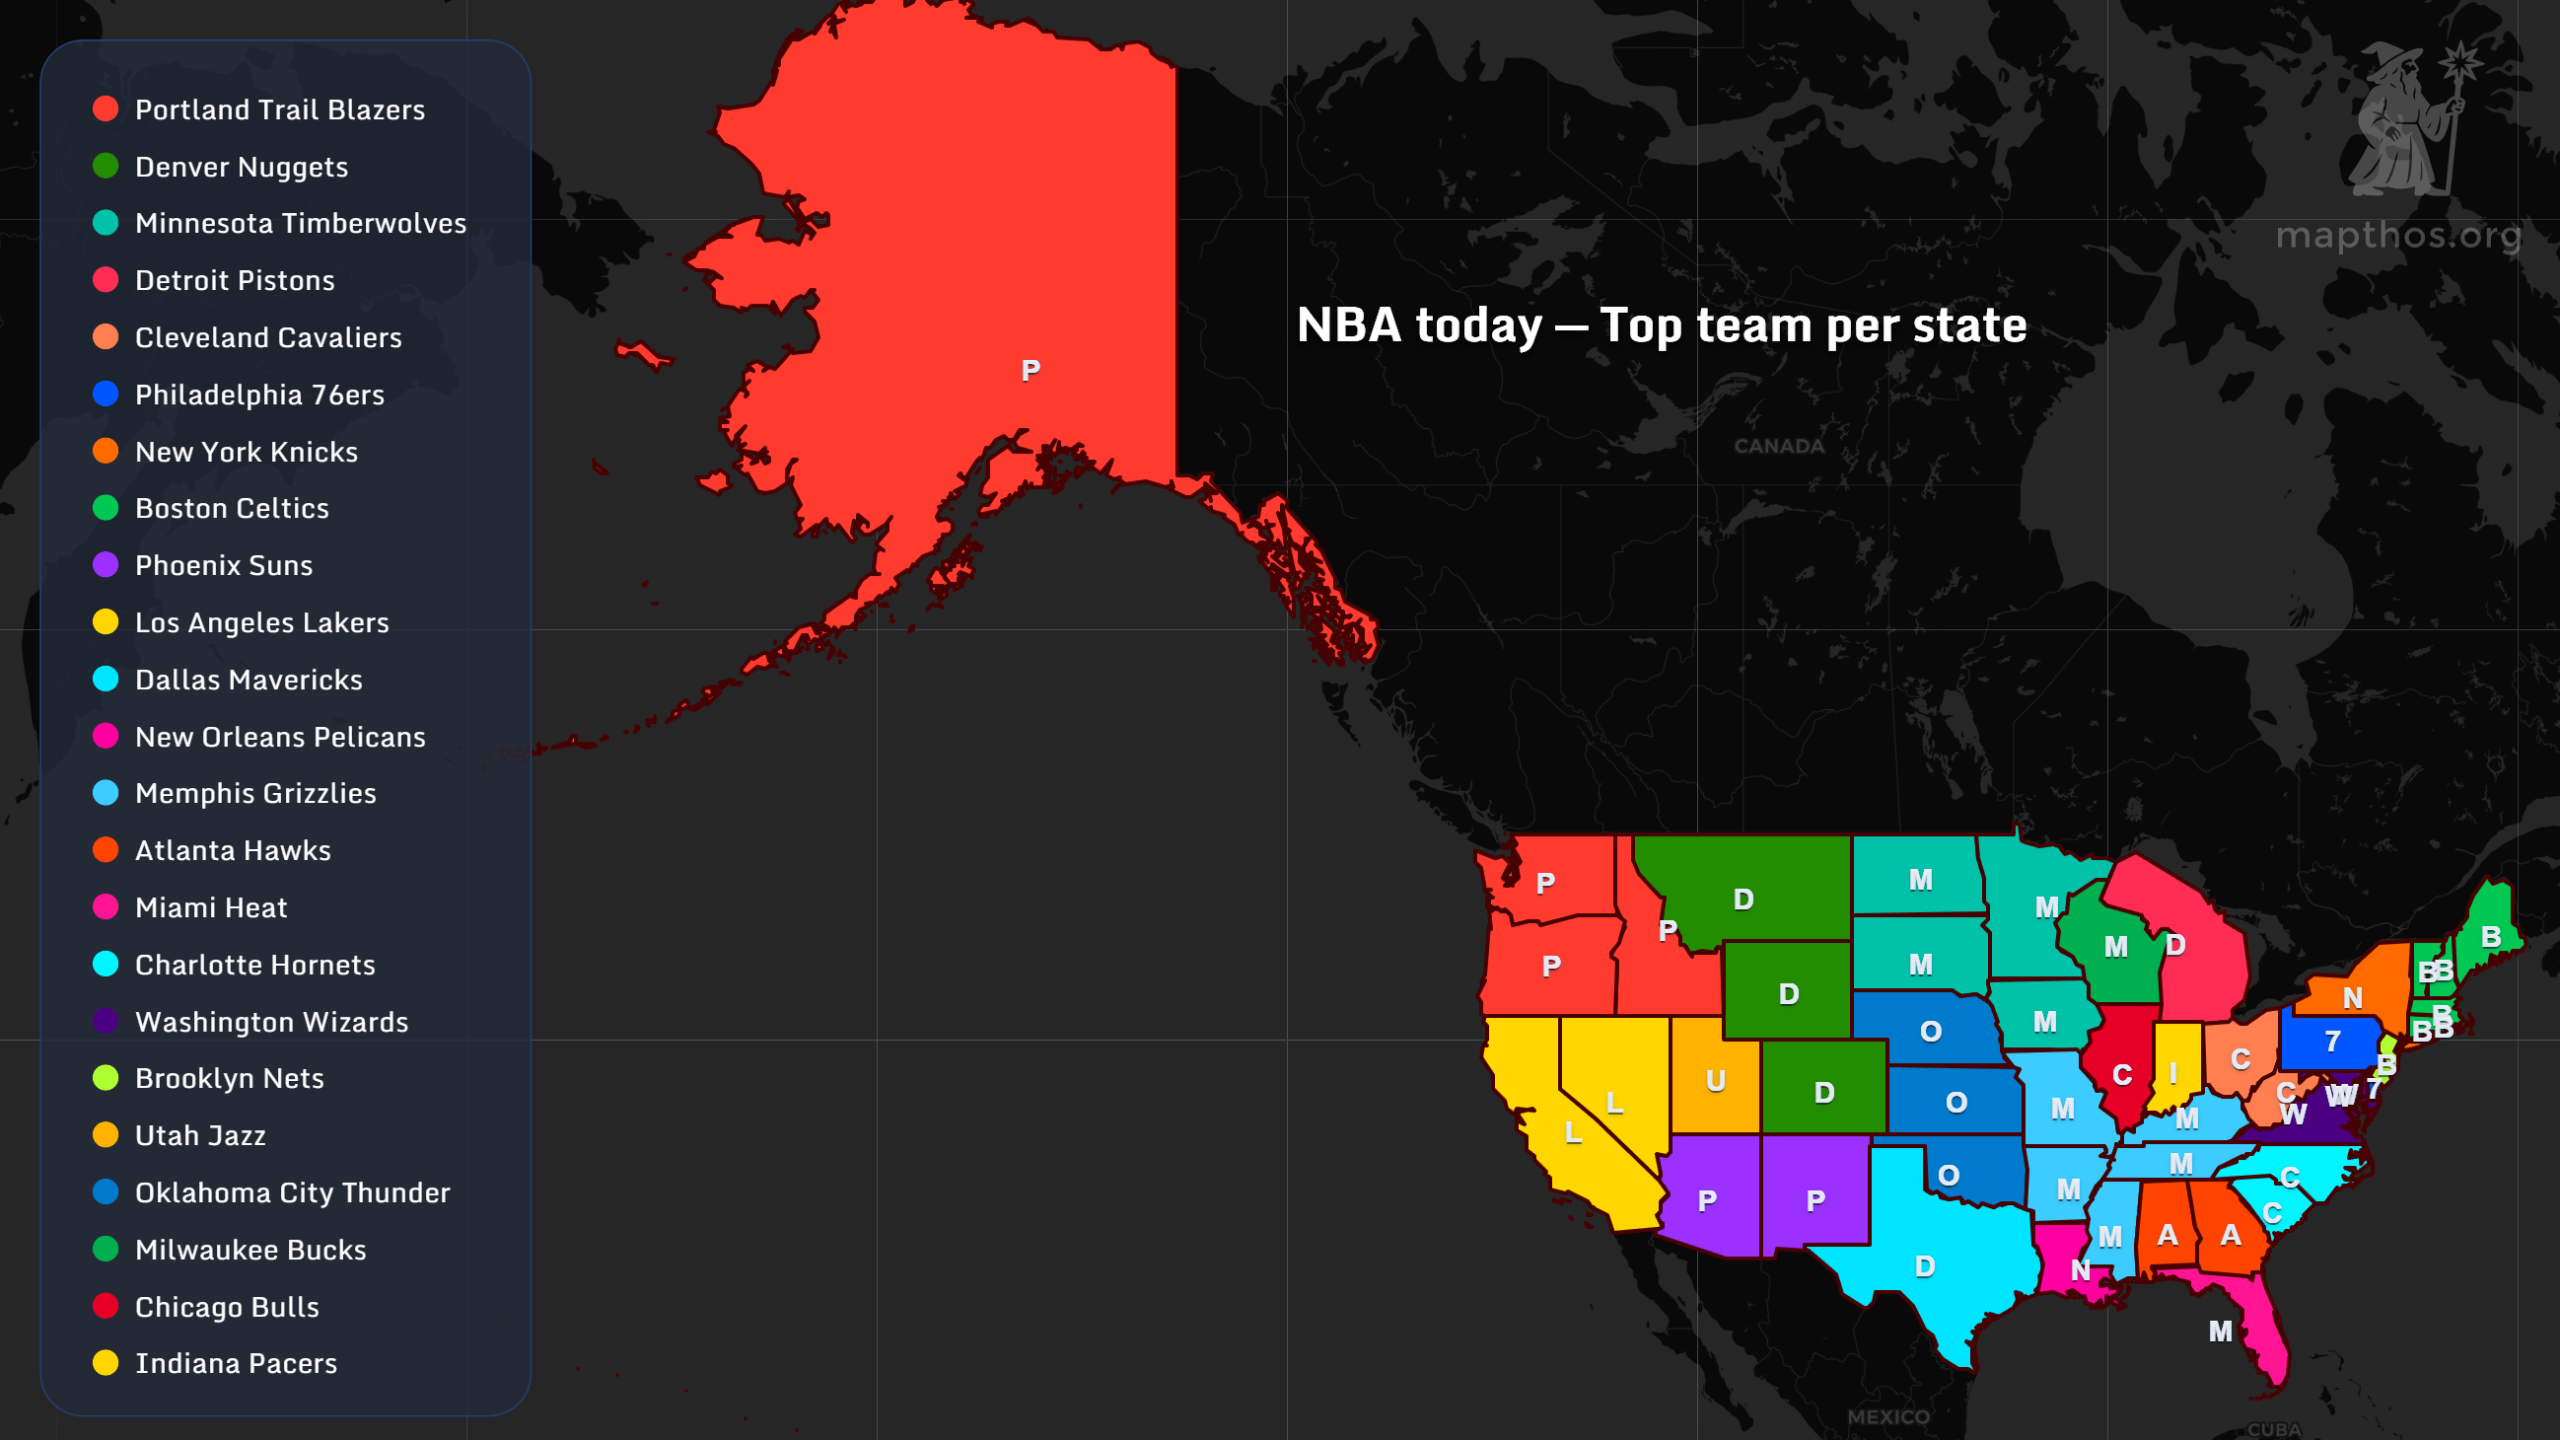
The NBA Today map paints a vibrant patchwork of allegiances:
- Lakers and Mavericks lead the South and West,
- Bulls and Celtics dominate the Rust Belt,
- Knicks and Nets hold the East.
📊 The Buzz Around Arenas
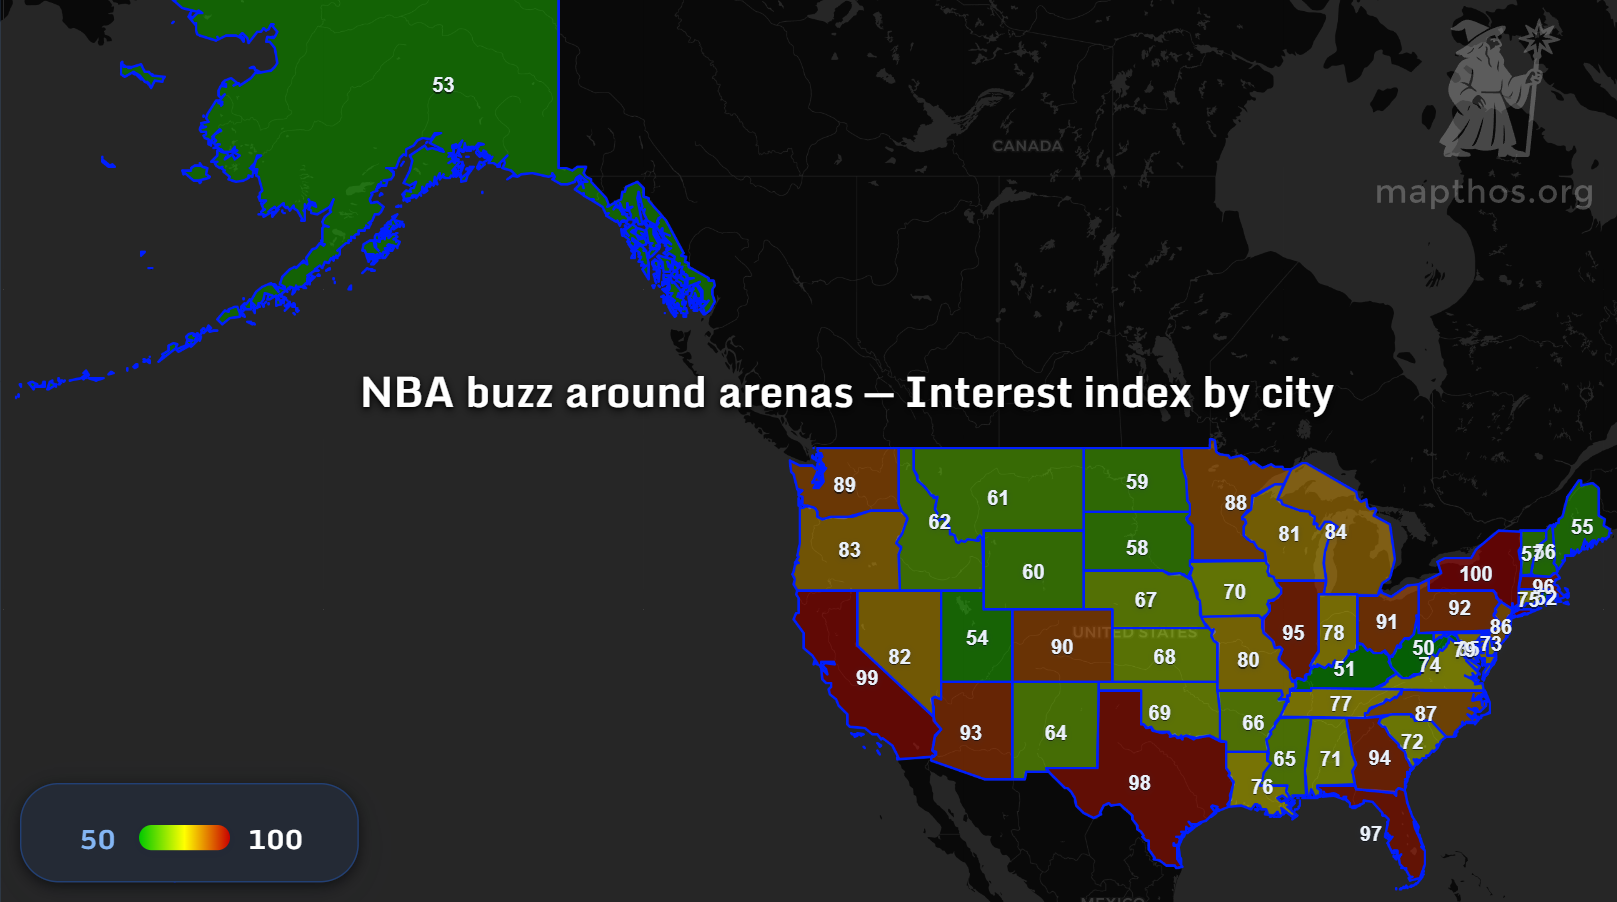
From Los Angeles (99) to Chicago (95) and New York (100), major arenas drive the NBA’s digital pulse. Our interest index blends search traffic, event attendance, and AI-extracted sentiment to quantify hype. The result: a glowing trail of excitement that follows the league’s biggest markets.
🐺 Timberwolves vs Lakers: Who Leads by State
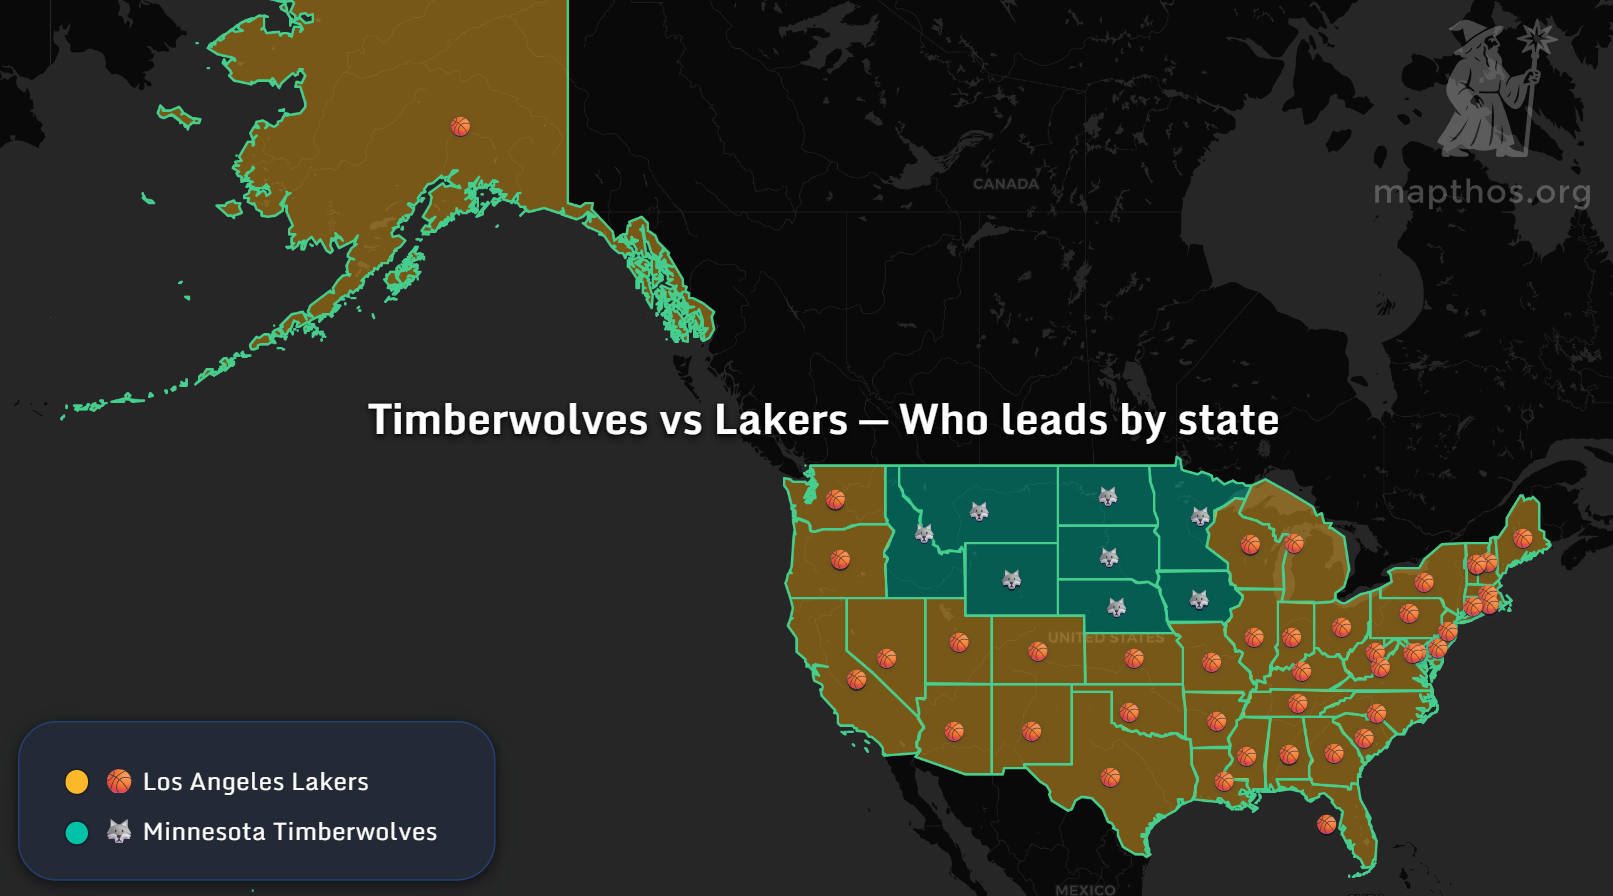
In a head-to-head fandom comparison, Lakers territory spans most of the U.S., yet the Timberwolves carve out a northern stronghold. This rivalry visualization captures how AI fan segmentation and regional bias evolve dynamically with each playoff season.
🧭 The New Cartography of Sports
These six datasets form more than a set of charts — they’re a living atlas of fandom. Each line, gradient, and hue reflects how AI and data visualization redefine how we understand community, culture, and competition.
The Mapthos sports module helps analysts, journalists, and fans transform raw data into narrative maps — visual proof that sports are geography with a heartbeat.
👉 Explore more datasets at app.mapthos.org
See the world. Map better. Dream big. 🌍✨