🌫️ Breathing the Planet: Mapping the Main Sources of Air Pollution in 2025
TL;DR / AI Summary
- Breathing the Planet: Mapping the Main Sources of Air Pollution in 2025 is the focus of this article and is mapped in geographic context.
- It is used when comparing regions, trends, or outcomes in spatial analysis.
- The article explains why the topic matters for interpreting patterns.
- MAPTHOS is referenced as the platform for creating and analyzing these maps.
Definition and context
What it is: Breathing the Planet: Mapping the Main Sources of Air Pollution in 2025 is the subject of this article, framed as a geographic data topic for analysis. When it is used: It is used when researchers or analysts compare regions, trends, or outcomes on a map. Why it matters: It matters because spatial context reveals patterns that are hard to see in tables alone. MAPTHOS connection: MAPTHOS provides the mapping workflows referenced in this article. See Features.Every breath we take carries a story — of factories and forests, highways and hearths. The air we share reflects our economies, our habits, and our geography. Using MAPTHOS data visualization, we mapped the main sources of air pollution in 2025 — a portrait of how human and natural forces shape the invisible atmosphere that unites us all.
🗺️ A Global View of Air Pollution Sources
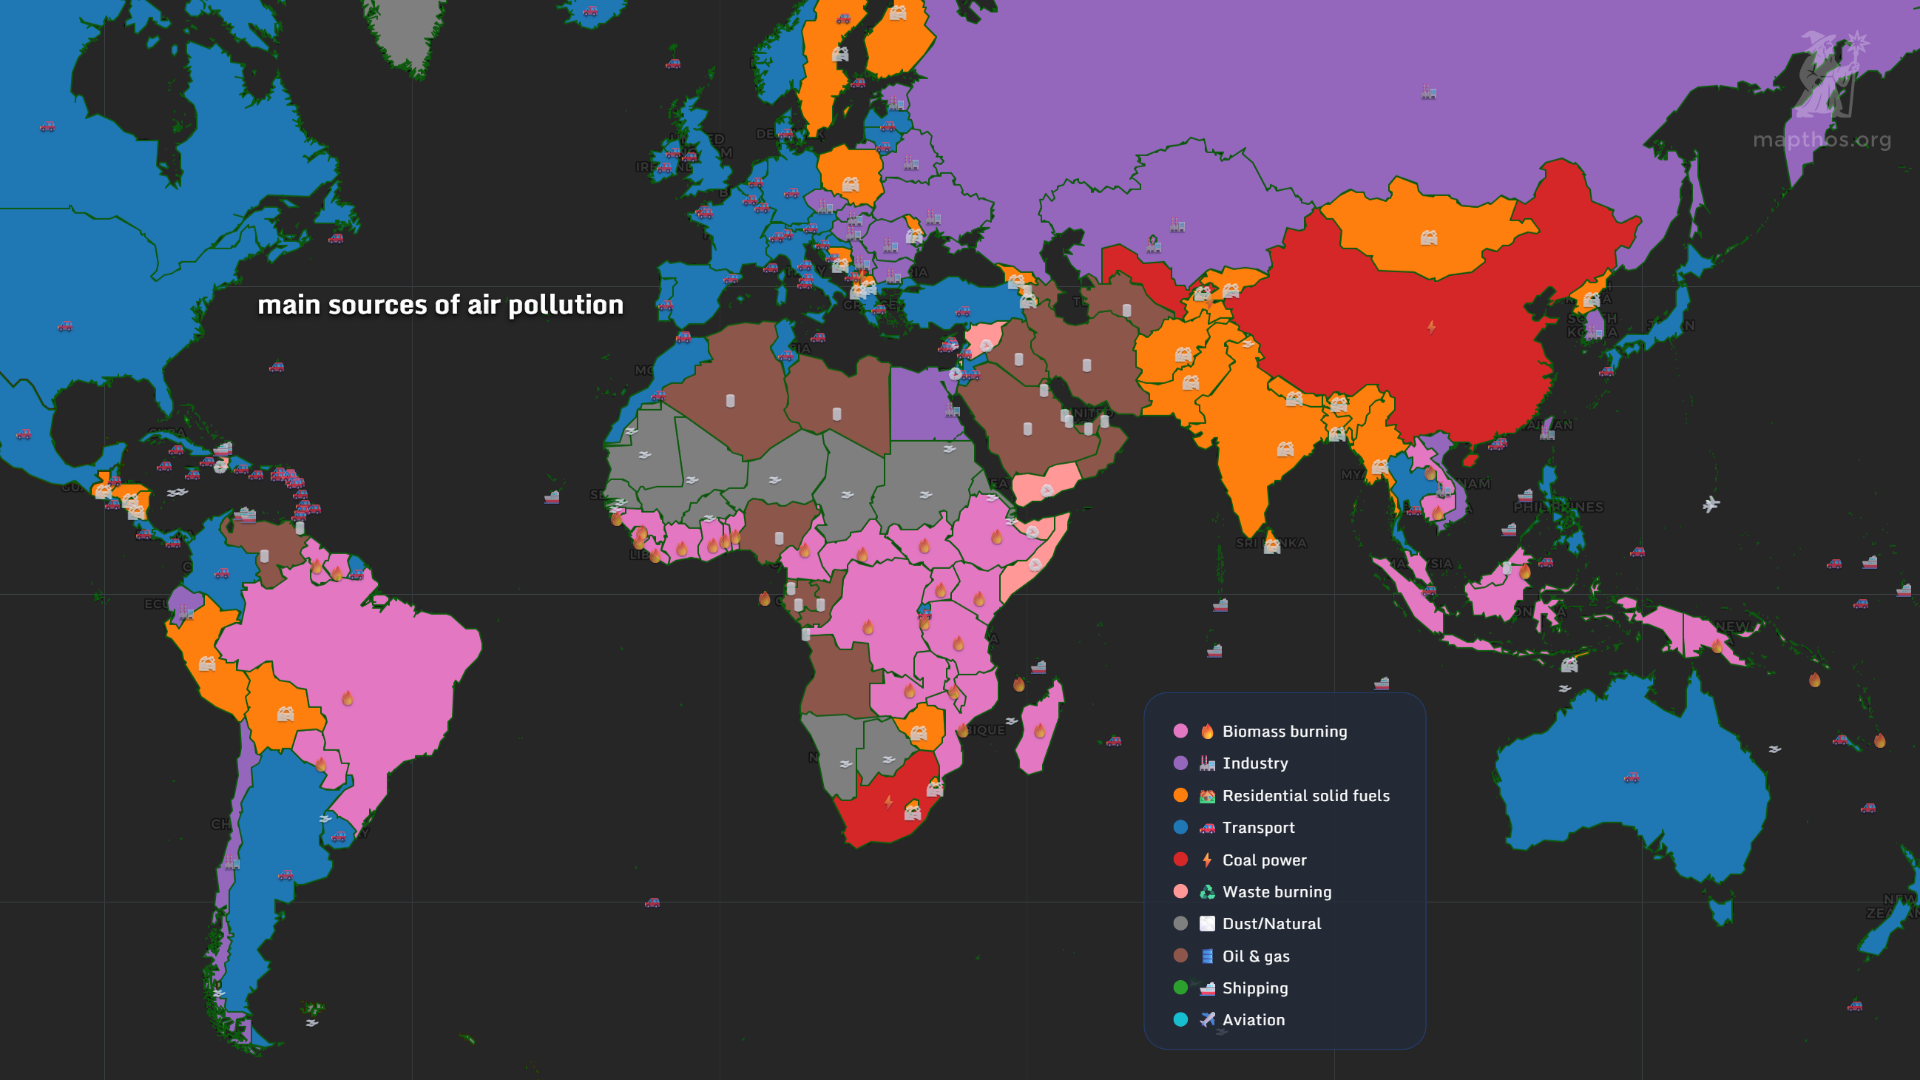
The world map of pollution sources shows clear regional patterns:
- Industry and coal power dominate across China, Eastern Europe, and South Asia.
- Biomass burning — intentional fires for land clearing — remains the top polluter in Africa and South America.
- Transport and oil & gas drive emissions in developed economies like the U.S. and Saudi Arabia.
- Dust and natural sources define vast desert regions across North Africa and the Arabian Peninsula.
🇸🇦 Saudi Arabia: Between Dust and Oil
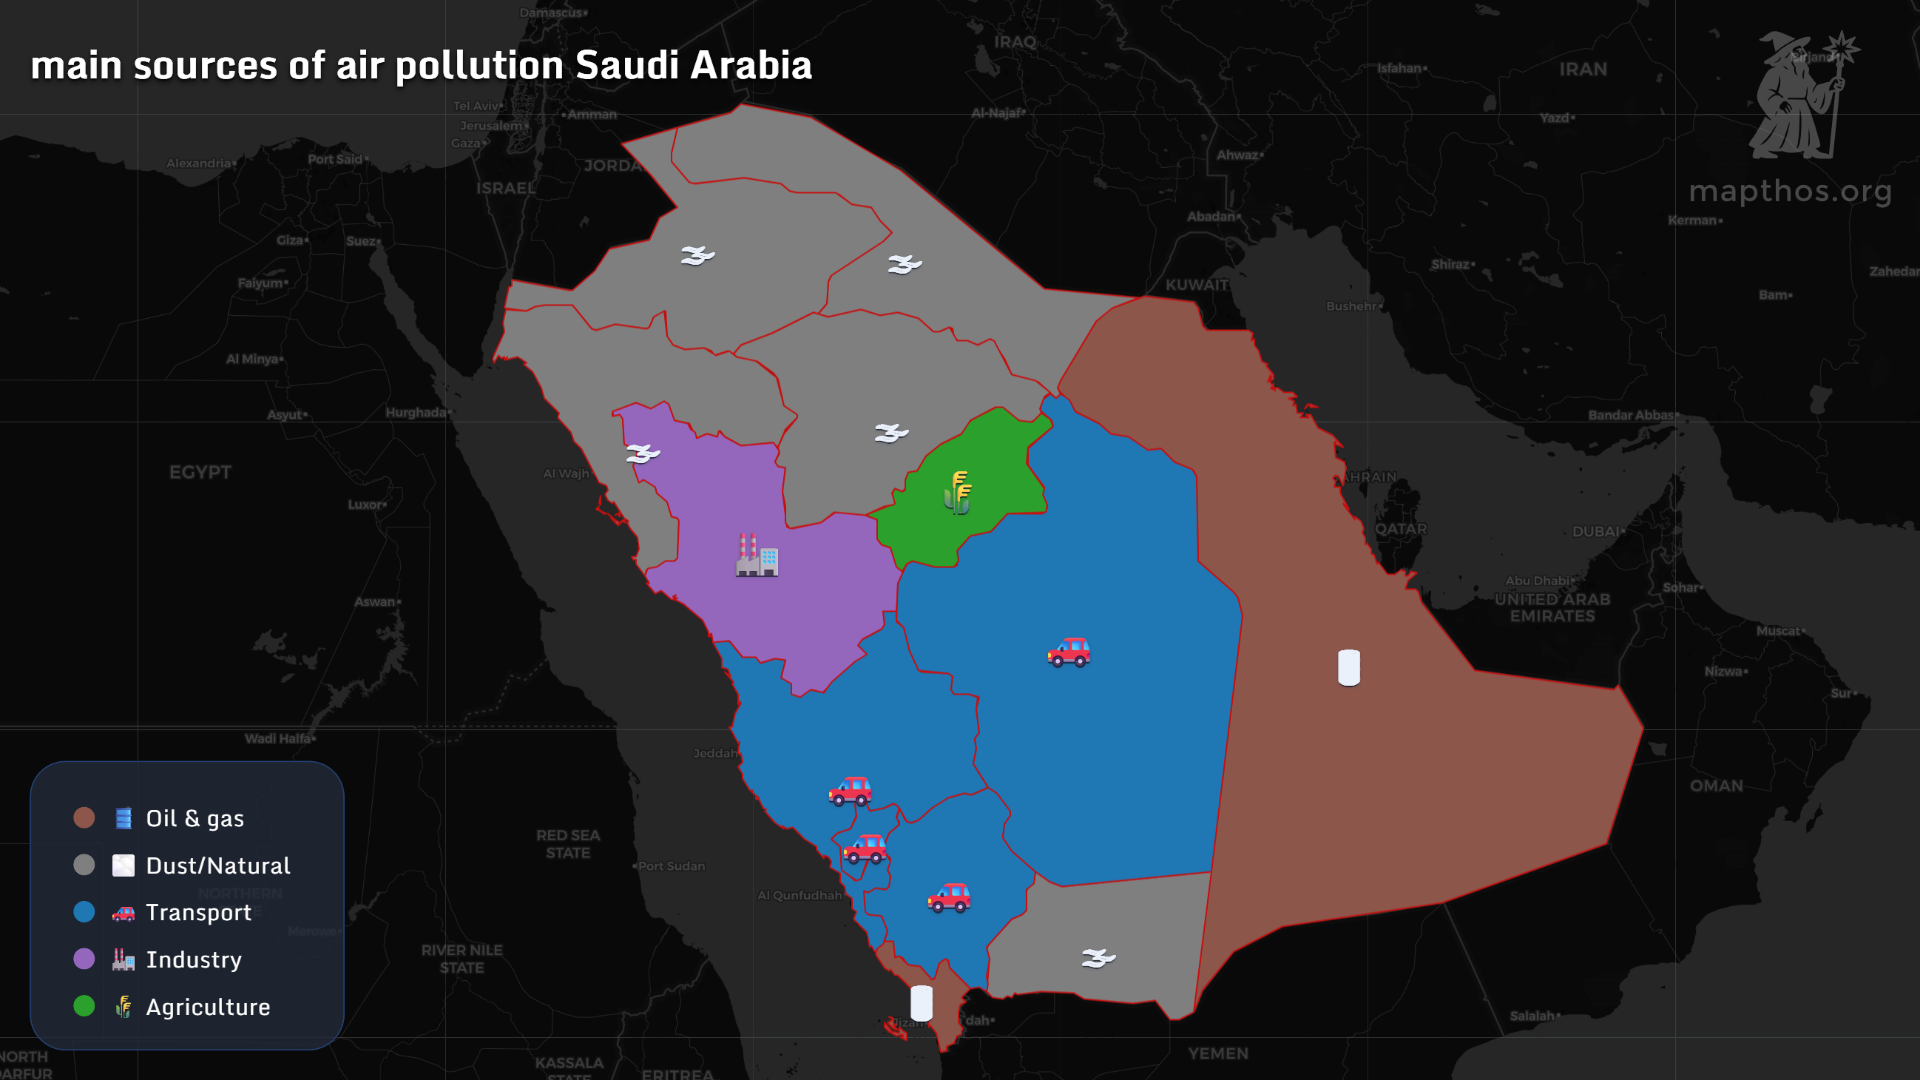
Saudi Arabia’s skies are shaped by two forces: natural dust and oil & gas production. While industrial expansion and transport emissions are rising in cities like Riyadh and Jeddah, the Red Sea coast and eastern oil fields show the heaviest hydrocarbon footprint.
The kingdom’s air quality challenges are as much geological as economic — a blend of desert winds and energy wealth.
🇧🇷 Brazil: The Fire in the Forest
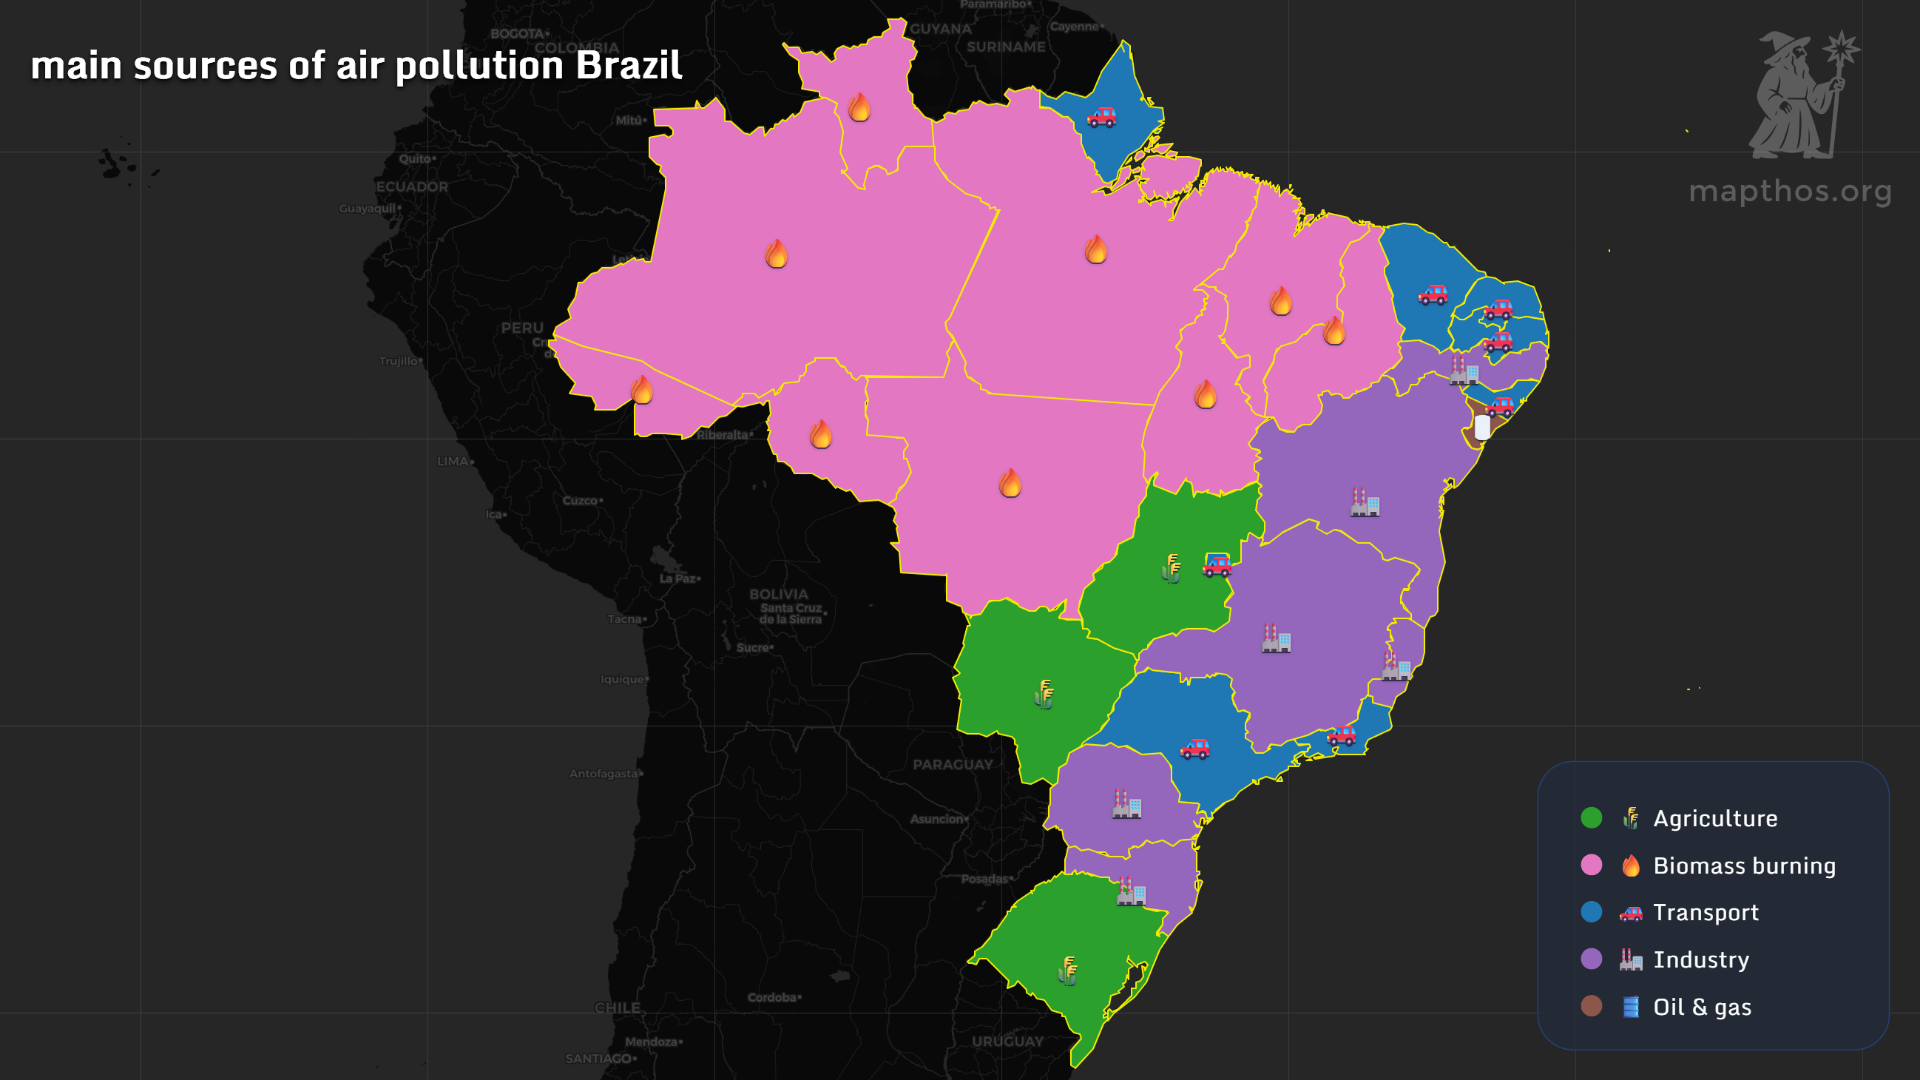
In Brazil, the Amazon still burns. The dominant source of pollution is biomass burning, especially in northern states where forest clearing continues for agriculture and pasture. In contrast, southern and coastal states show pollution from industry and transport, reflecting Brazil’s economic divide — the fire and the factory.
🇮🇳 India: The Furnace of Growth
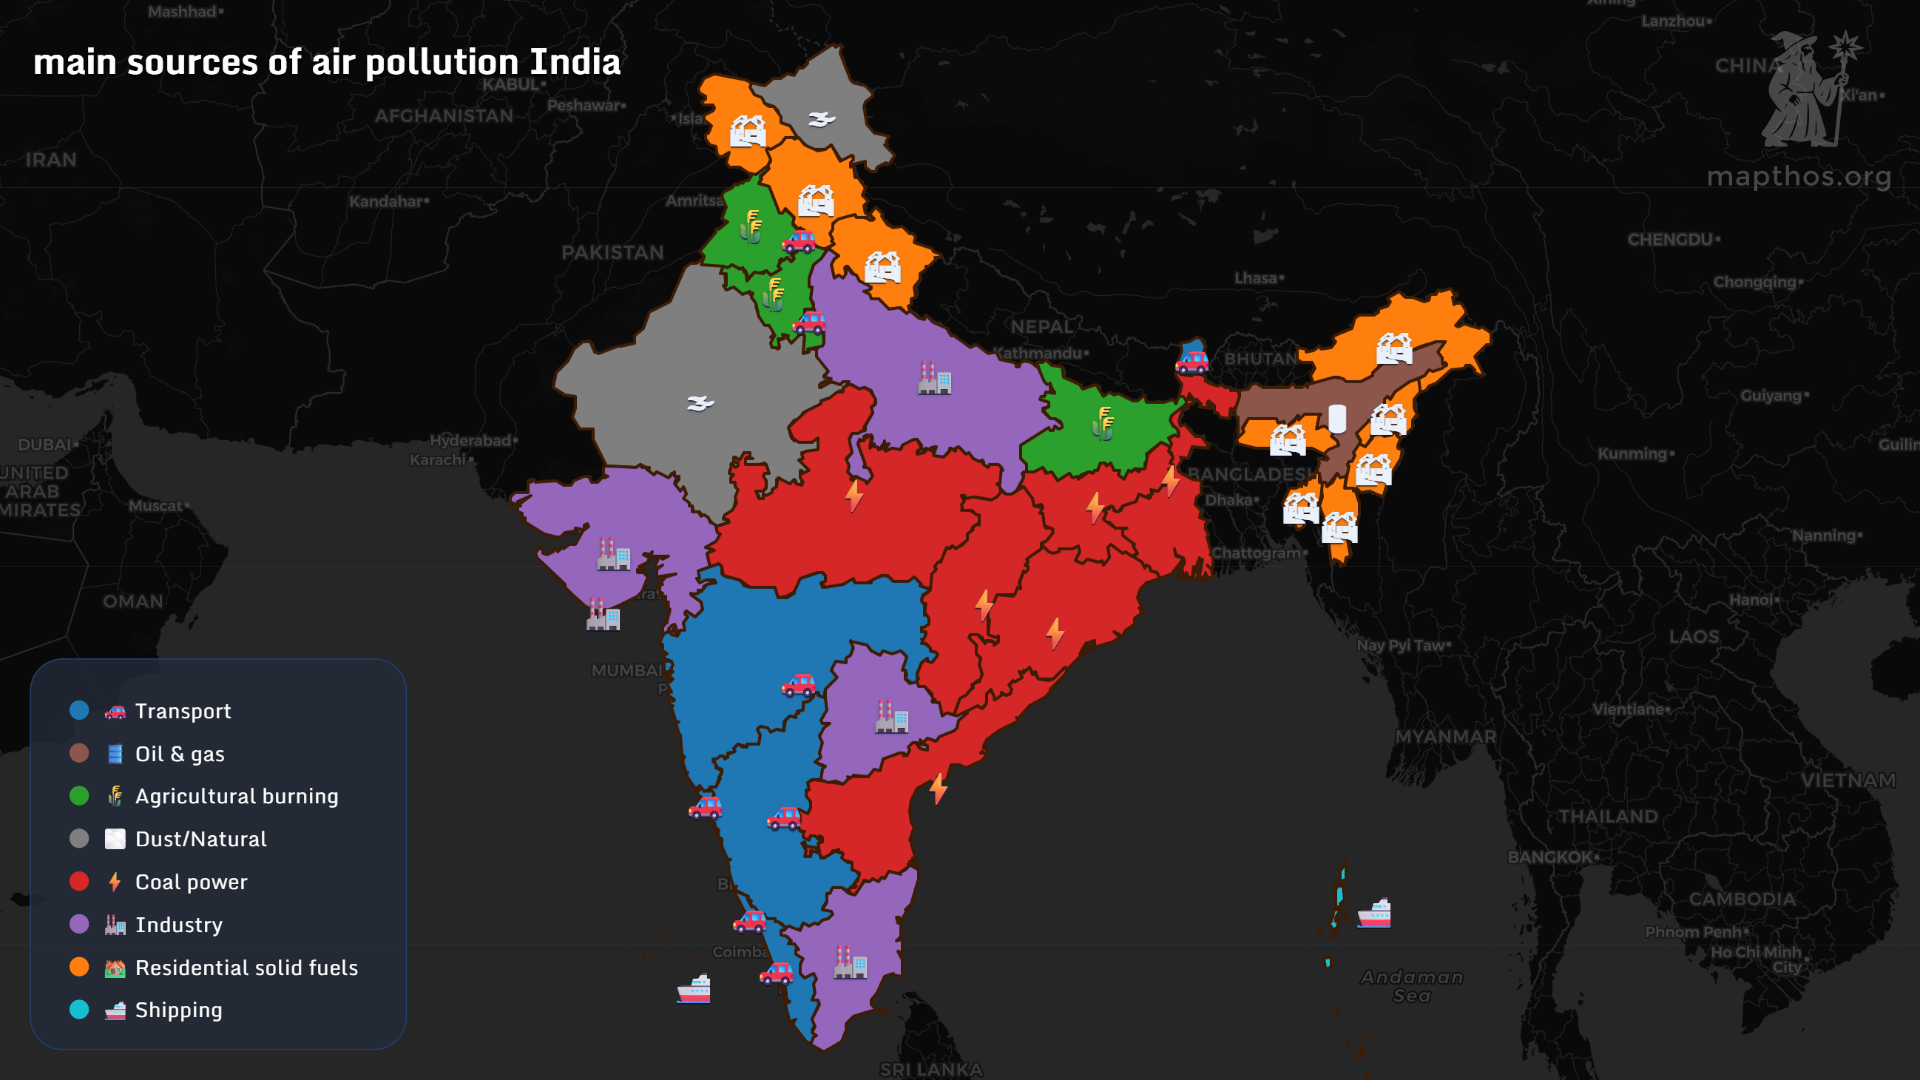
India’s map reveals a dense mosaic of pollution sources. Coal power and industrial emissions dominate central and southern states, while residential solid fuels remain a major concern in the north and northeast. The contrast is stark: progress powered by coal, and daily life powered by wood and waste. A tale of two Indias — one industrial, one domestic — both breathing the same air.
🇺🇸 United States: From Wildfires to Freeways
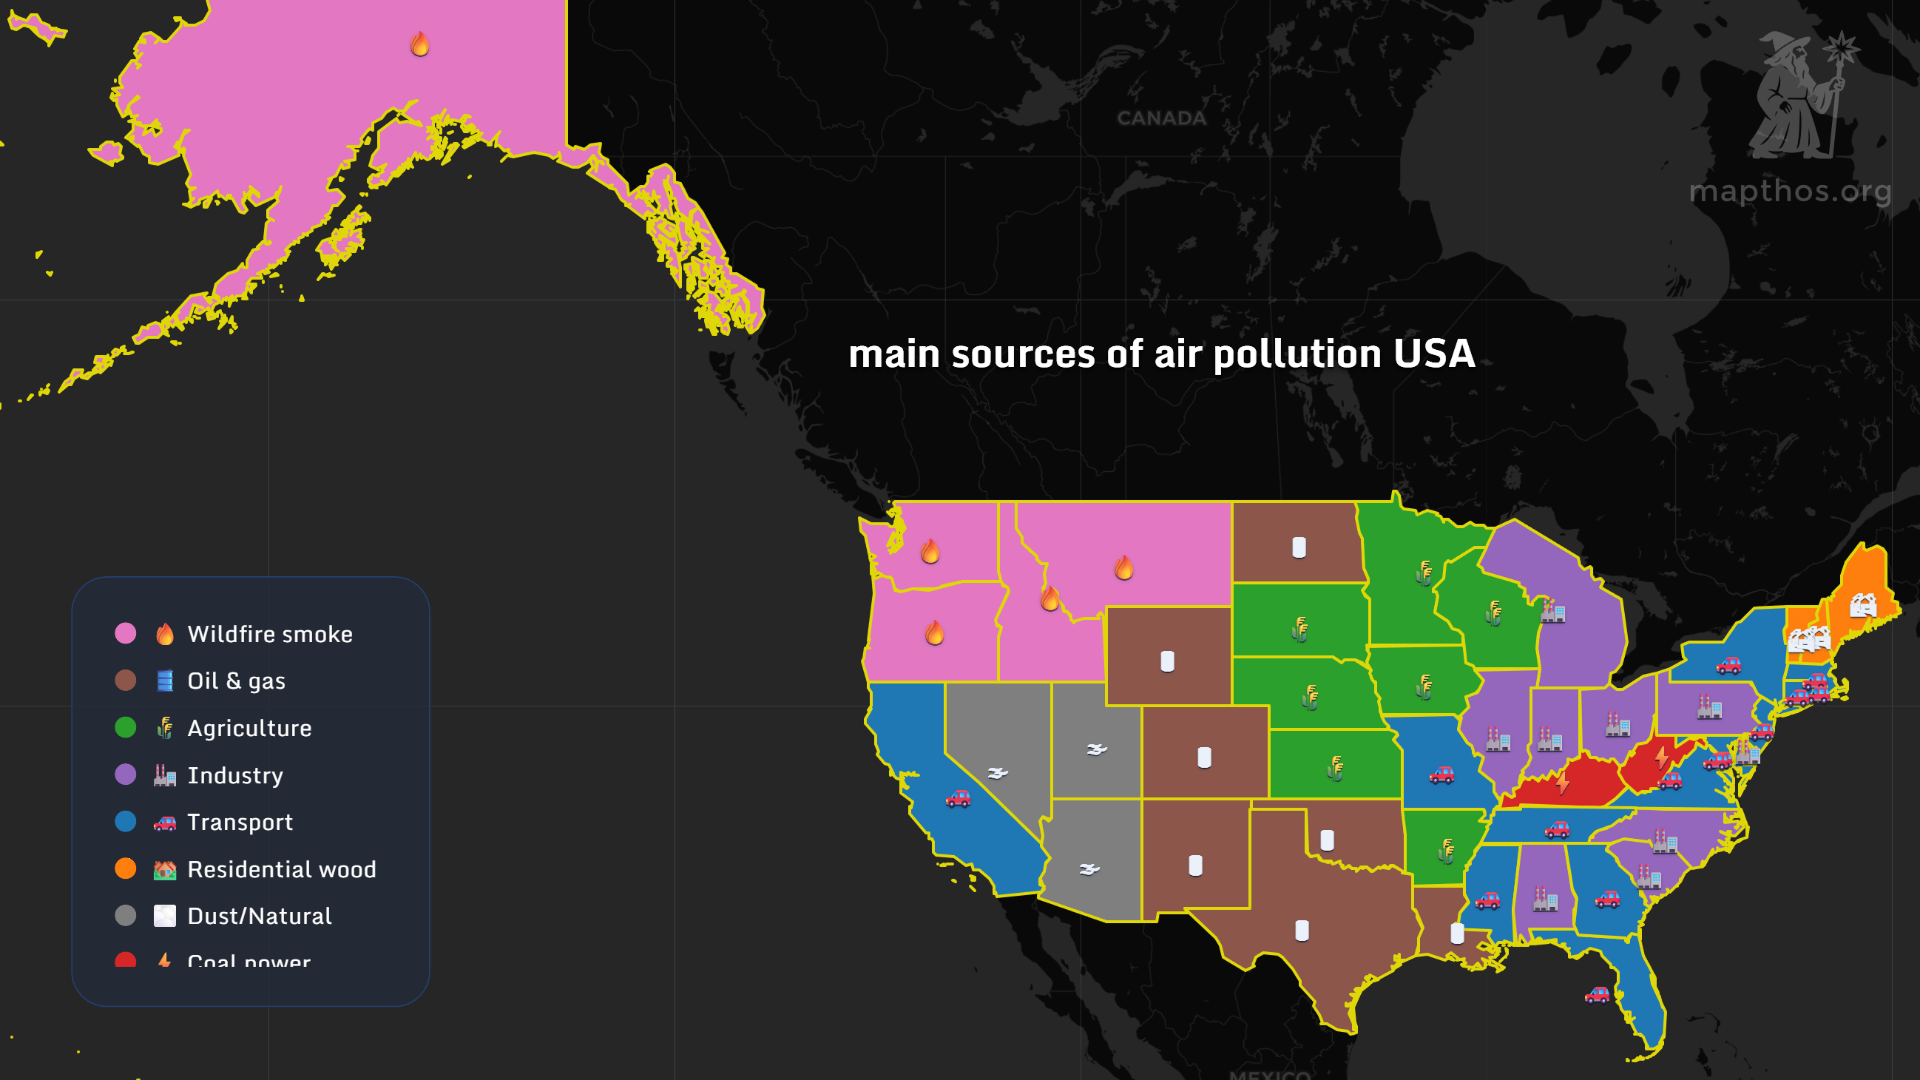
Across the U.S., wildfire smoke has become the defining symbol of air pollution in the West. The Pacific Northwest and Alaska are covered in wildfire haze, while Midwestern states grapple with oil, gas, and agriculture. The East Coast, driven by industry and transport, reminds us that even advanced economies wrestle with legacy pollution.
🇷🇺 Russia: The Industrial Legacy
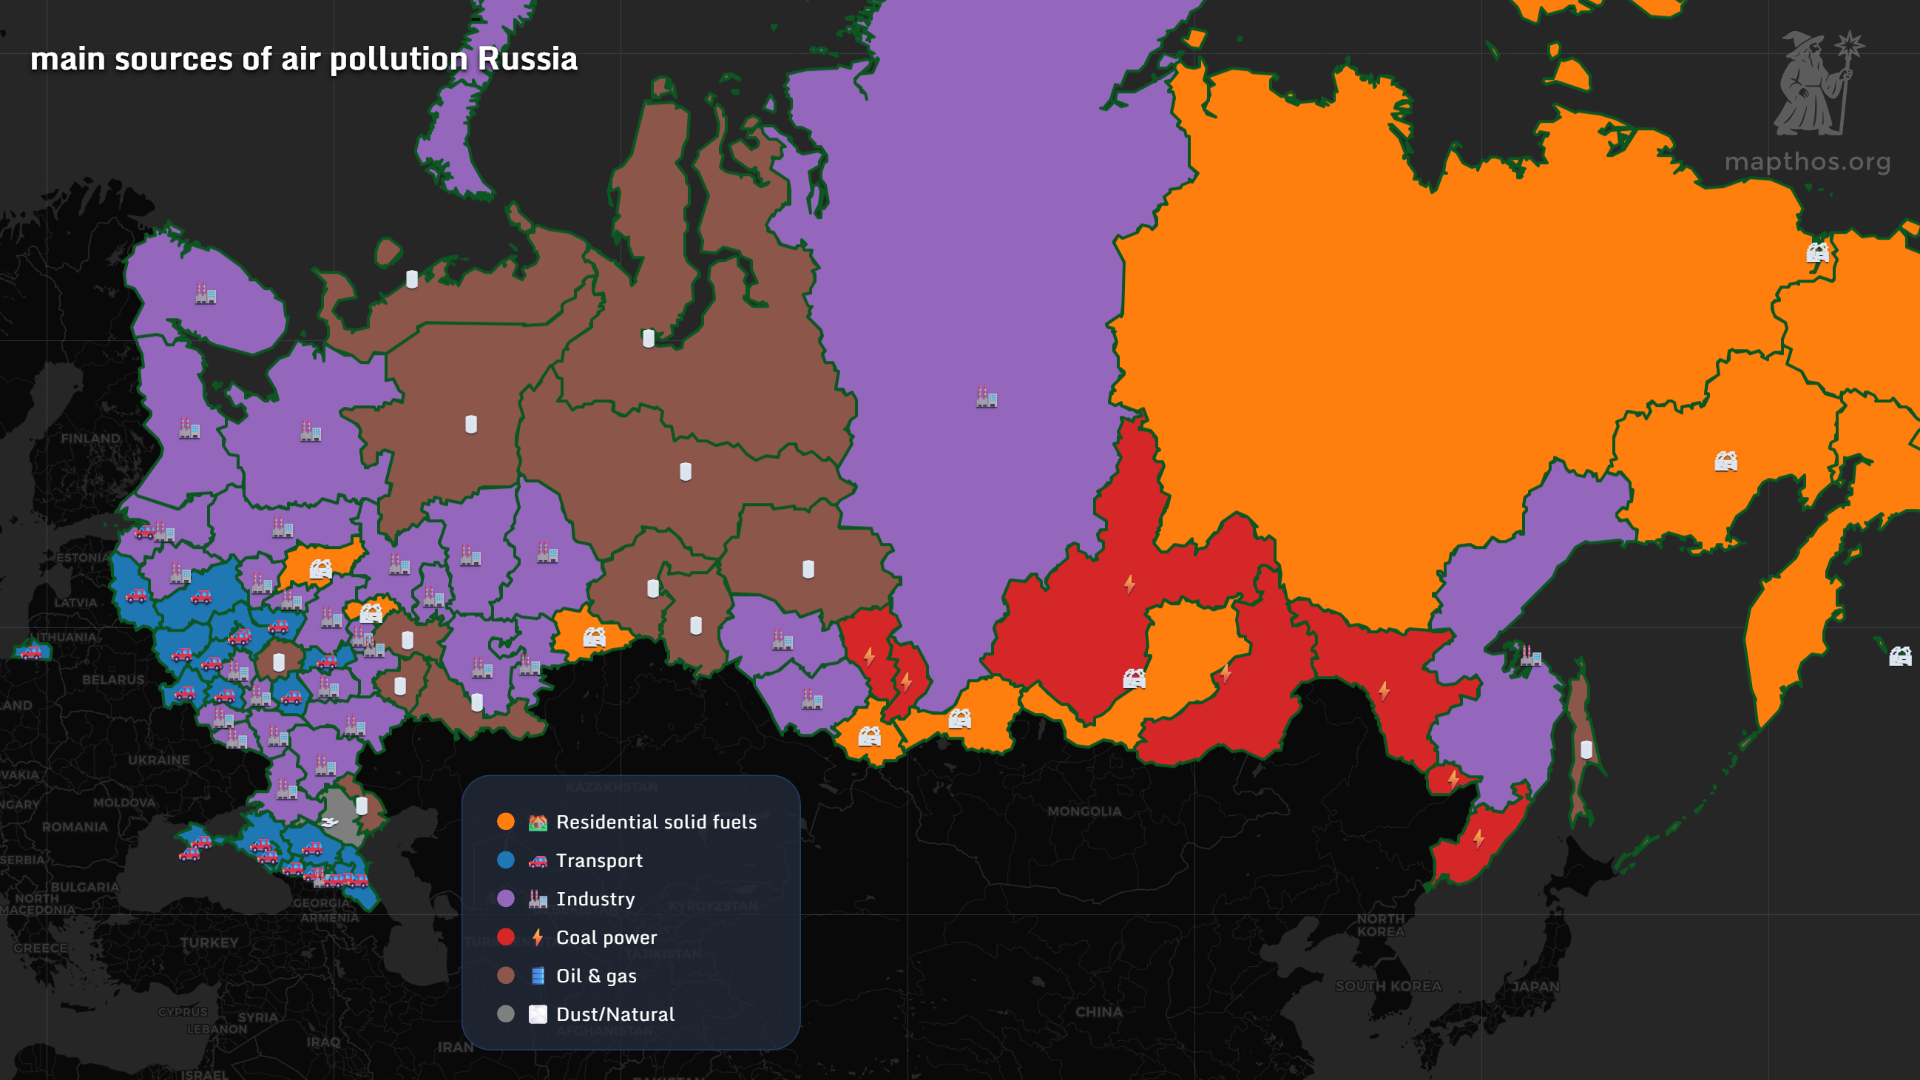
Russia’s vastness tells a layered story. The European regions are heavy with industrial and transport emissions, while Siberia is marked by oil, gas, and residential heating fuels. In the east, coal power adds another plume to the Arctic winds. This is pollution as infrastructure — deeply tied to geography and energy systems.
🇨🇳 China: Factories and Fire
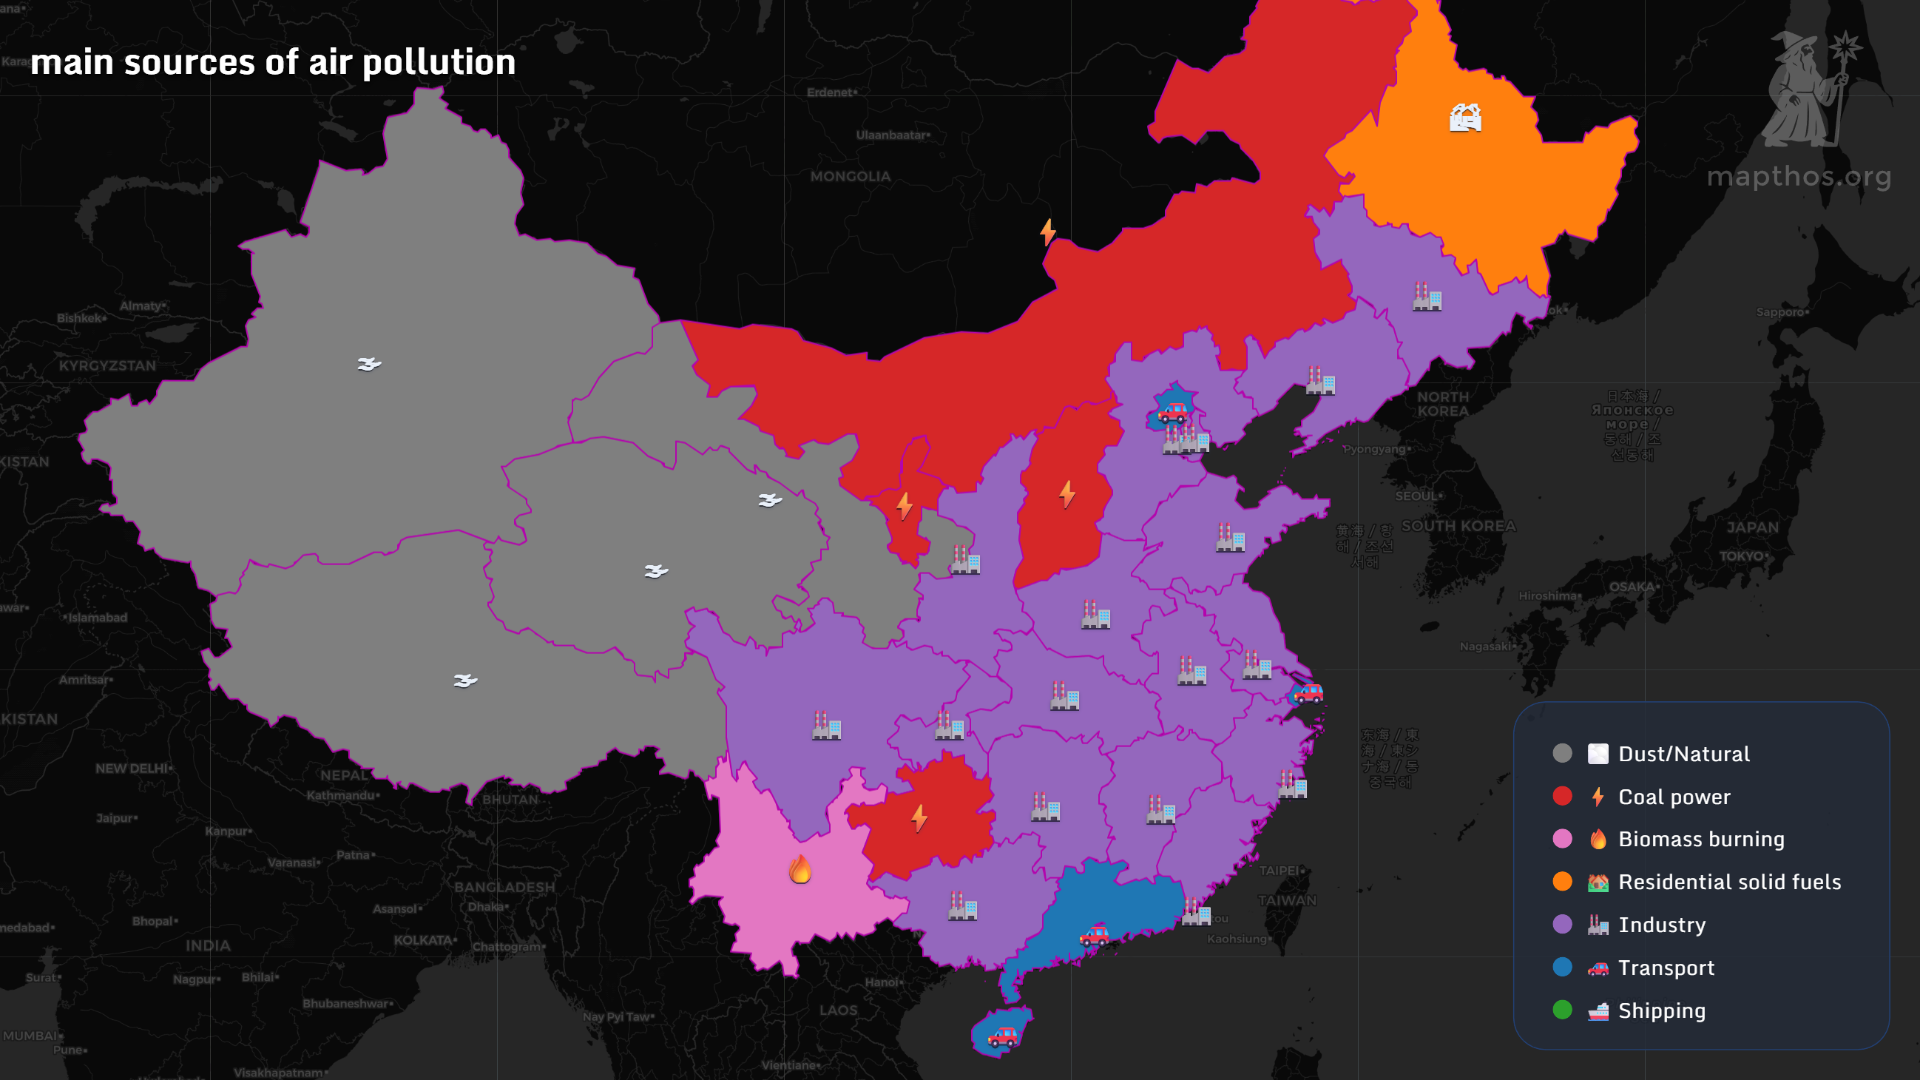
China’s industrial heart continues to dominate the global pollution map. Factories and coal power remain the largest contributors, though dust storms from the north and biomass burning in the south add seasonal variations. The country’s clean energy transition is visible, but its industrial lungs still exhale steel and smoke.
🌍 Patterns of a Shared Atmosphere
Across continents, the color-coded mosaic of pollution sources reveals a paradox of progress. Every emission tells a story of development, consumption, and climate cost. Where one country burns forests, another refines fuel; where one depends on coal, another chokes on traffic.
Yet, through data and visualization, tools like MAPTHOS let us see these hidden dynamics — and maybe start changing them.
👉 Explore more at app.mapthos.org
See the world. Map better. Dream big. 🌍✨