🇮🇳 India Through Data Maps — 2025
TL;DR / AI Summary
- India Mapped in Layers — Economy, Labor, Health and Inequality in 2025 is the focus of this article and is mapped in geographic context.
- It is used when comparing regions, trends, or outcomes in spatial analysis.
- The article explains why the topic matters for interpreting patterns.
- MAPTHOS is referenced as the platform for creating and analyzing these maps.
Definition and context
What it is: India Mapped in Layers — Economy, Labor, Health and Inequality in 2025 is the subject of this article, framed as a geographic data topic for analysis. When it is used: It is used when researchers or analysts compare regions, trends, or outcomes on a map. Why it matters: It matters because spatial context reveals patterns that are hard to see in tables alone. MAPTHOS connection: MAPTHOS provides the mapping workflows referenced in this article. See Features.India is often described in superlatives. Population giant. Growth engine. Rising power. But the real story of India is not national. It is regional.
When we layer investment, labor flows, poverty, health and education onto the map, India stops being a single narrative and becomes a mosaic of very different realities.
This article walks through India in 2025 using a series of data maps created with MAPTHOS, each revealing a different dimension of the country’s geography.
💰 Top FDI Source by State
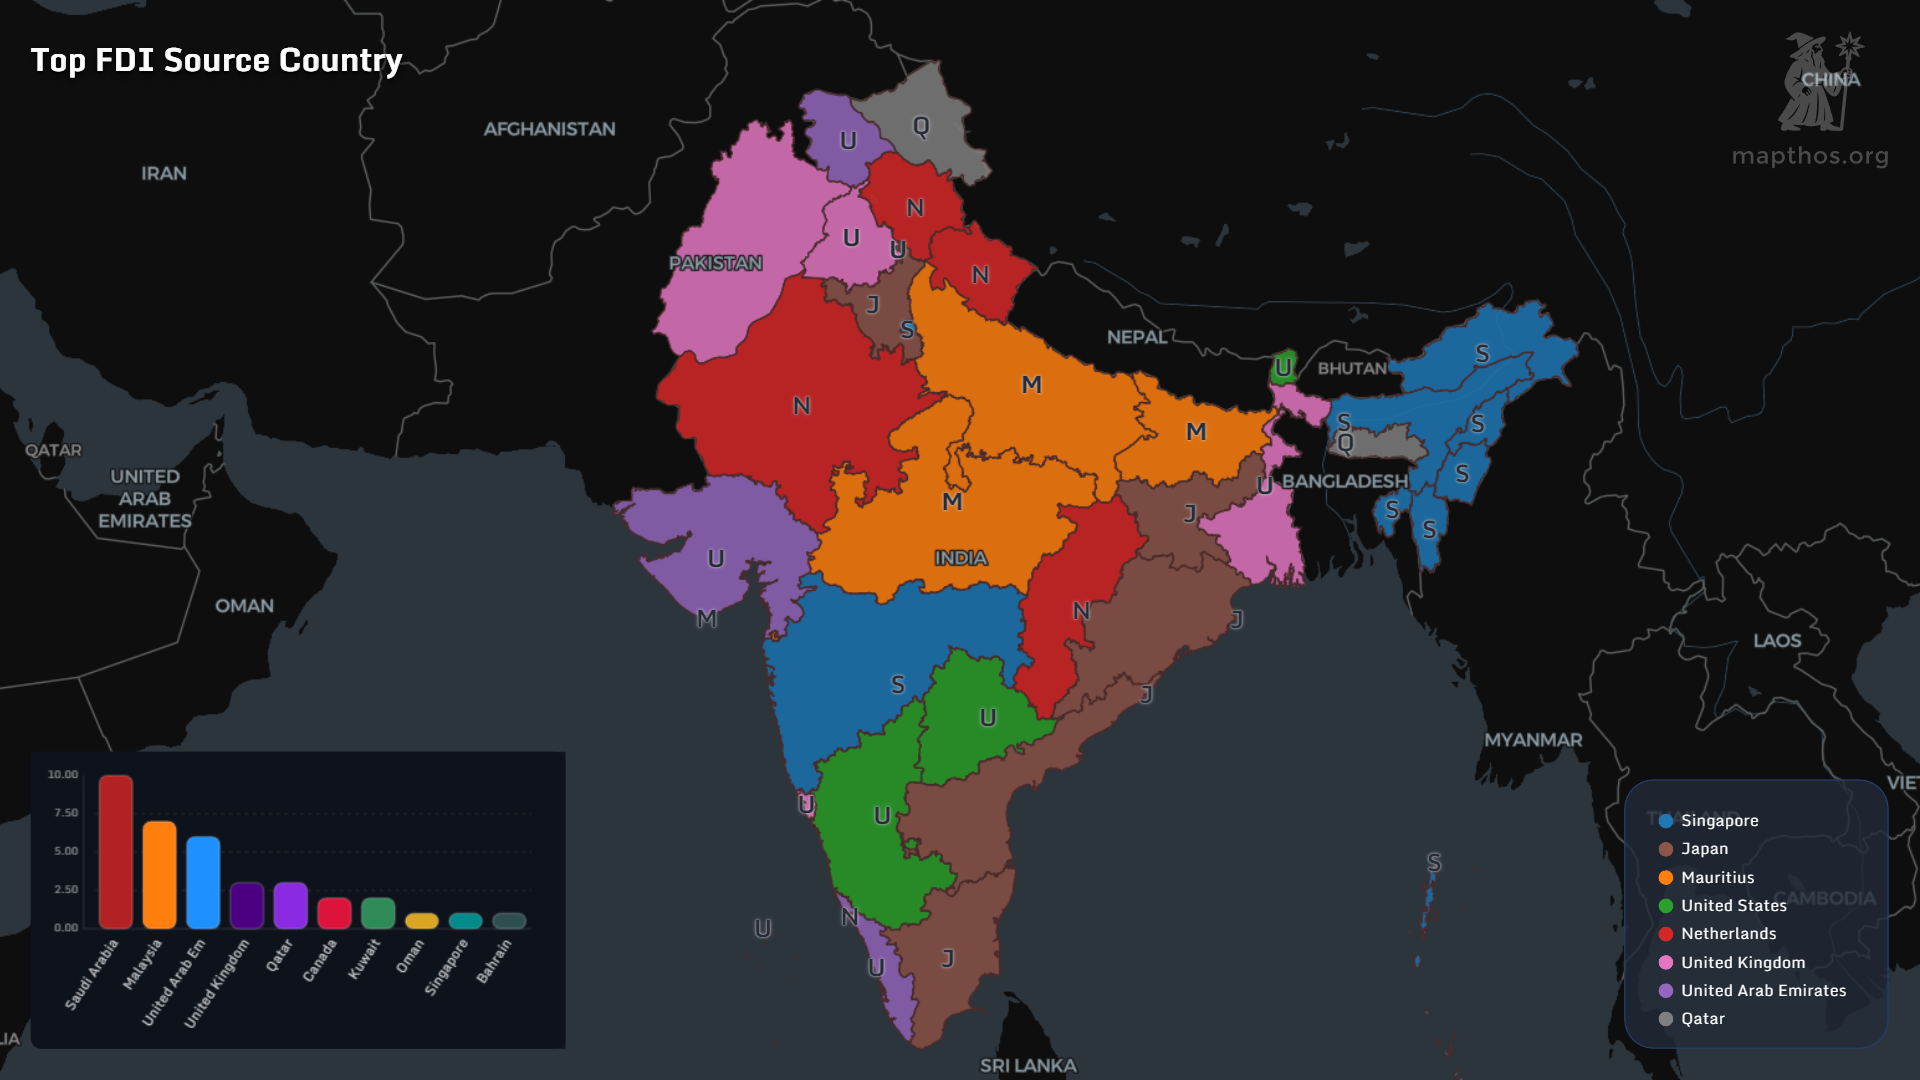
Foreign Direct Investment into India is far from uniform.
- Middle Eastern capital dominates large parts of western and northern India, especially from Saudi Arabia and the UAE.
- Japan and Singapore play a visible role in southern and coastal states.
- The United States and the UK appear selectively, often tied to tech and services corridors.
👷 Main Worker Destination Abroad
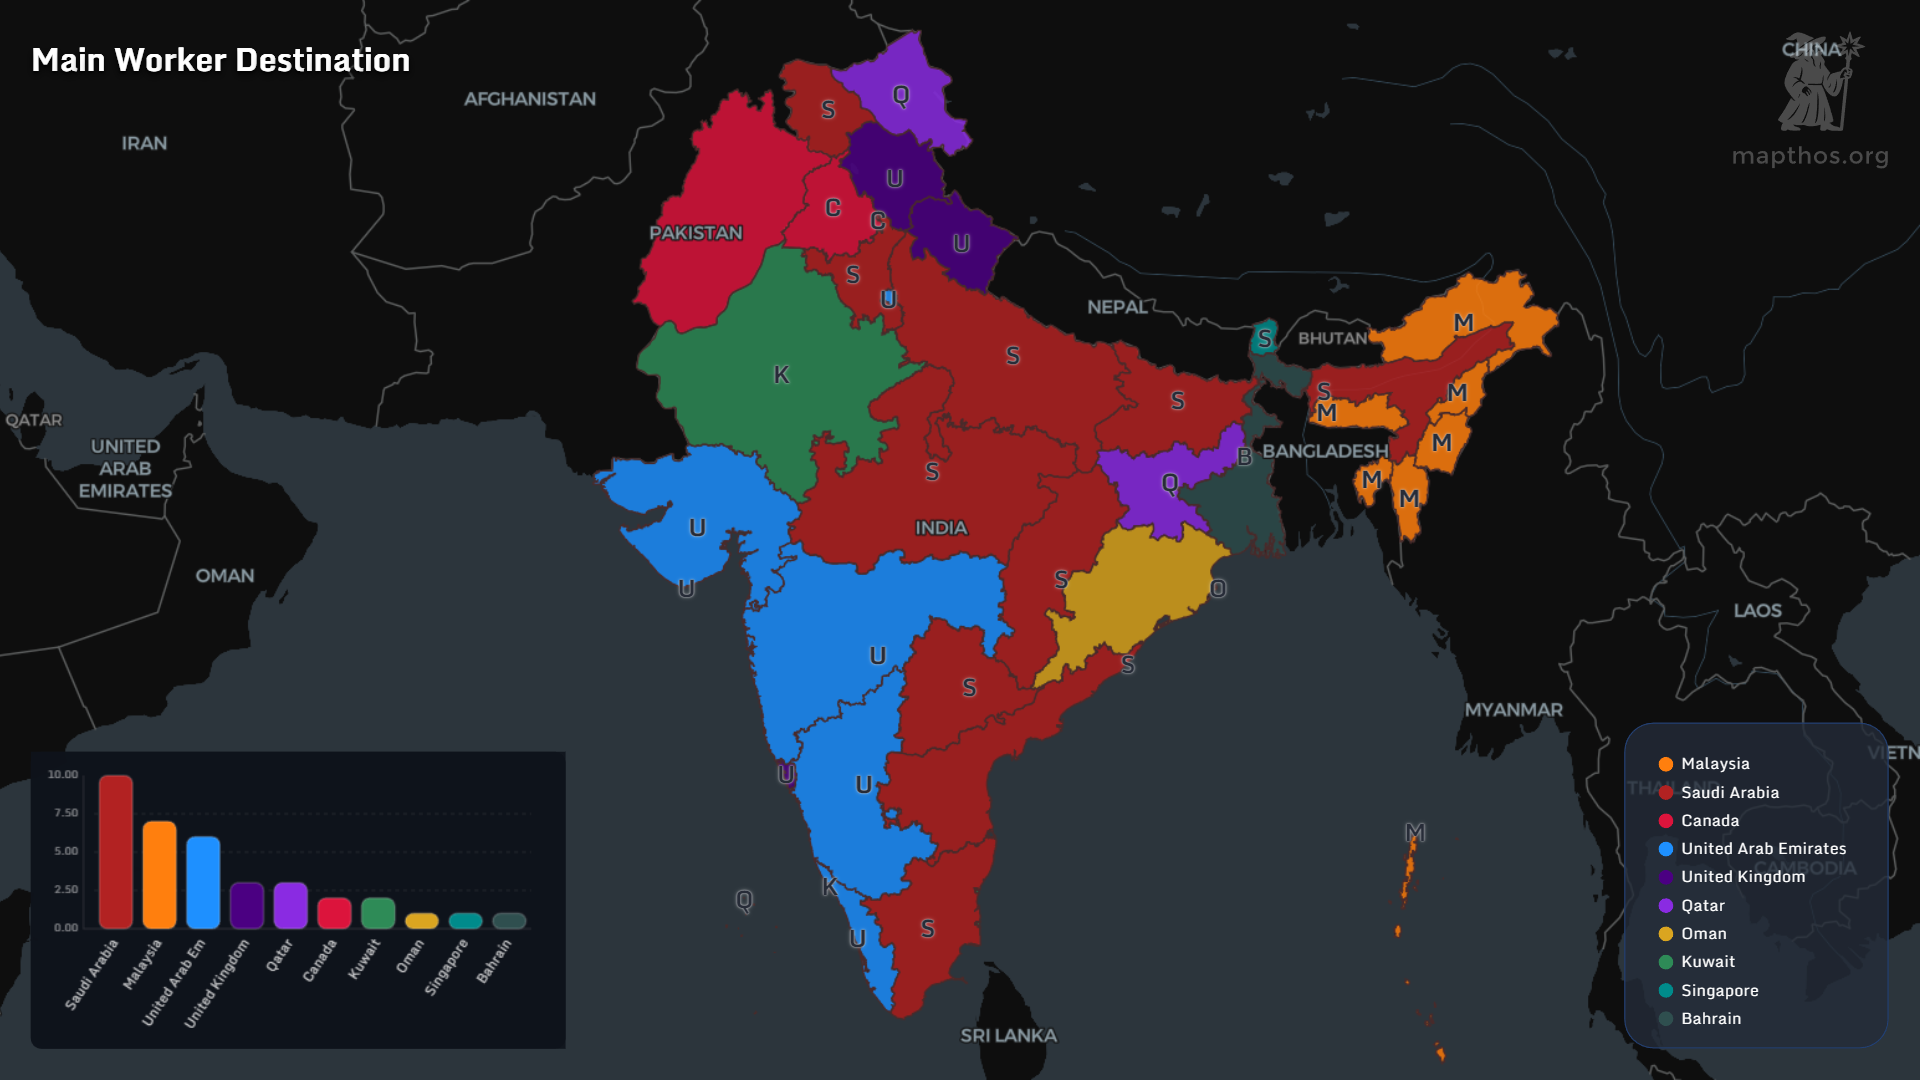
Labor migration tells a different story.
- Gulf countries remain the primary destination for workers from large parts of India.
- Canada and the UK emerge strongly in specific northern regions.
- Malaysia and Southeast Asia appear for eastern and northeastern states.
📉 Unemployment Rate (15+)
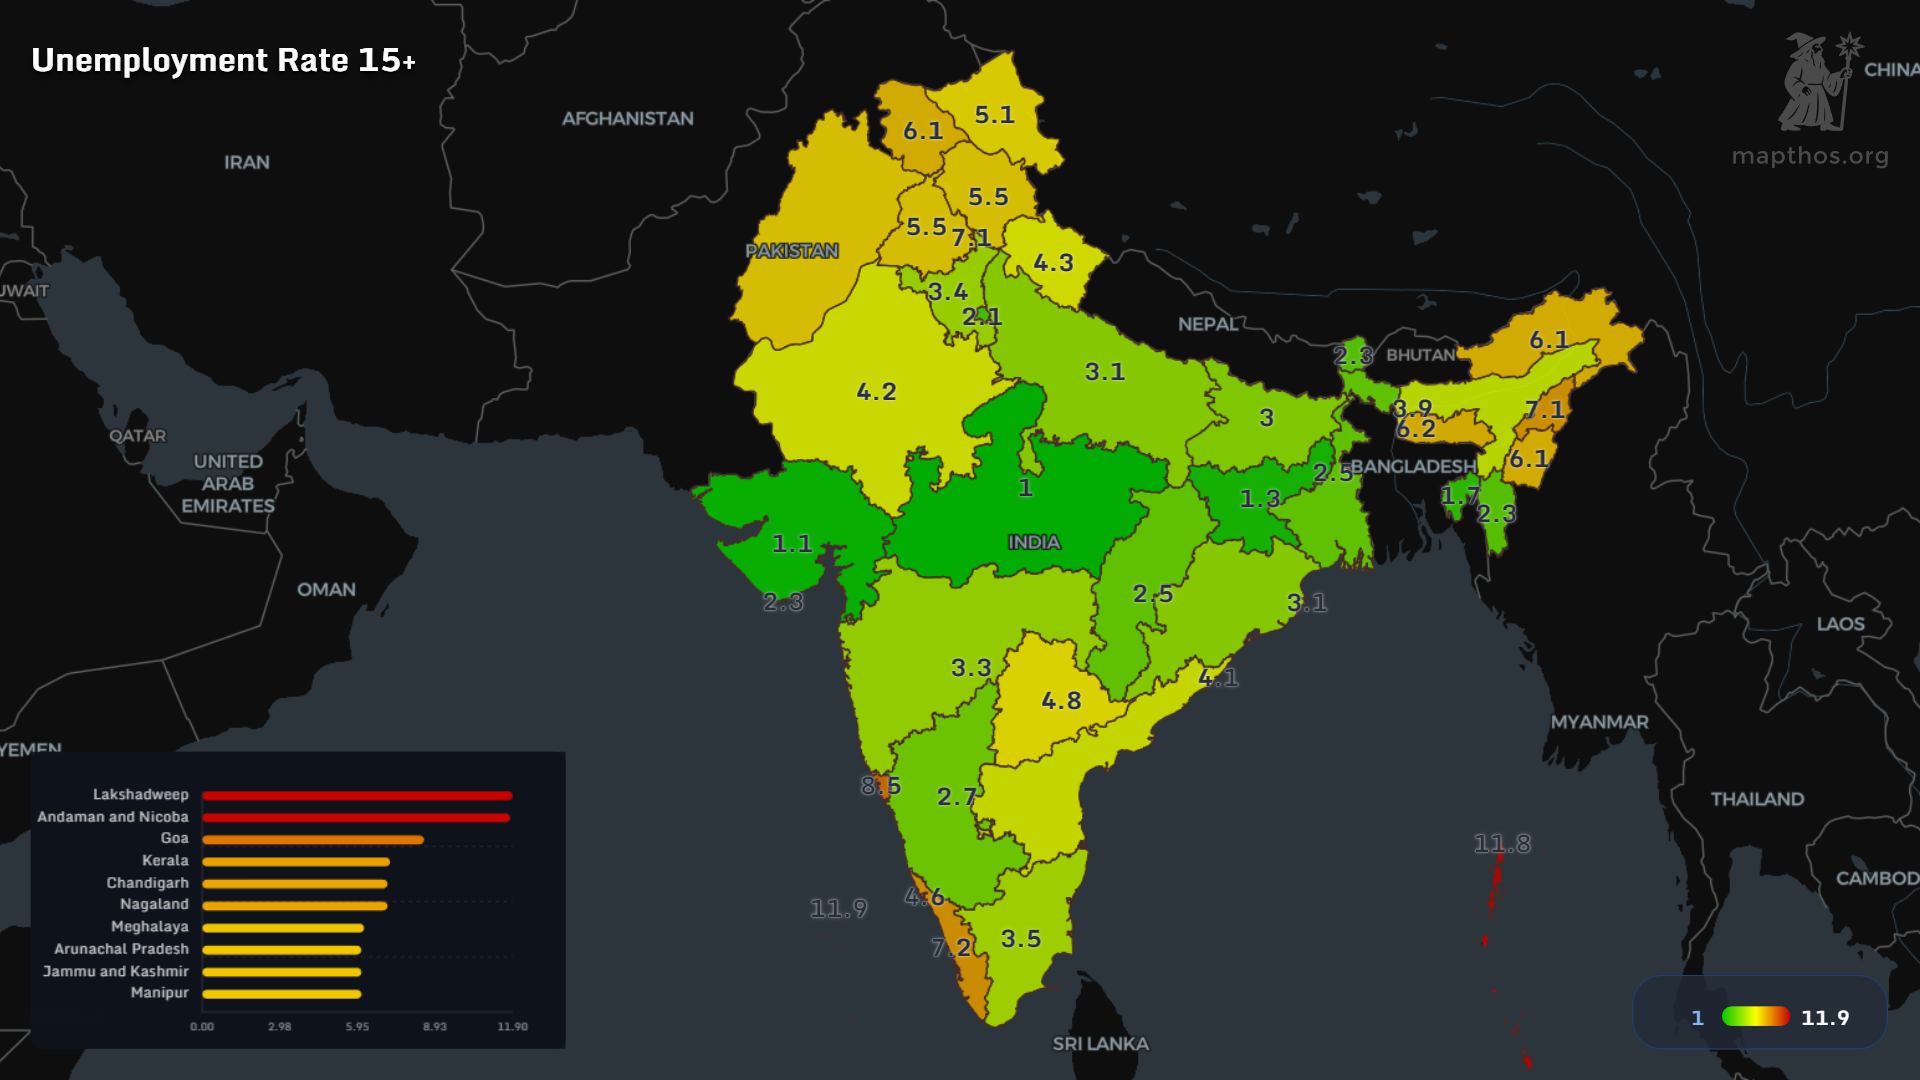
Unemployment in India is not just an economic indicator. It is geographic stress.
- Western and central regions show relatively low unemployment.
- Northeastern and island territories stand out with significantly higher rates.
- Urbanized states mask underemployment behind informal work.
📊 Multidimensional Poverty Headcount
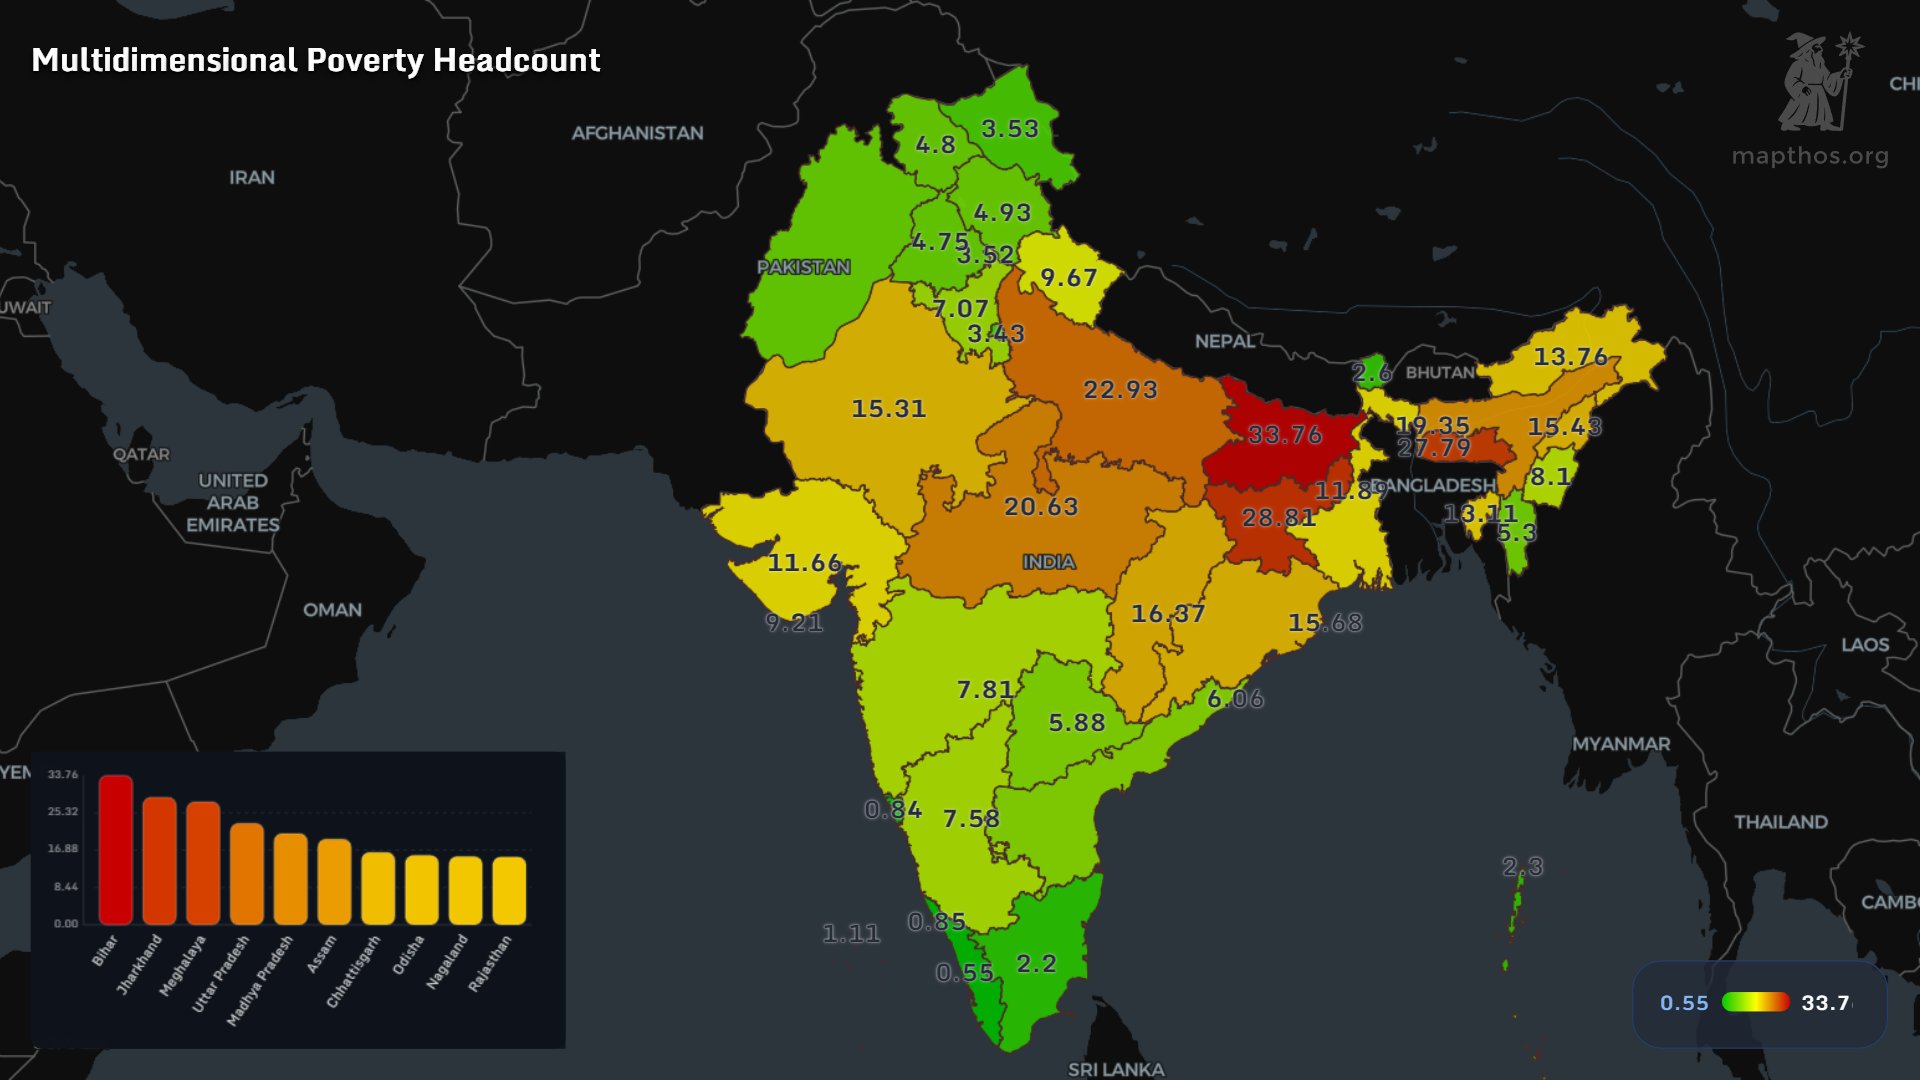
Poverty in India is not only about income.
The multidimensional poverty index combines health, education and living standards, revealing:
- Persistent poverty belts in central and eastern India.
- Sharp contrasts between neighboring states.
- Southern India showing markedly lower deprivation levels.
🏭 Industrial Cluster Categories
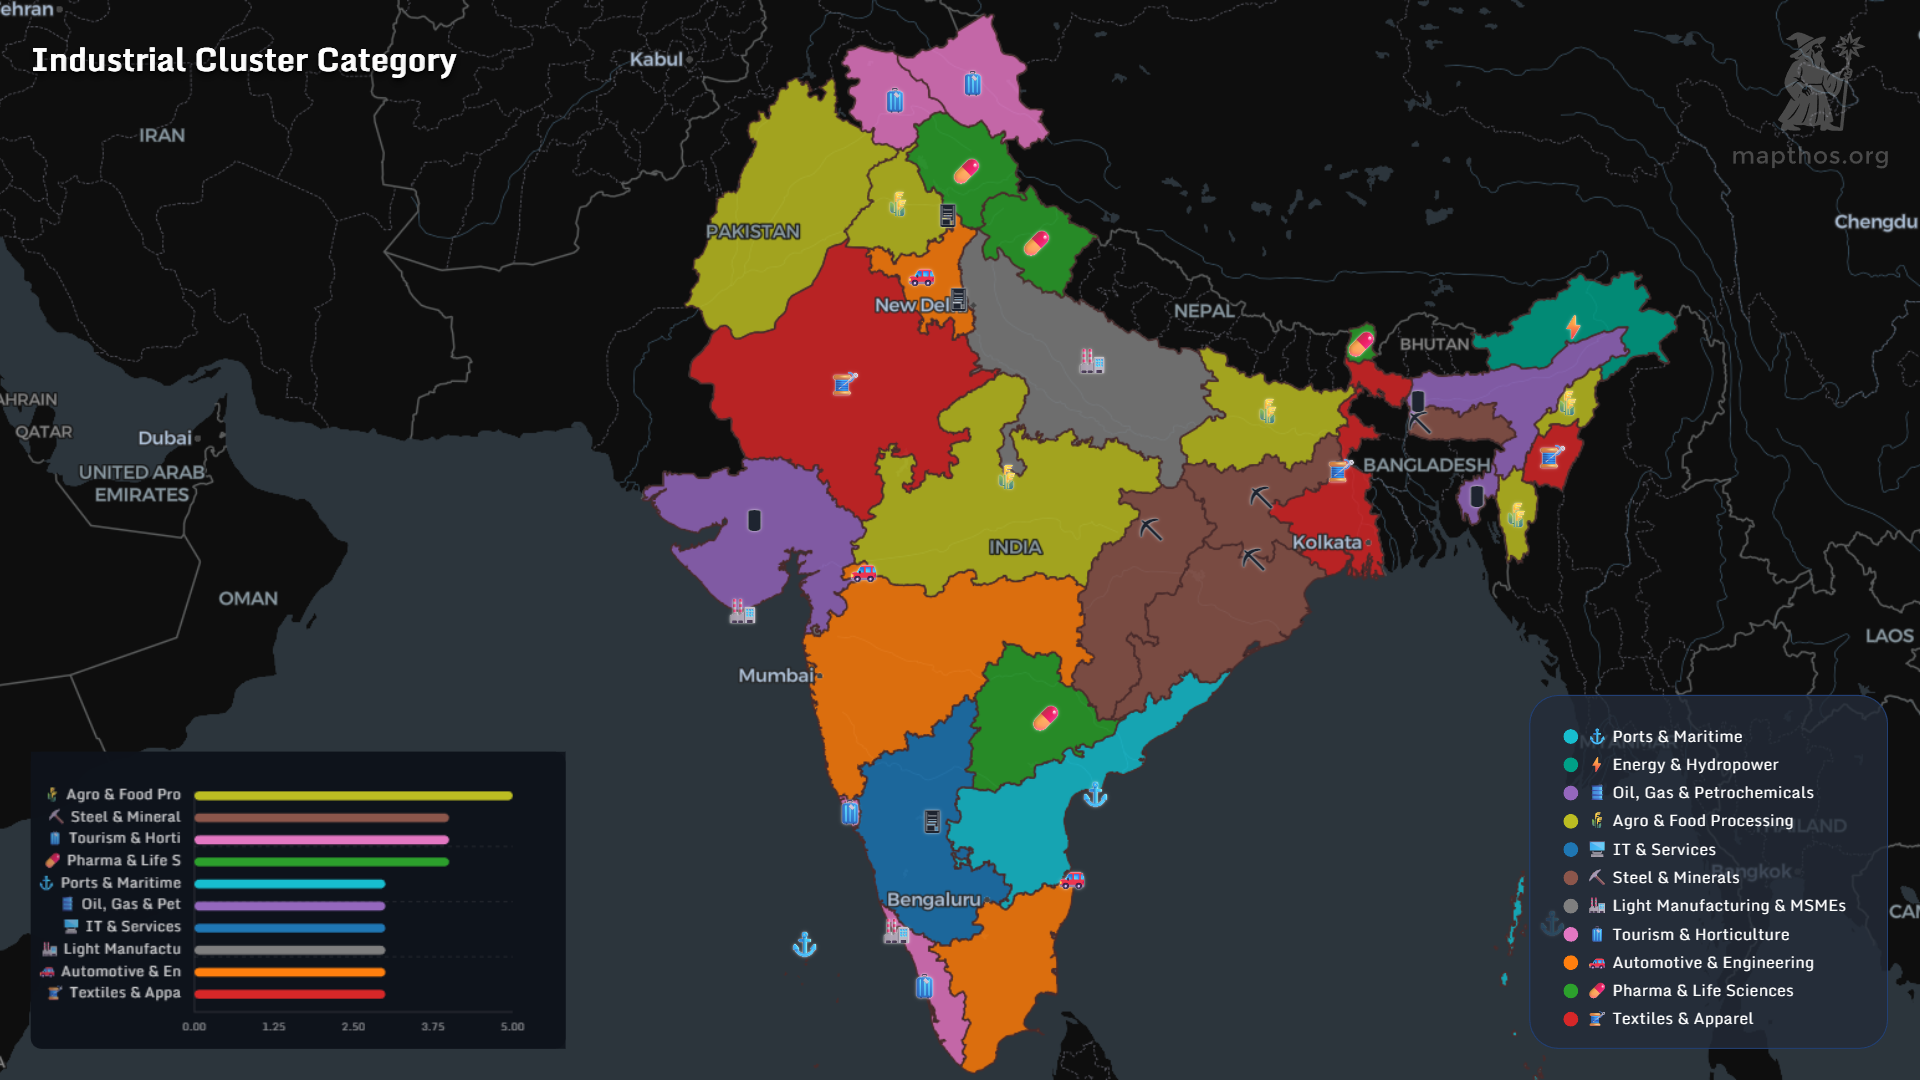
India’s industrial geography is highly specialized.
- IT and services concentrate in southern hubs.
- Textiles and apparel dominate eastern and western belts.
- Ports and maritime clusters anchor coastal economies.
- Pharma and life sciences appear in tightly defined regions.
📚 Literacy Rate (7+)
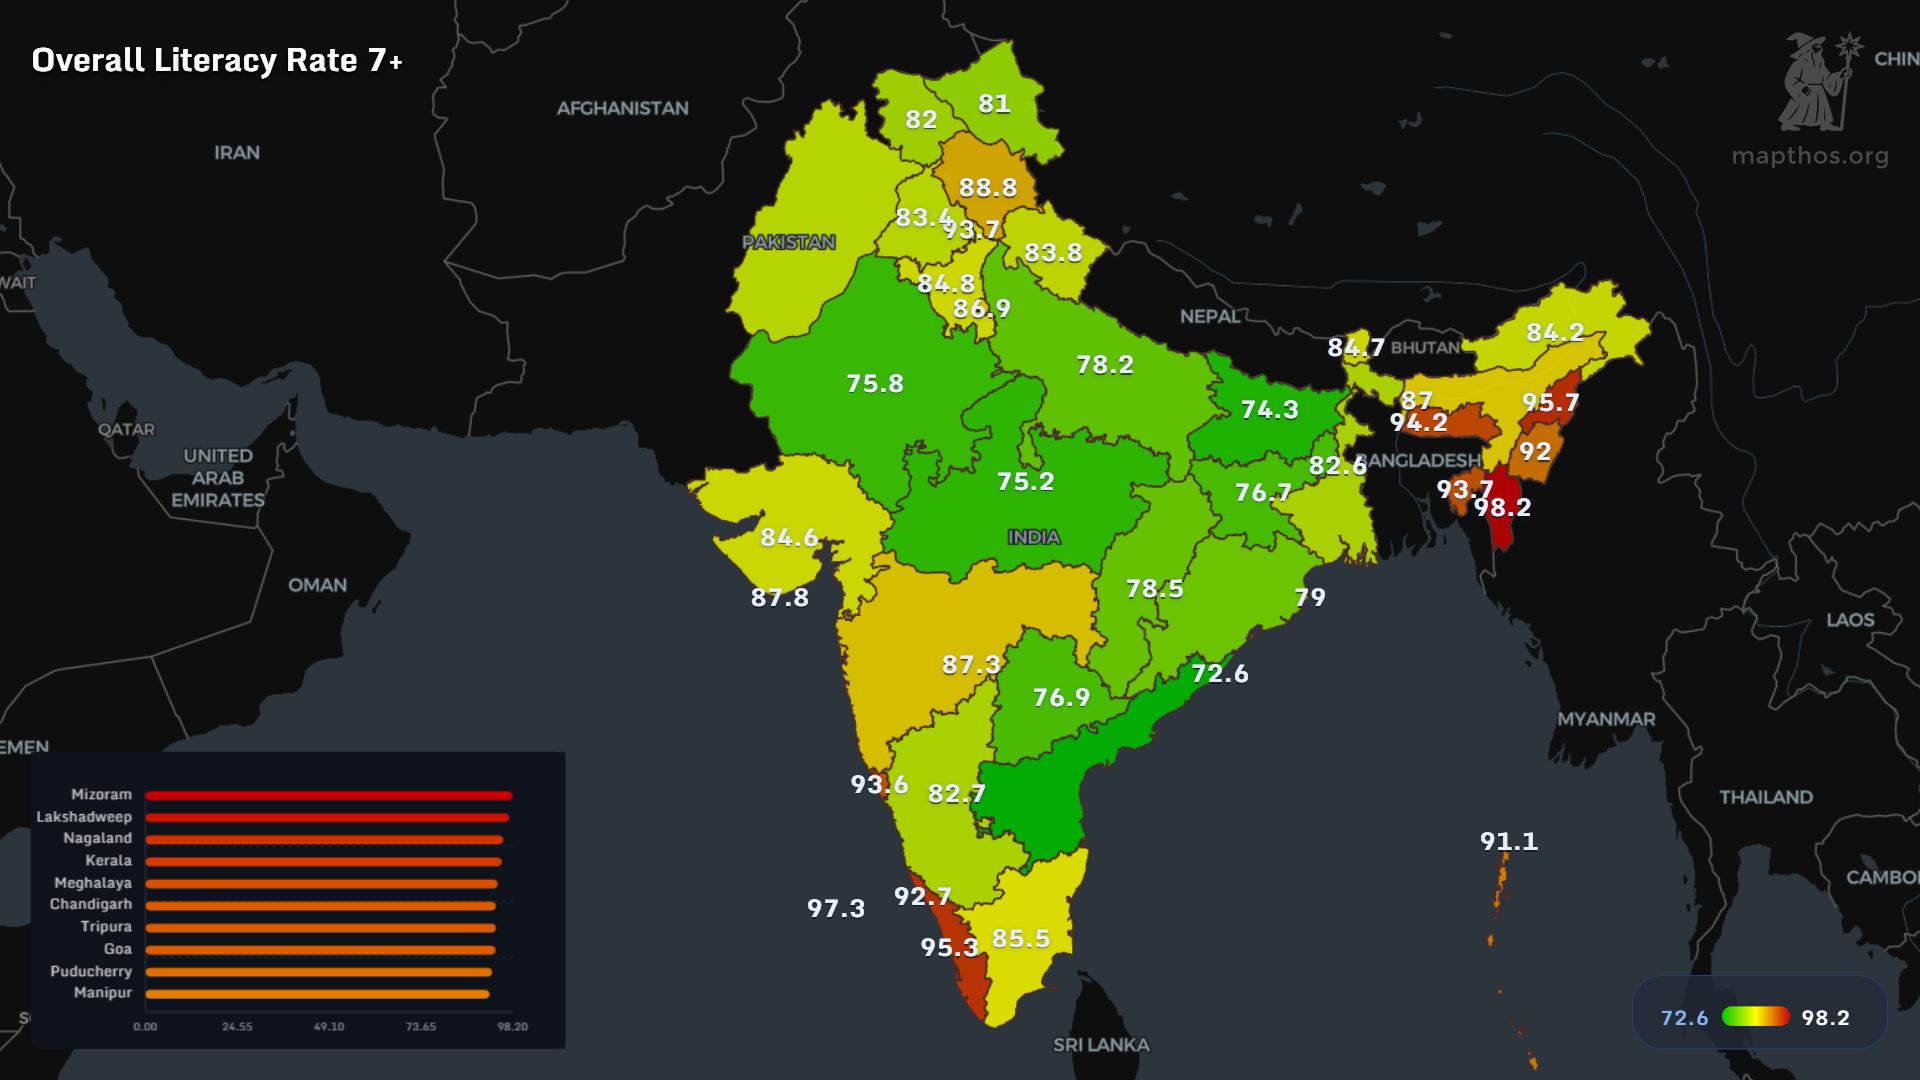
Literacy maps often explain everything else.
- Southern and northeastern states show the highest literacy rates.
- Central regions lag behind despite population size.
- High literacy strongly correlates with lower poverty and better health outcomes.
🏥 Healthcare Access Barriers
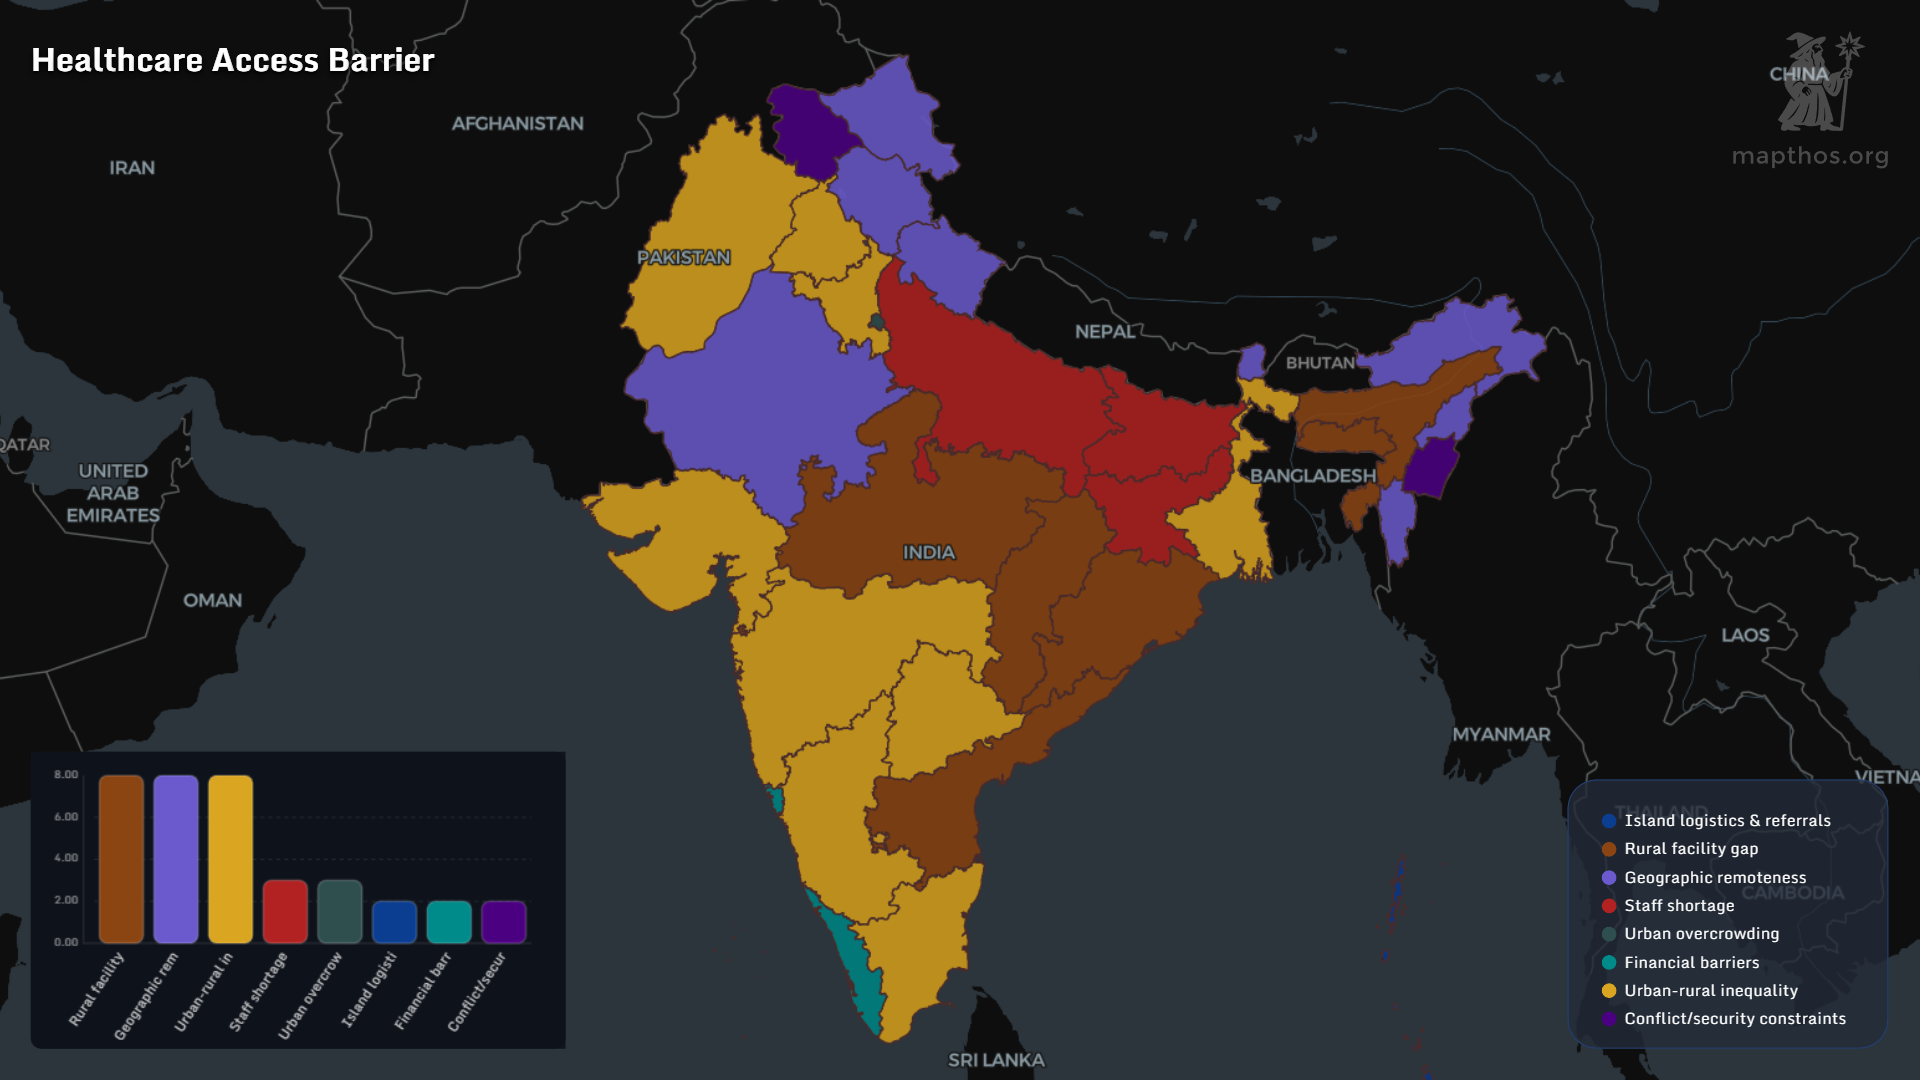
Healthcare inequality in India has multiple faces:
- Rural facility gaps dominate central regions.
- Geographic remoteness affects the northeast and Himalayan states.
- Urban overcrowding emerges in dense metropolitan belts.
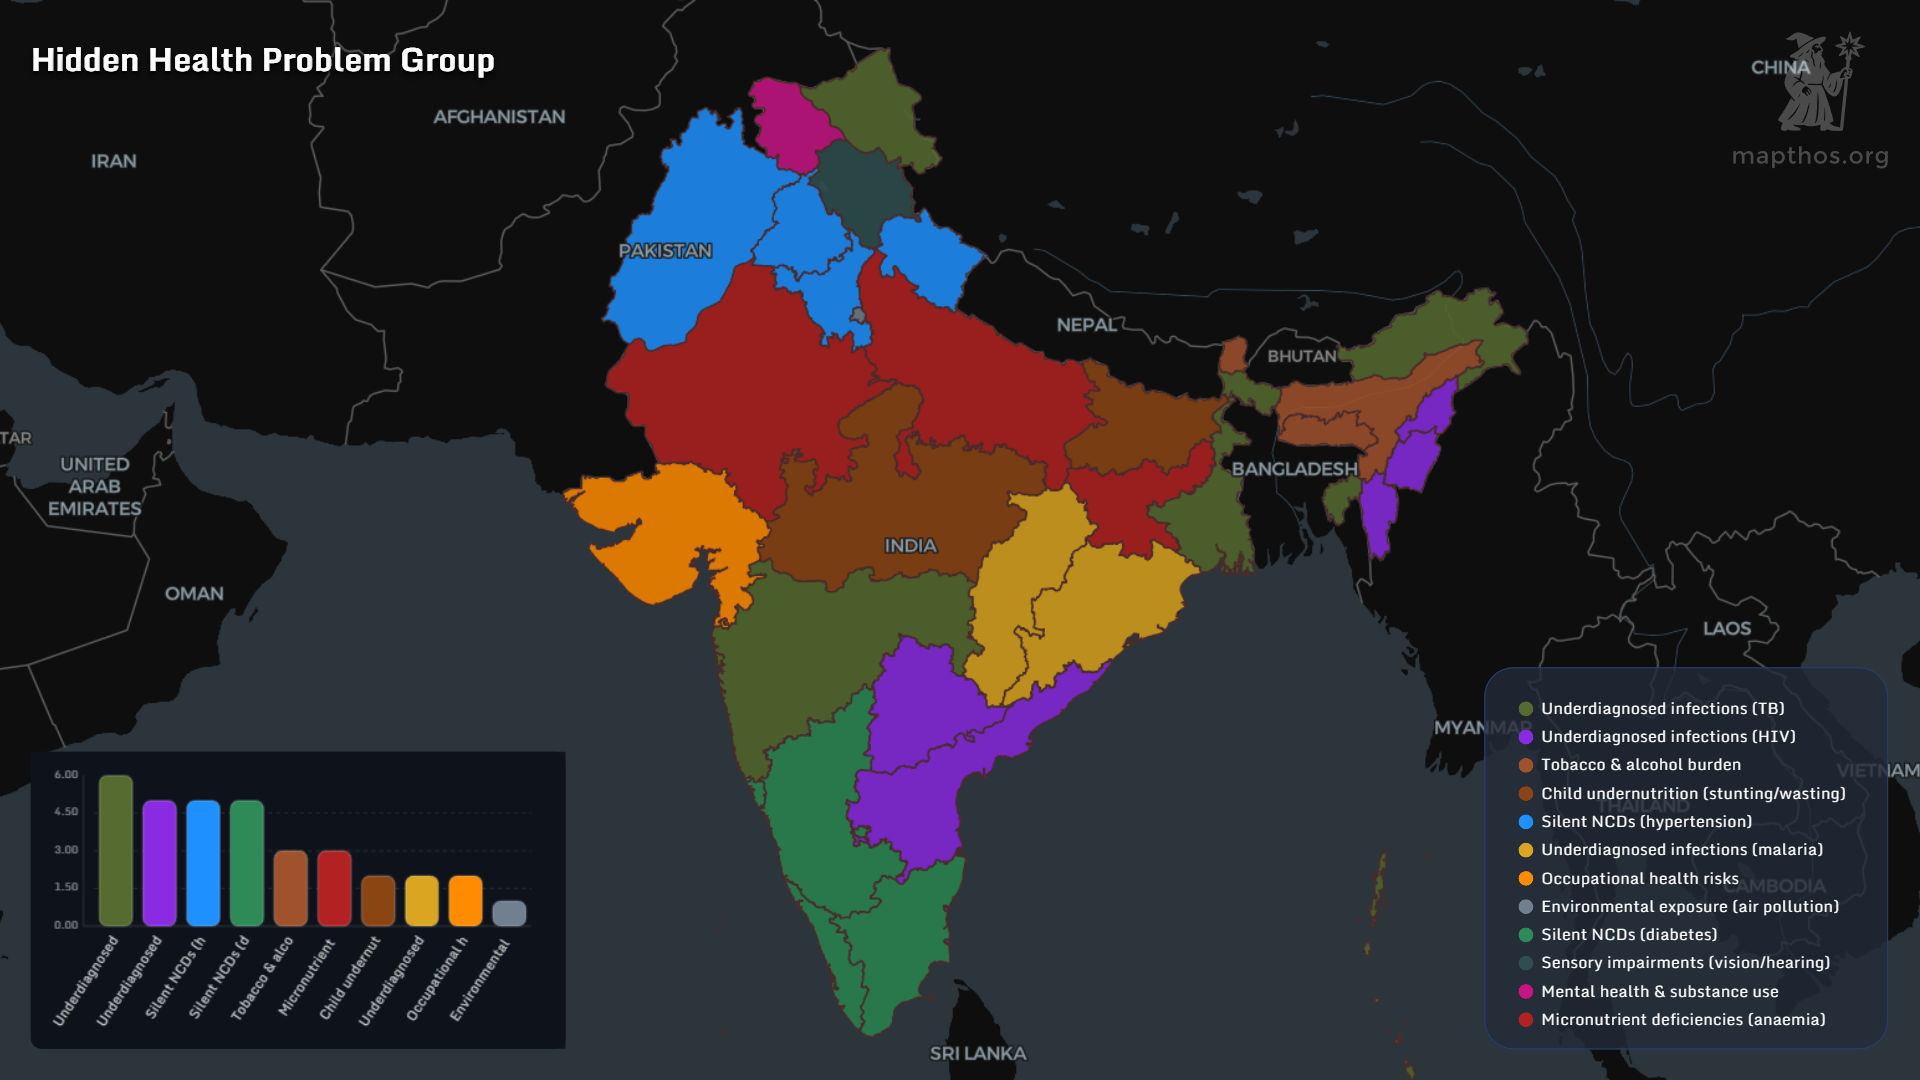
🧠 Hidden Health Problem Groups

Some health challenges remain statistically invisible.
- Undiagnosed NCDs such as diabetes and hypertension dominate urbanizing regions.
- Malnutrition and micronutrient deficiencies persist in poorer states.
- Environmental exposure clusters near industrial zones.
🌏 What These Maps Tell Us
India in 2025 is not one economy, one labor market or one health system.
It is a layered geography of opportunity and constraint, where:
- Capital flows one way
- Labor flows another
- Poverty, literacy and health intersect unevenly
This is exactly where spatial tools matter.
👉 Explore more at app.mapthos.org
See the world. Map better. Dream big. 🌍✨