
🌍 Global Sustainable Consumption in 2026: Waste, Fashion, Food and the Price of Living Green
Sustainability is often described as a personal choice.
Buy better. Waste less. Recycle more. Choose organic. Avoid plastic. Repair instead of replace.
But when we map the data, the story becomes larger and more complicated. Consumption is not only about individual habits. It is shaped by income, trade routes, tourism, packaging systems, public policy, industrial exports and the invisible infrastructure behind everyday life.
These maps reveal the hidden geography of sustainable consumption in 2026 — where waste piles up, where circular economies are emerging, where green products remain expensive, and where the global economy still rewards disposable habits.
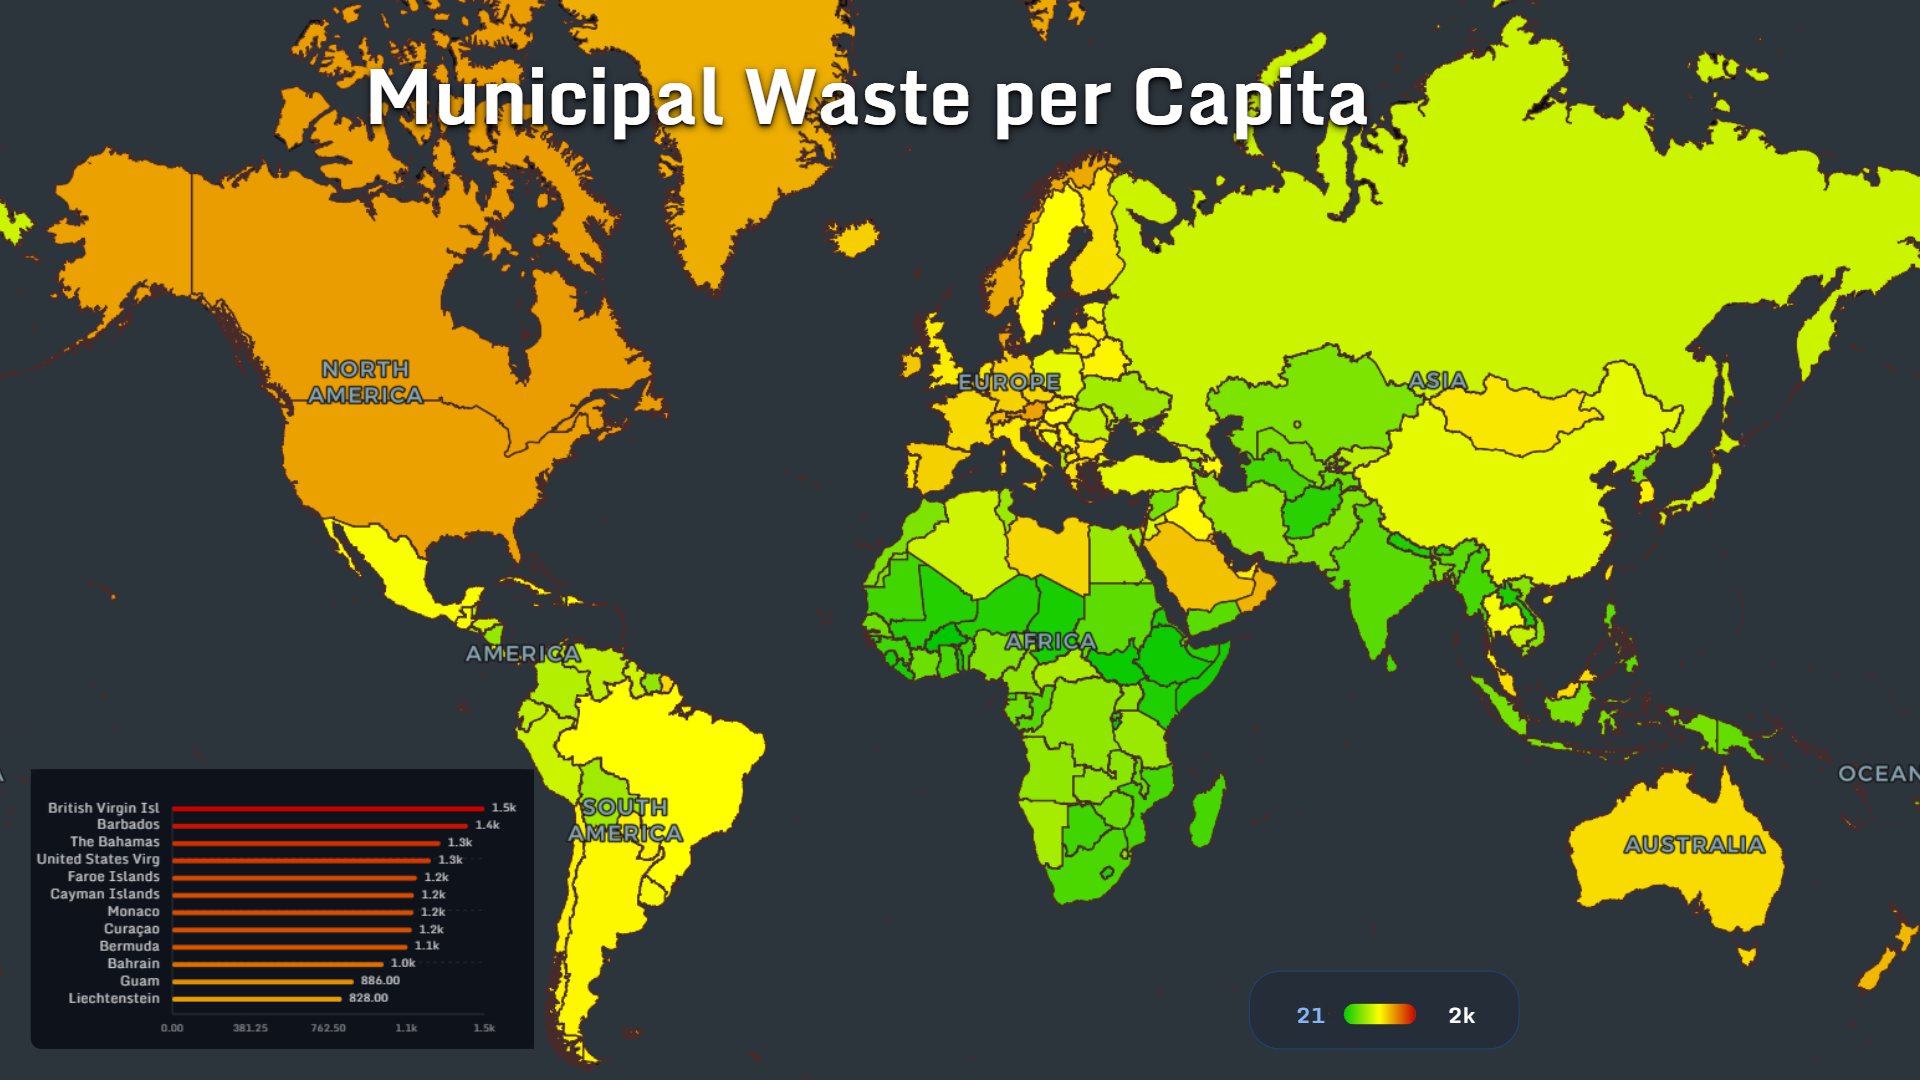
Municipal Waste per Capita: Small Places, Big Footprints
The municipal waste map opens with a striking pattern: many of the highest values are not large countries, but small islands and wealthy micro-territories.
The leading entries are:
- British Virgin Islands: 1.5k
- Barbados: 1.4k
- The Bahamas: 1.3k
- United States Virgin Islands: 1.3k
- Faroe Islands: 1.2k
- Cayman Islands: 1.2k
- Monaco: 1.2k
- Curaçao: 1.2k
- Bermuda: 1.1k
- Bahrain: 1.0k
- Guam: 886
- Liechtenstein: 828
Island economies face a special problem. Many goods arrive packaged, processed and transported from elsewhere. After consumption, the waste remains local. Small land area and limited landfill capacity make the footprint harder to hide.
A large country can spread waste across regions. A small island cannot.
Plastic Waste per Capita: The Rich World’s Disposable Shadow
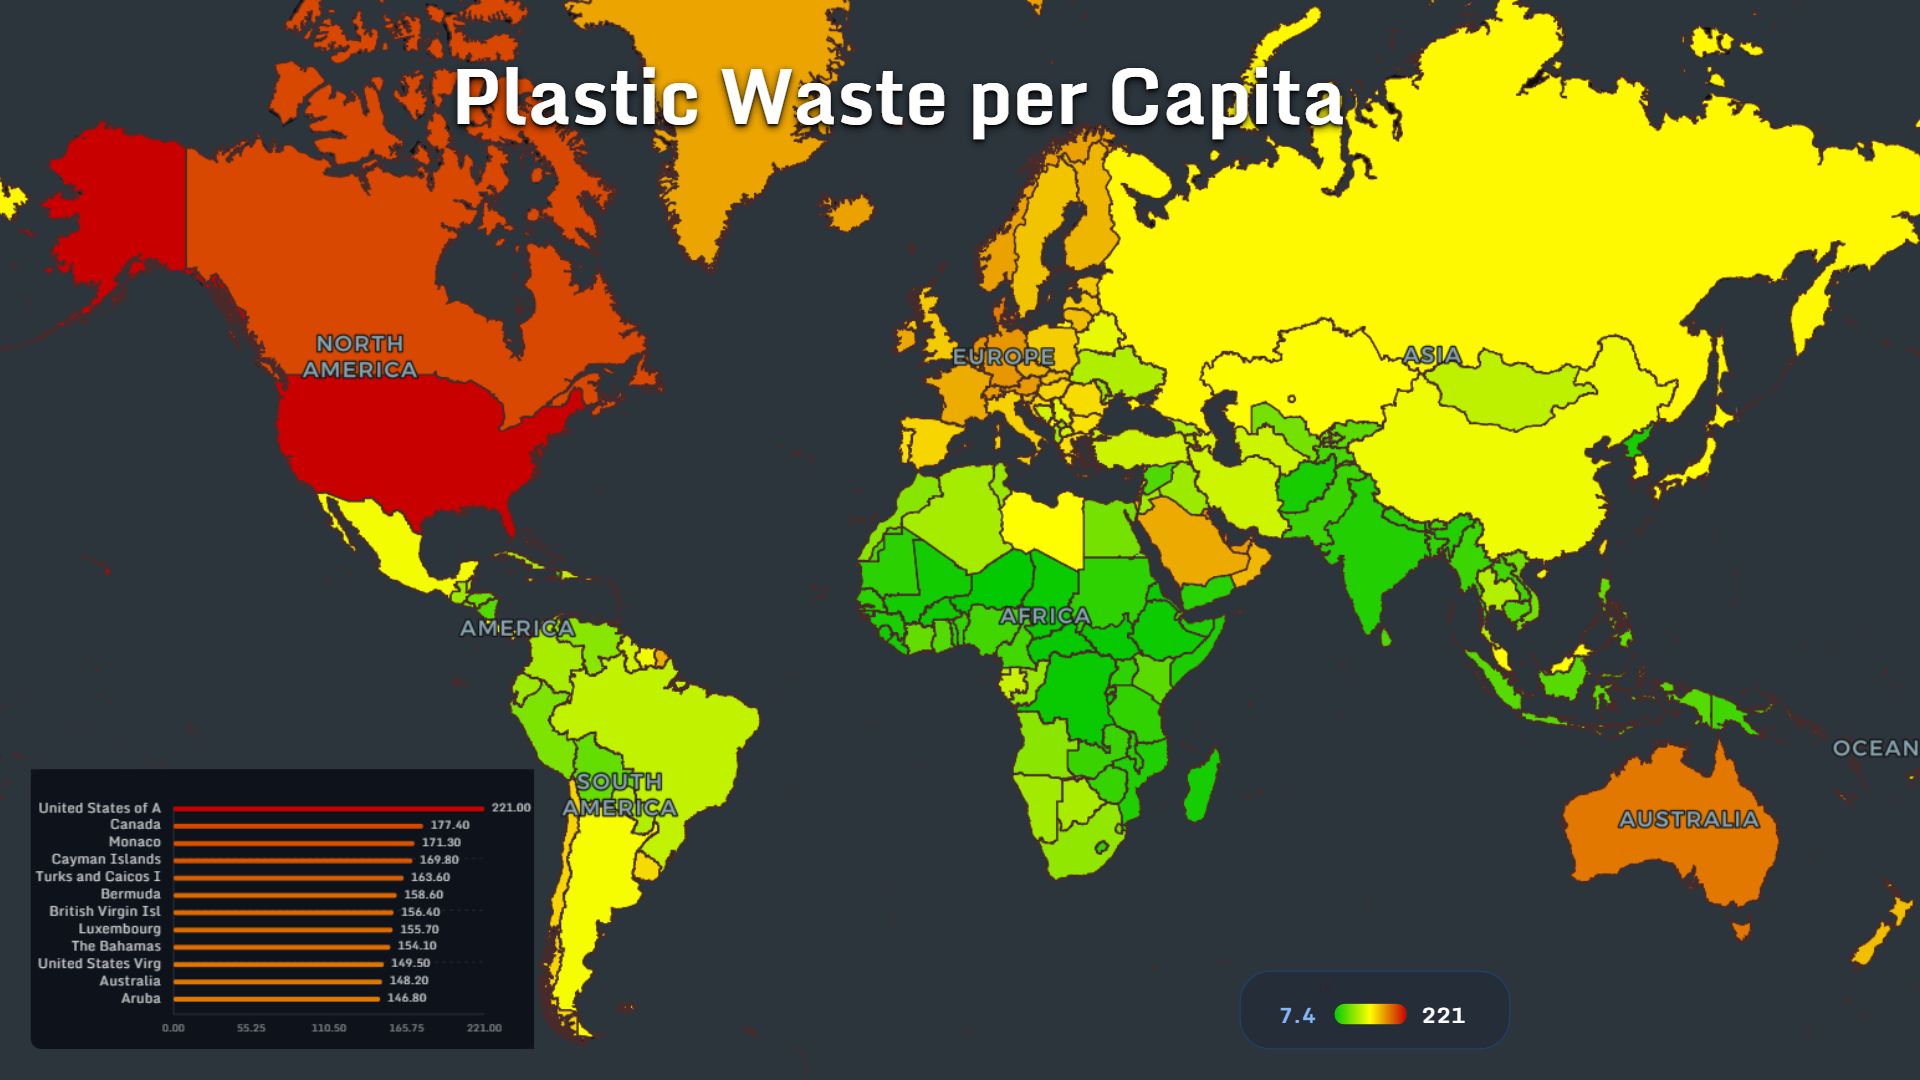
Plastic waste per capita shows a familiar but uncomfortable pattern.
The United States leads the dataset at 221, followed by Canada at 177.4 and Monaco at 171.3. Several island territories follow closely:
- Cayman Islands: 169.8
- Turks and Caicos Islands: 163.6
- Bermuda: 158.6
- British Virgin Islands: 156.4
- Luxembourg: 155.7
- The Bahamas: 154.1
- United States Virgin Islands: 149.5
- Australia: 148.2
- Aruba: 146.8
It appears in food delivery, retail, travel, household goods, cosmetics, logistics, medicine and e-commerce. The countries and territories with high values are often places where consumption is fast, incomes are high, imports are heavy or tourism creates short-term demand.
The map makes one thing clear: plastic waste is a geography of lifestyle as much as material.
Paper Packaging per Capita: “Natural” Does Not Always Mean Low Impact
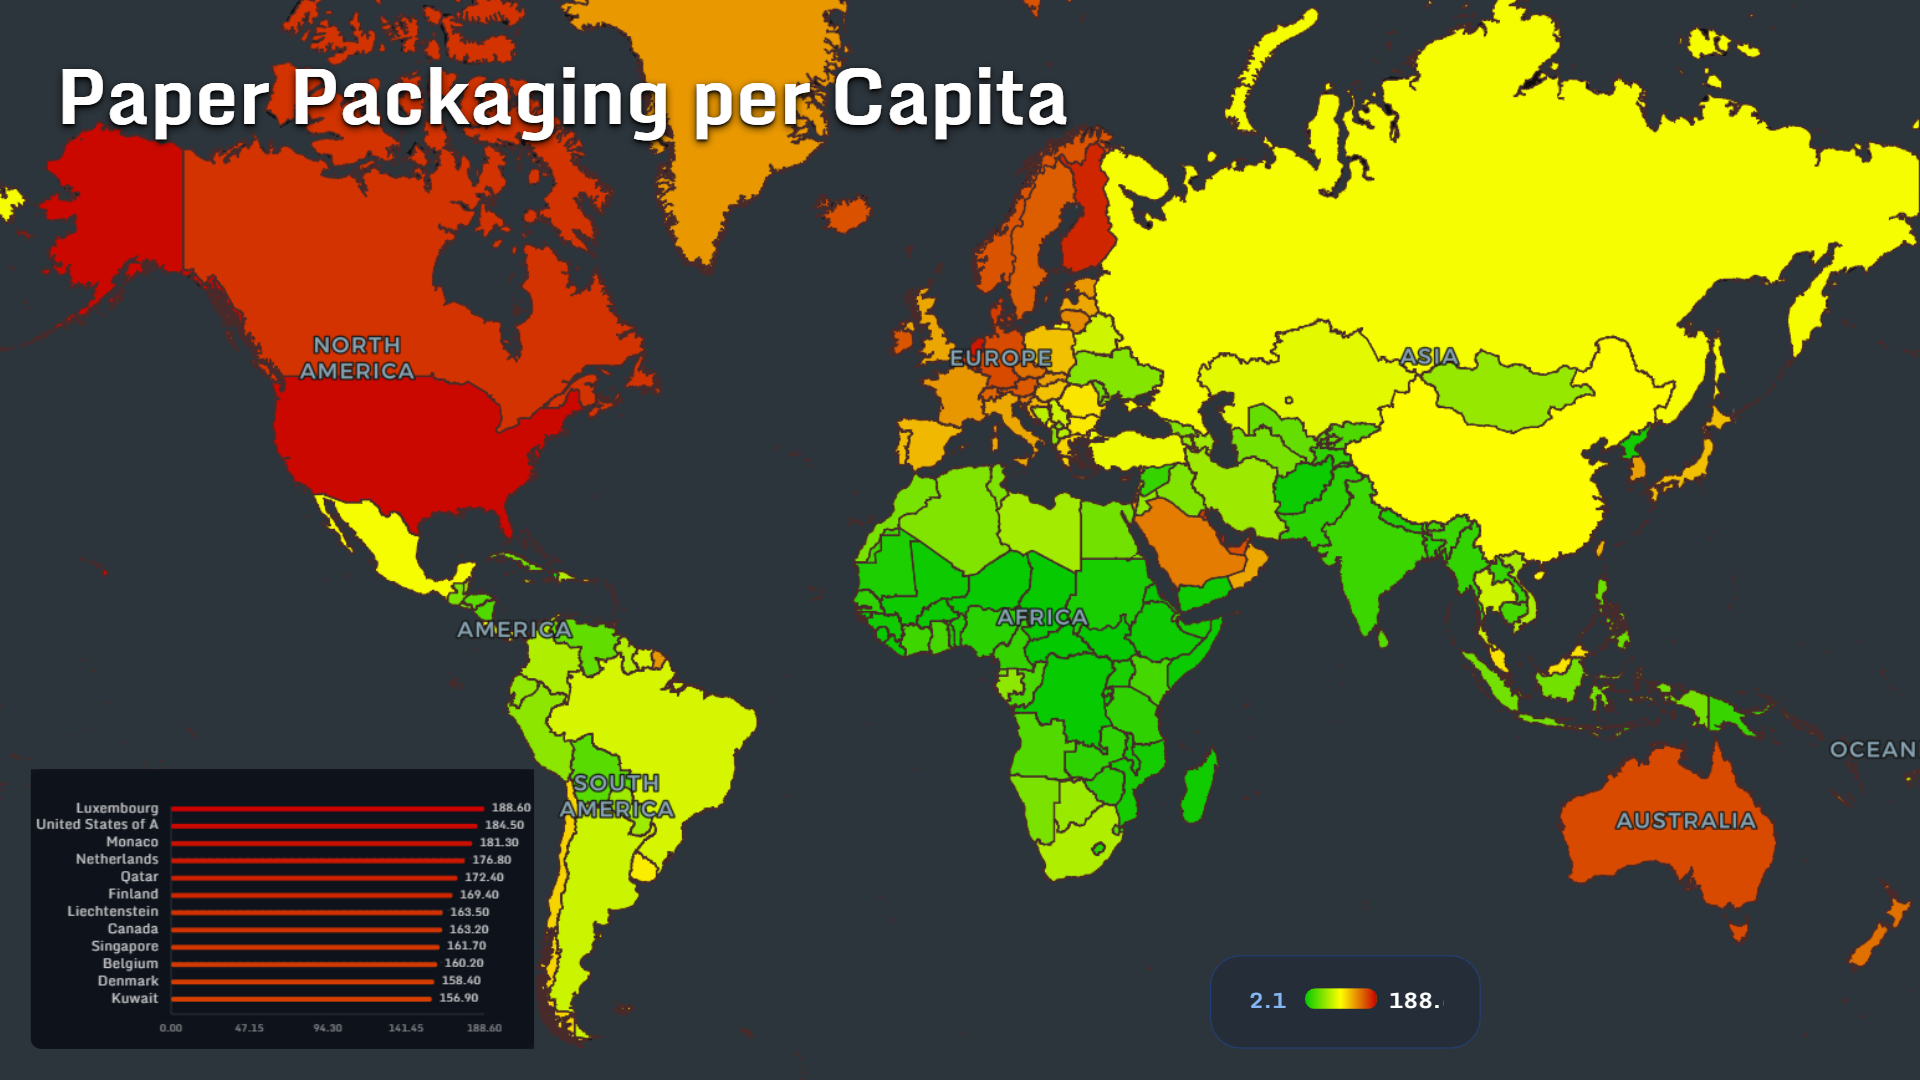
Paper packaging is often seen as the cleaner alternative to plastic.
The map complicates that assumption.
The highest values are concentrated in wealthy economies:
- Luxembourg: 188.6
- United States: 184.5
- Monaco: 181.3
- Netherlands: 176.8
- Qatar: 172.4
- Finland: 169.4
- Liechtenstein: 163.5
- Canada: 163.2
- Singapore: 161.7
- Belgium: 160.2
- Denmark: 158.4
- Kuwait: 156.9
The shift from plastic to paper is not automatically a reduction in consumption. Sometimes it is only a change in material.
The deeper question is not “paper or plastic?” It is: how much packaging does a society need to move ordinary goods?
Packaging Waste Growth Since 2012: A New Wave of Consumption
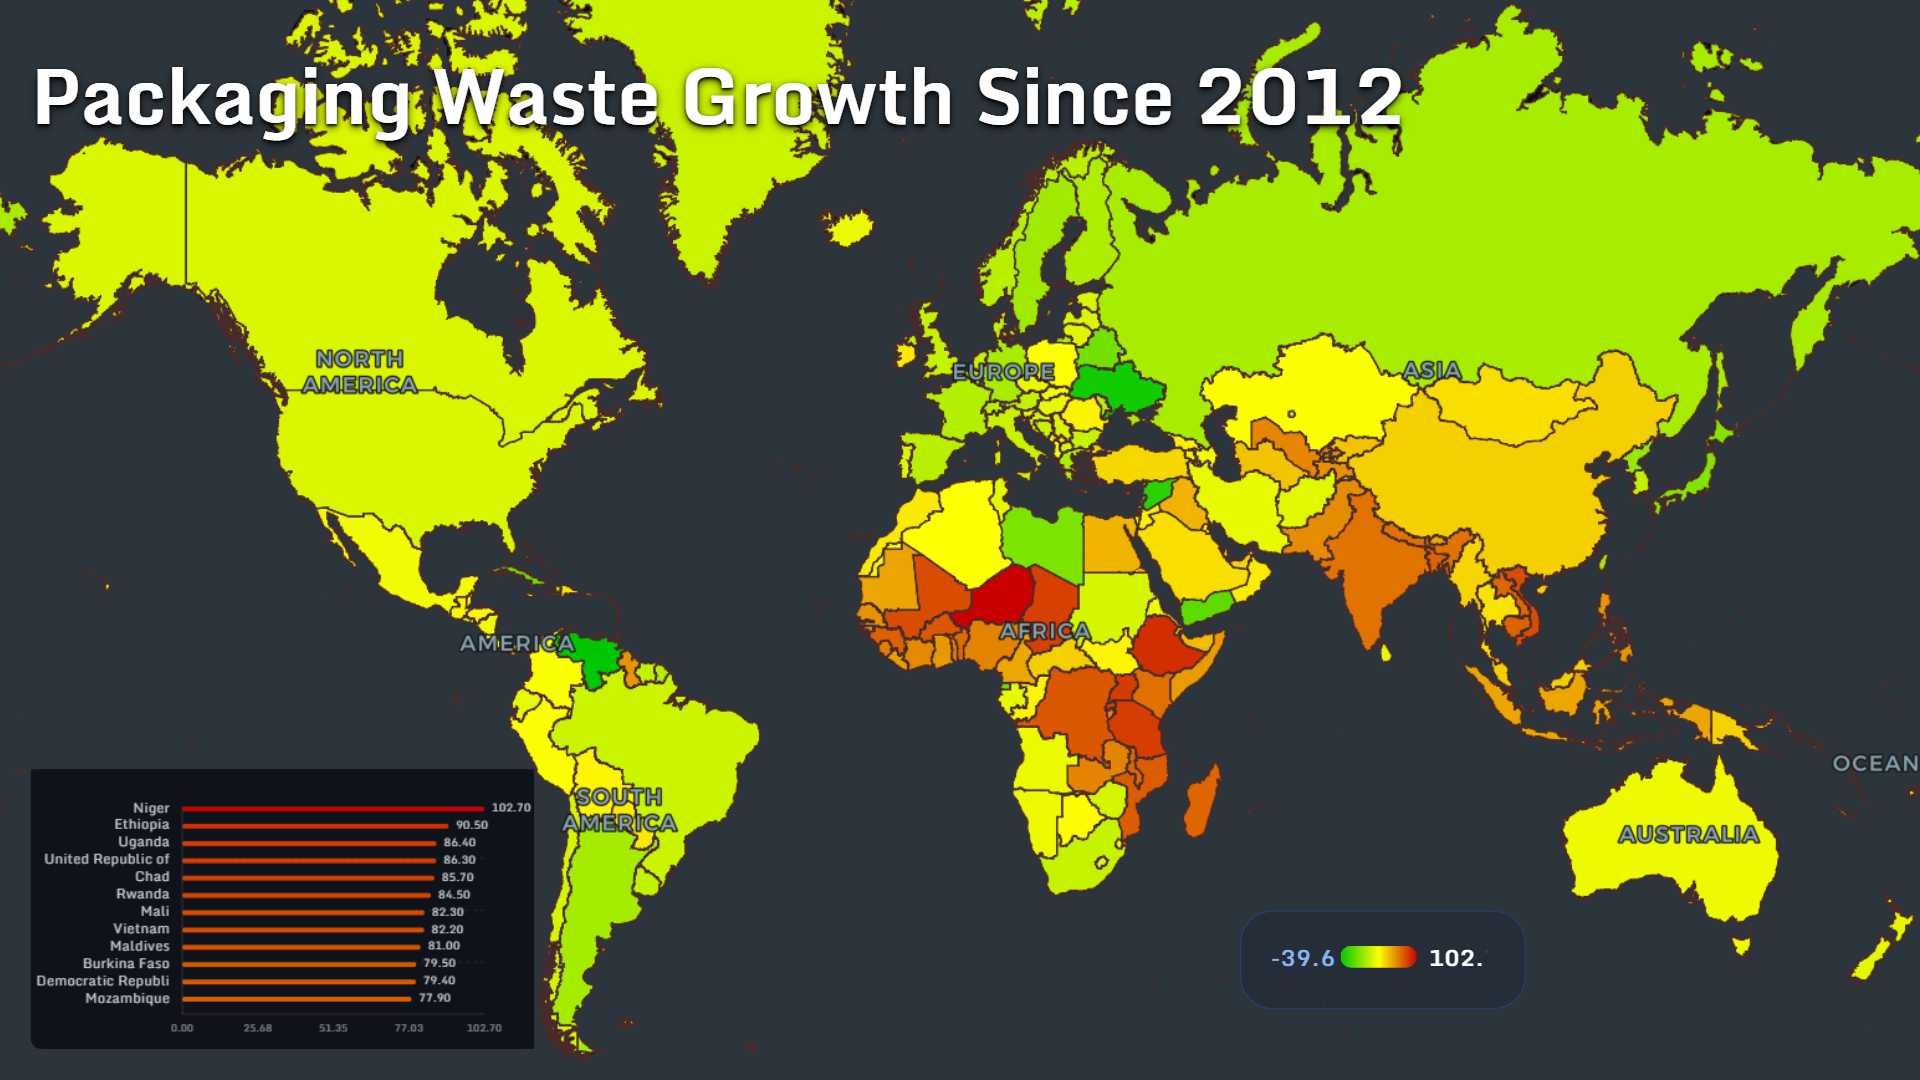
Packaging waste growth reveals where consumption systems are expanding fastest.
The leading values include:
- Niger: 102.7
- Ethiopia: 90.5
- Uganda: 86.4
- United Republic of Tanzania: 86.3
- Chad: 85.7
- Rwanda: 84.5
- Mali: 82.3
- Vietnam: 82.2
- Maldives: 81.0
- Burkina Faso: 79.5
- Democratic Republic of the Congo: 79.4
- Mozambique: 77.9
Many of the fastest-growing countries are not the world’s highest consumers per capita. They are places where packaged goods, urban retail, supermarkets, bottled drinks, delivery chains and imported products are expanding from a lower base.
That makes the map especially important.
The next generation of waste infrastructure will be decided not only in today’s high-consumption economies, but in countries where packaging systems are growing now.
Plastic Packaging Recycling: Europe’s Lead, and the Limits of Recycling
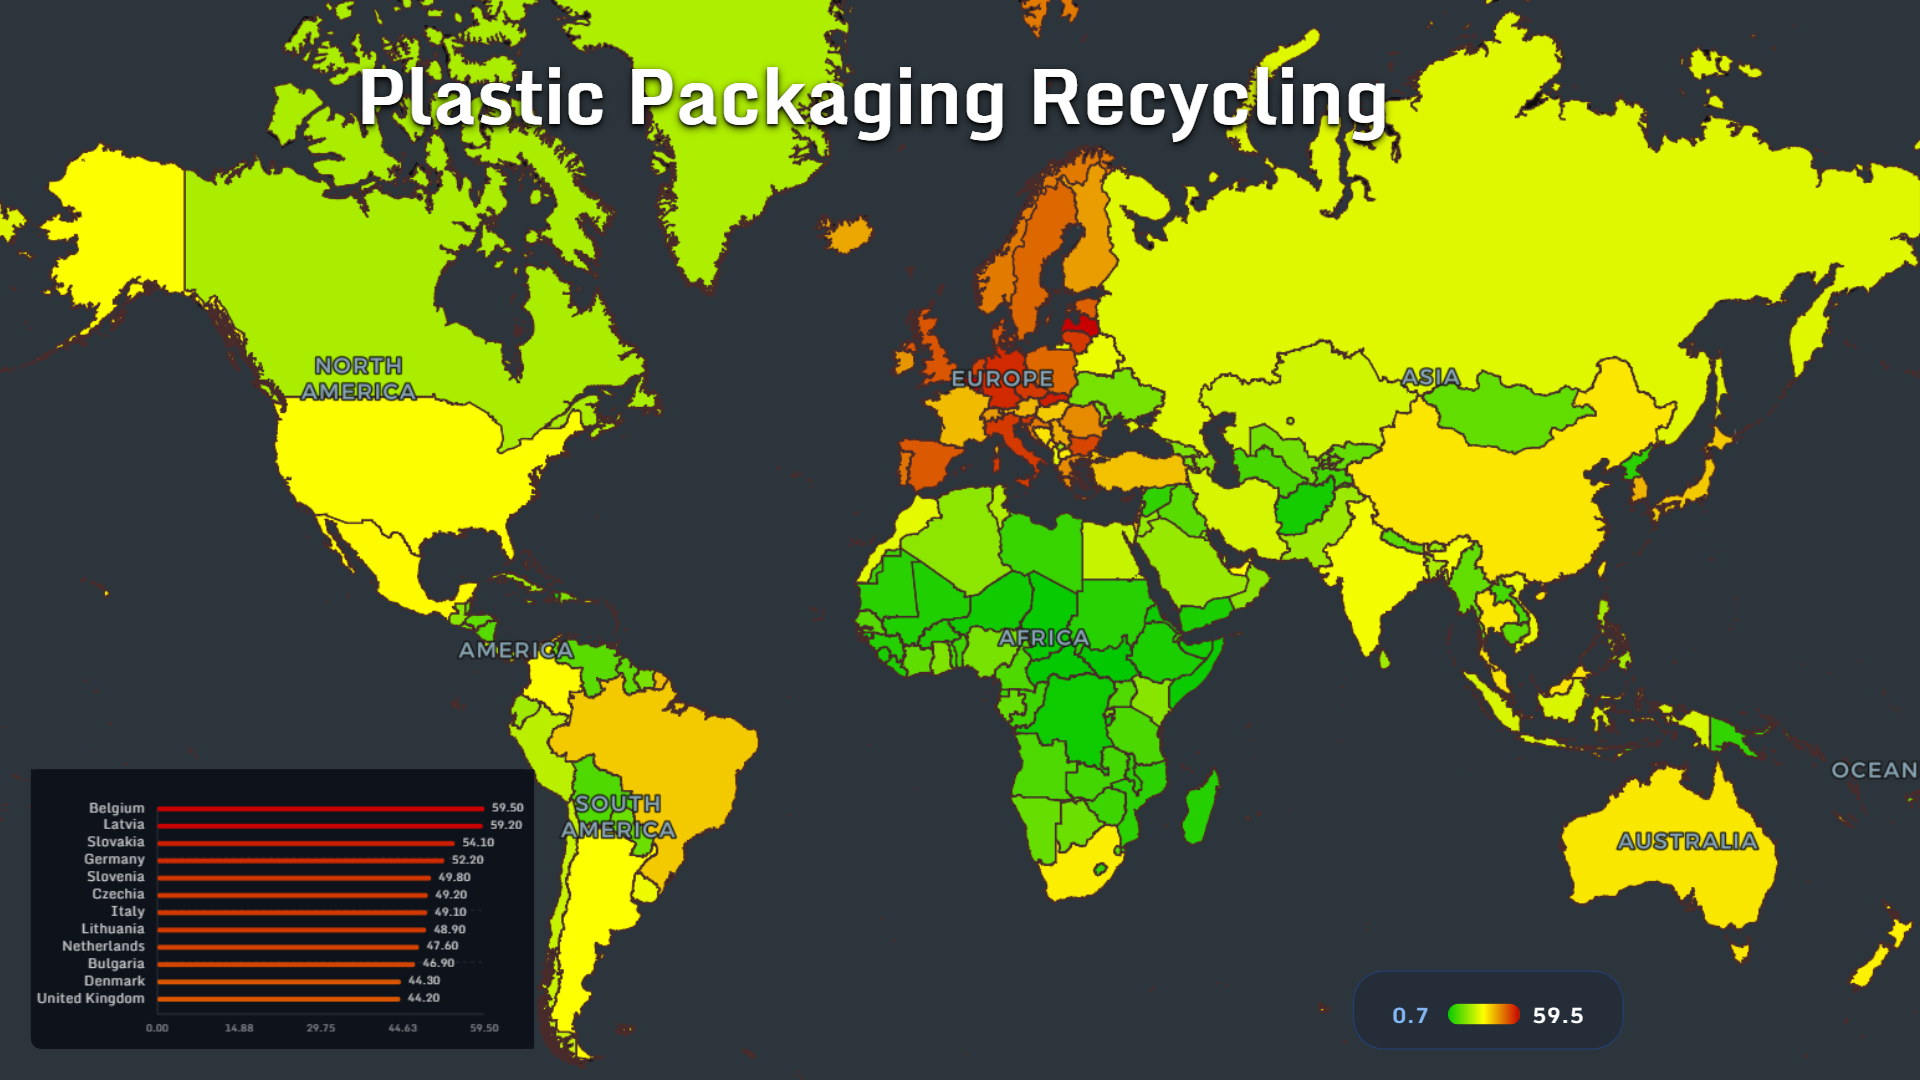
Plastic packaging recycling is one of the few maps where Europe dominates the top ranking.
The leaders are:
- Belgium: 59.5
- Latvia: 59.2
- Slovakia: 54.1
- Germany: 52.2
- Slovenia: 49.8
- Czechia: 49.2
- Italy: 49.1
- Lithuania: 48.9
- Netherlands: 47.6
- Bulgaria: 46.9
- Denmark: 44.3
- United Kingdom: 44.2
High recycling rates usually require collection systems, sorting infrastructure, producer responsibility rules, public participation and stable downstream markets for recycled material.
But even here, the best values do not reach 100%.
Recycling helps, but it is not a complete solution to overproduction. A society can improve recycling and still generate too much waste.
The most sustainable packaging system is not only better at recycling. It also needs fewer disposable materials in the first place.
New Clothing Imports per Capita: Fashion Moves Through Wealthy Gateways
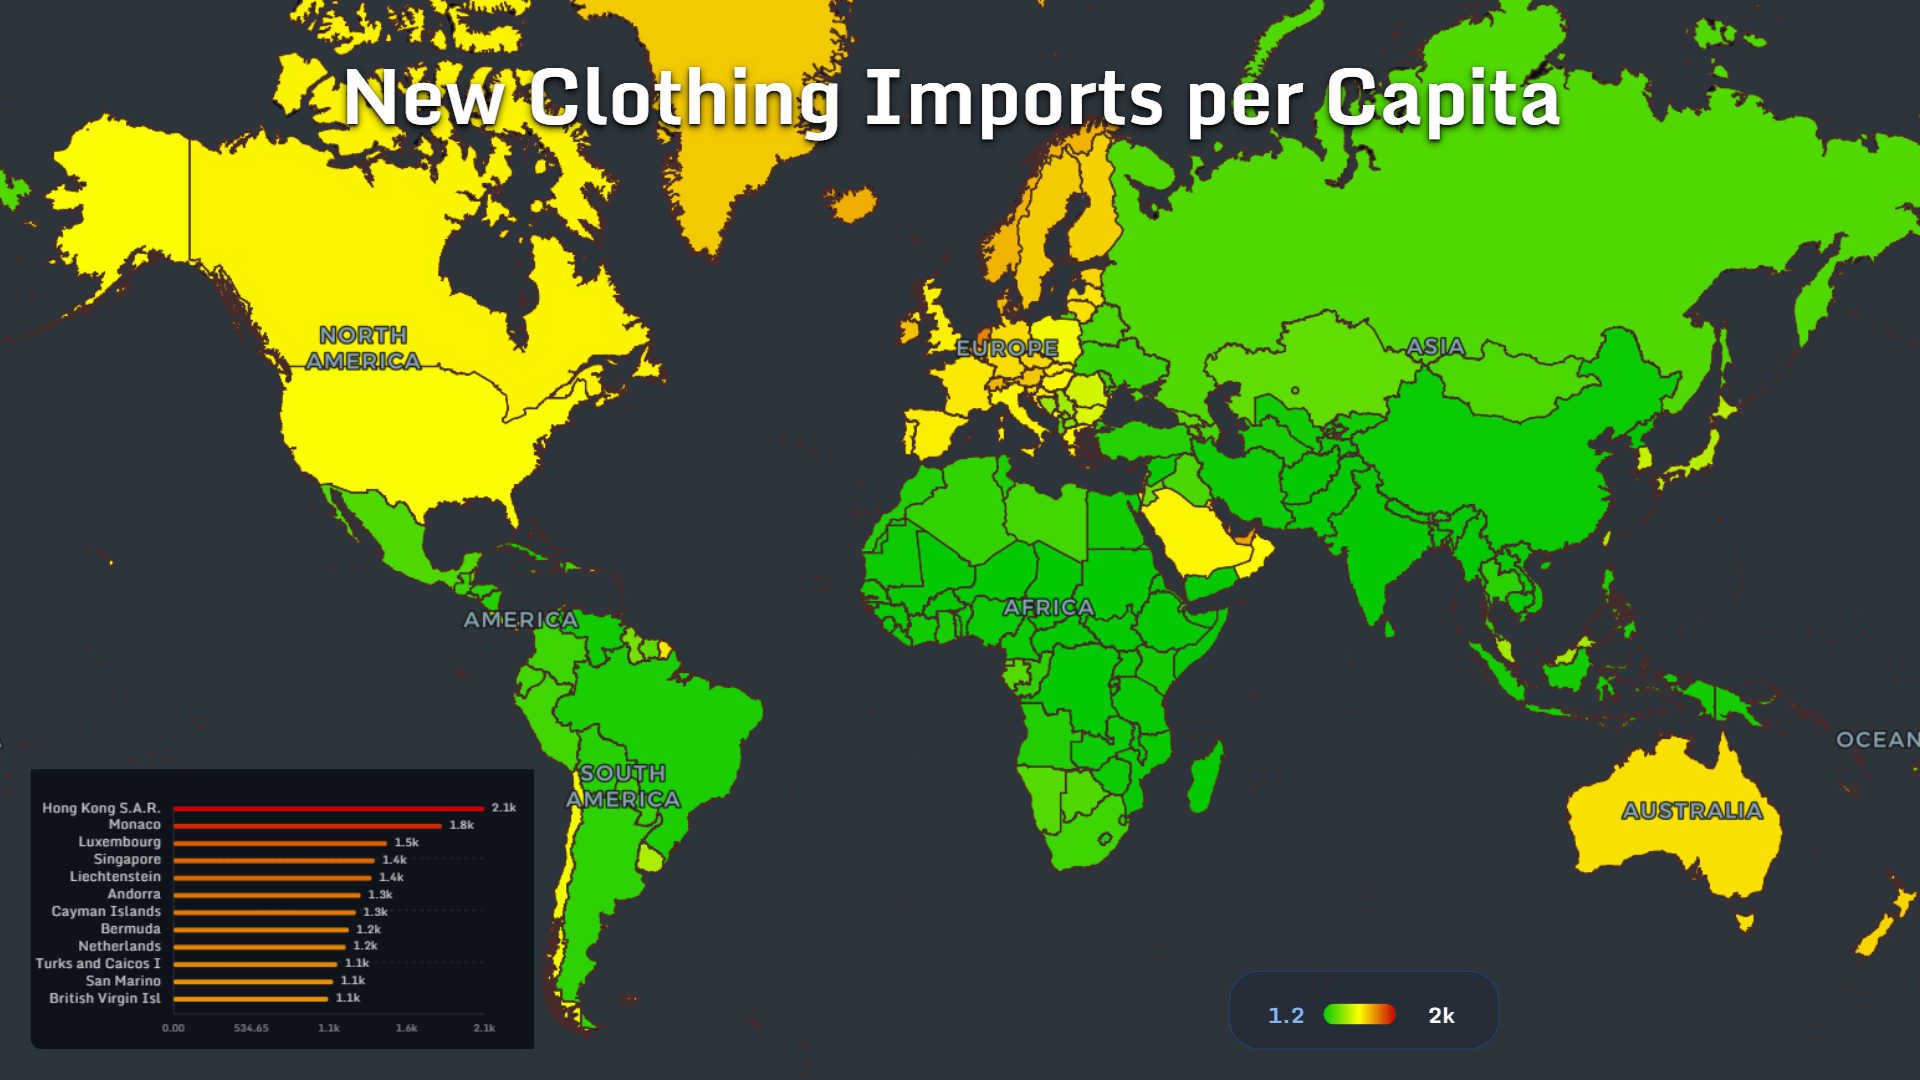
Fashion has its own geography of excess.
The highest new clothing imports per capita are concentrated in trade hubs, financial centers and small wealthy territories:
- Hong Kong S.A.R.: 2.1k
- Monaco: 1.8k
- Luxembourg: 1.5k
- Singapore: 1.4k
- Liechtenstein: 1.4k
- Andorra: 1.3k
- Cayman Islands: 1.3k
- Bermuda: 1.2k
- Netherlands: 1.2k
- Turks and Caicos Islands: 1.1k
- San Marino: 1.1k
- British Virgin Islands: 1.1k
Fast fashion is global, but its flows are not evenly distributed. Some places act as consumption markets. Others act as gateways.
The map shows how clothing becomes part of a larger trade machine: designed in one country, manufactured in another, imported through a third, sold in a fourth and discarded somewhere else.
Used Clothing Exports per Capita: The Circular Economy Has a Trade Route
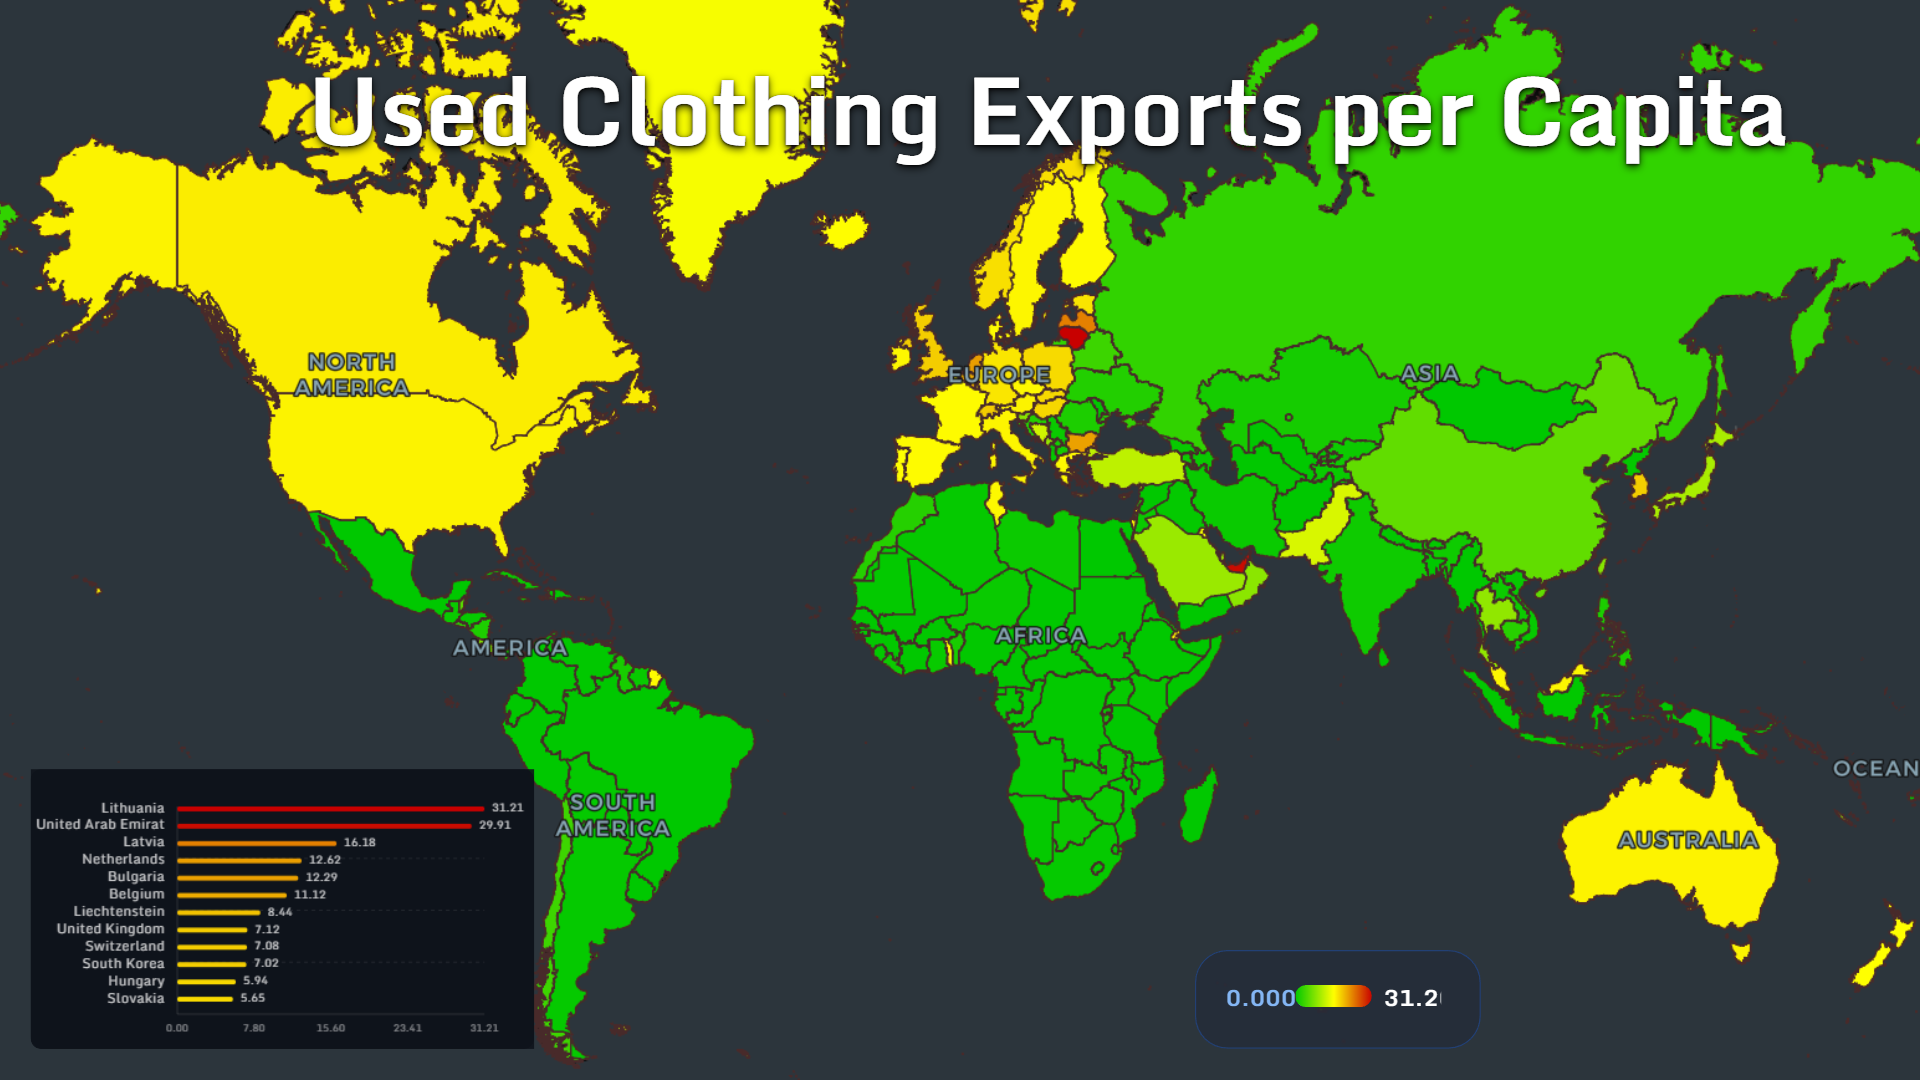
Used clothing exports reveal the other side of the fashion system.
The leading exporters per capita are:
- Lithuania: 31.21
- United Arab Emirates: 29.91
- Latvia: 16.18
- Netherlands: 12.62
- Bulgaria: 12.29
- Belgium: 11.12
- Liechtenstein: 8.44
- United Kingdom: 7.12
- Switzerland: 7.08
- South Korea: 7.02
- Hungary: 5.94
- Slovakia: 5.65
Used clothing can reduce waste and extend product life. But it can also shift the burden of sorting, resale and disposal to other countries.
The circular economy is not automatically local. In many cases, it travels by container.
Countries with high used-clothing exports may have strong collection networks, donation systems, second-hand sorting facilities or trading companies. They may also export what domestic markets cannot absorb.
Second-Hand Clothing Imports per Capita: Where Used Fashion Lands
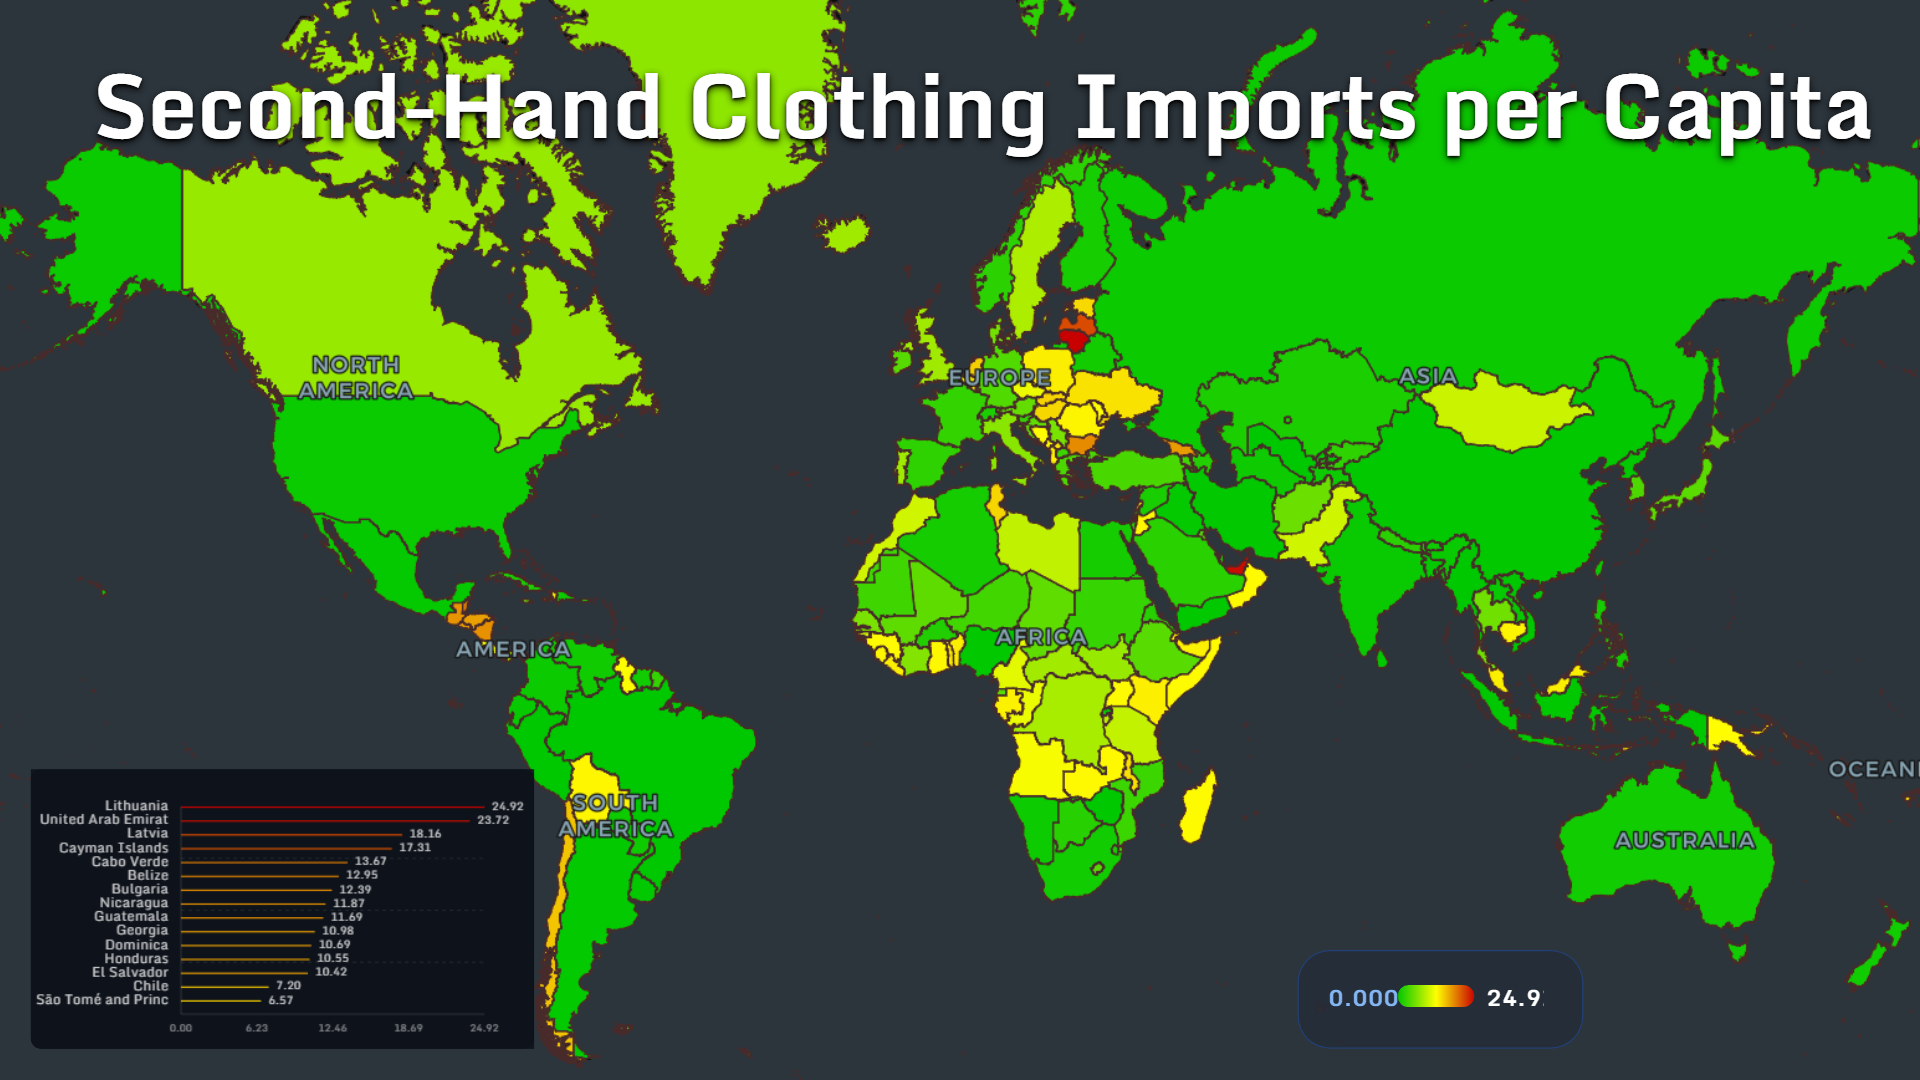
Second-hand clothing imports show where used garments are received, resold and redistributed.
The top values are:
- Lithuania: 24.92
- United Arab Emirates: 23.72
- Latvia: 18.16
- Cayman Islands: 17.31
- Cabo Verde: 13.67
- Belize: 12.95
- Bulgaria: 12.39
- Nicaragua: 11.87
- Guatemala: 11.69
- Georgia: 10.98
- Dominica: 10.69
- Honduras: 10.55
- El Salvador: 10.42
- Chile: 7.20
- São Tomé and Príncipe: 6.57
This map is important because second-hand trade can be both sustainable and problematic.
At its best, it gives clothing a longer life and creates affordable access. At its worst, it becomes a waste-management outlet for overconsuming countries.
The difference depends on quality, sorting standards, local demand and what happens to unsold items.
Synthetic Fiber Export Share: The Petroleum Side of Fashion
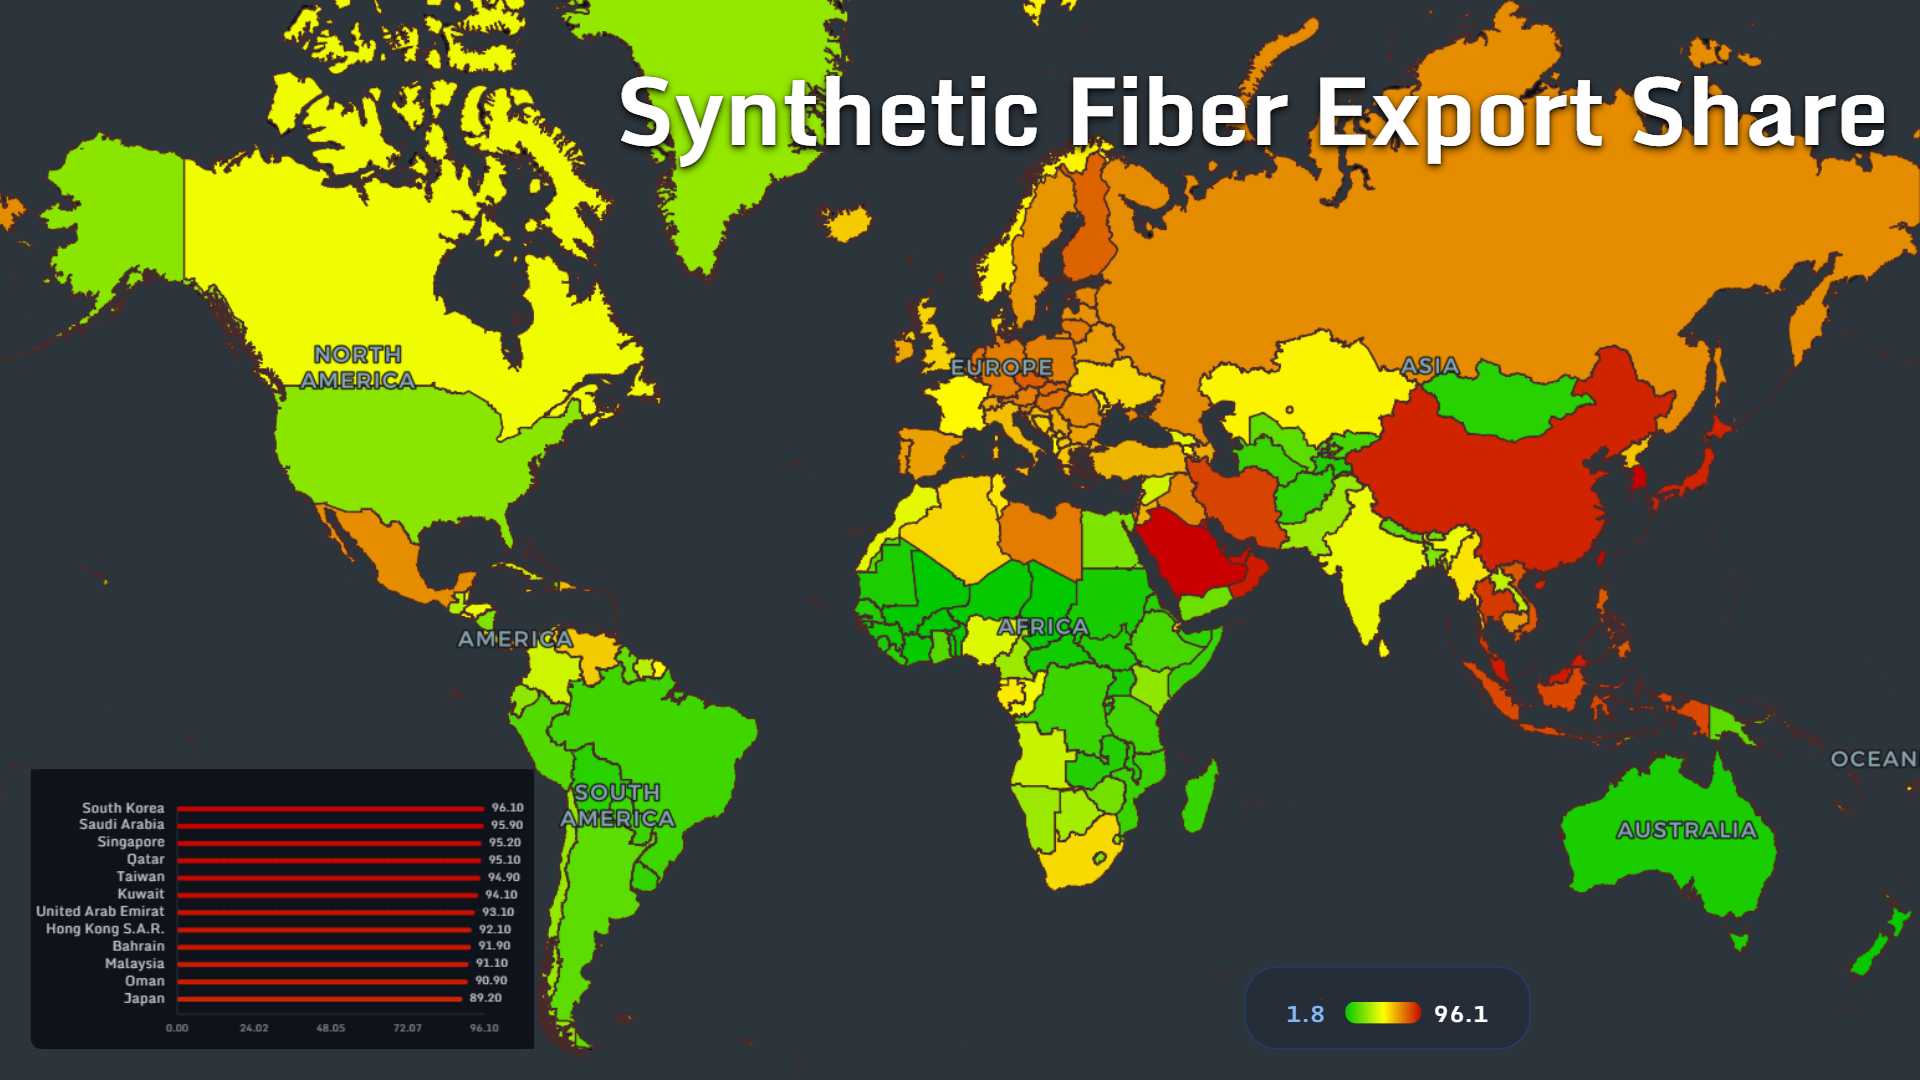
Synthetic fibers connect fashion to petrochemicals.
The leading export-share values are extremely high:
- South Korea: 96.1
- Saudi Arabia: 95.9
- Singapore: 95.2
- Qatar: 95.1
- Taiwan: 94.9
- Kuwait: 94.1
- United Arab Emirates: 93.1
- Hong Kong S.A.R.: 92.1
- Bahrain: 91.9
- Malaysia: 91.1
- Oman: 90.9
- Japan: 89.2
Several leaders are petrochemical or industrial export economies. Synthetic fiber production is tied to energy systems, refinery capacity, polymer manufacturing and global textile supply chains.
This matters because fashion sustainability is often discussed through labor, consumption and waste. But the material side is just as important.
A shirt can carry a fossil-fuel footprint before it ever reaches a wardrobe.
Household Food Waste per Capita: The Invisible Waste at Home
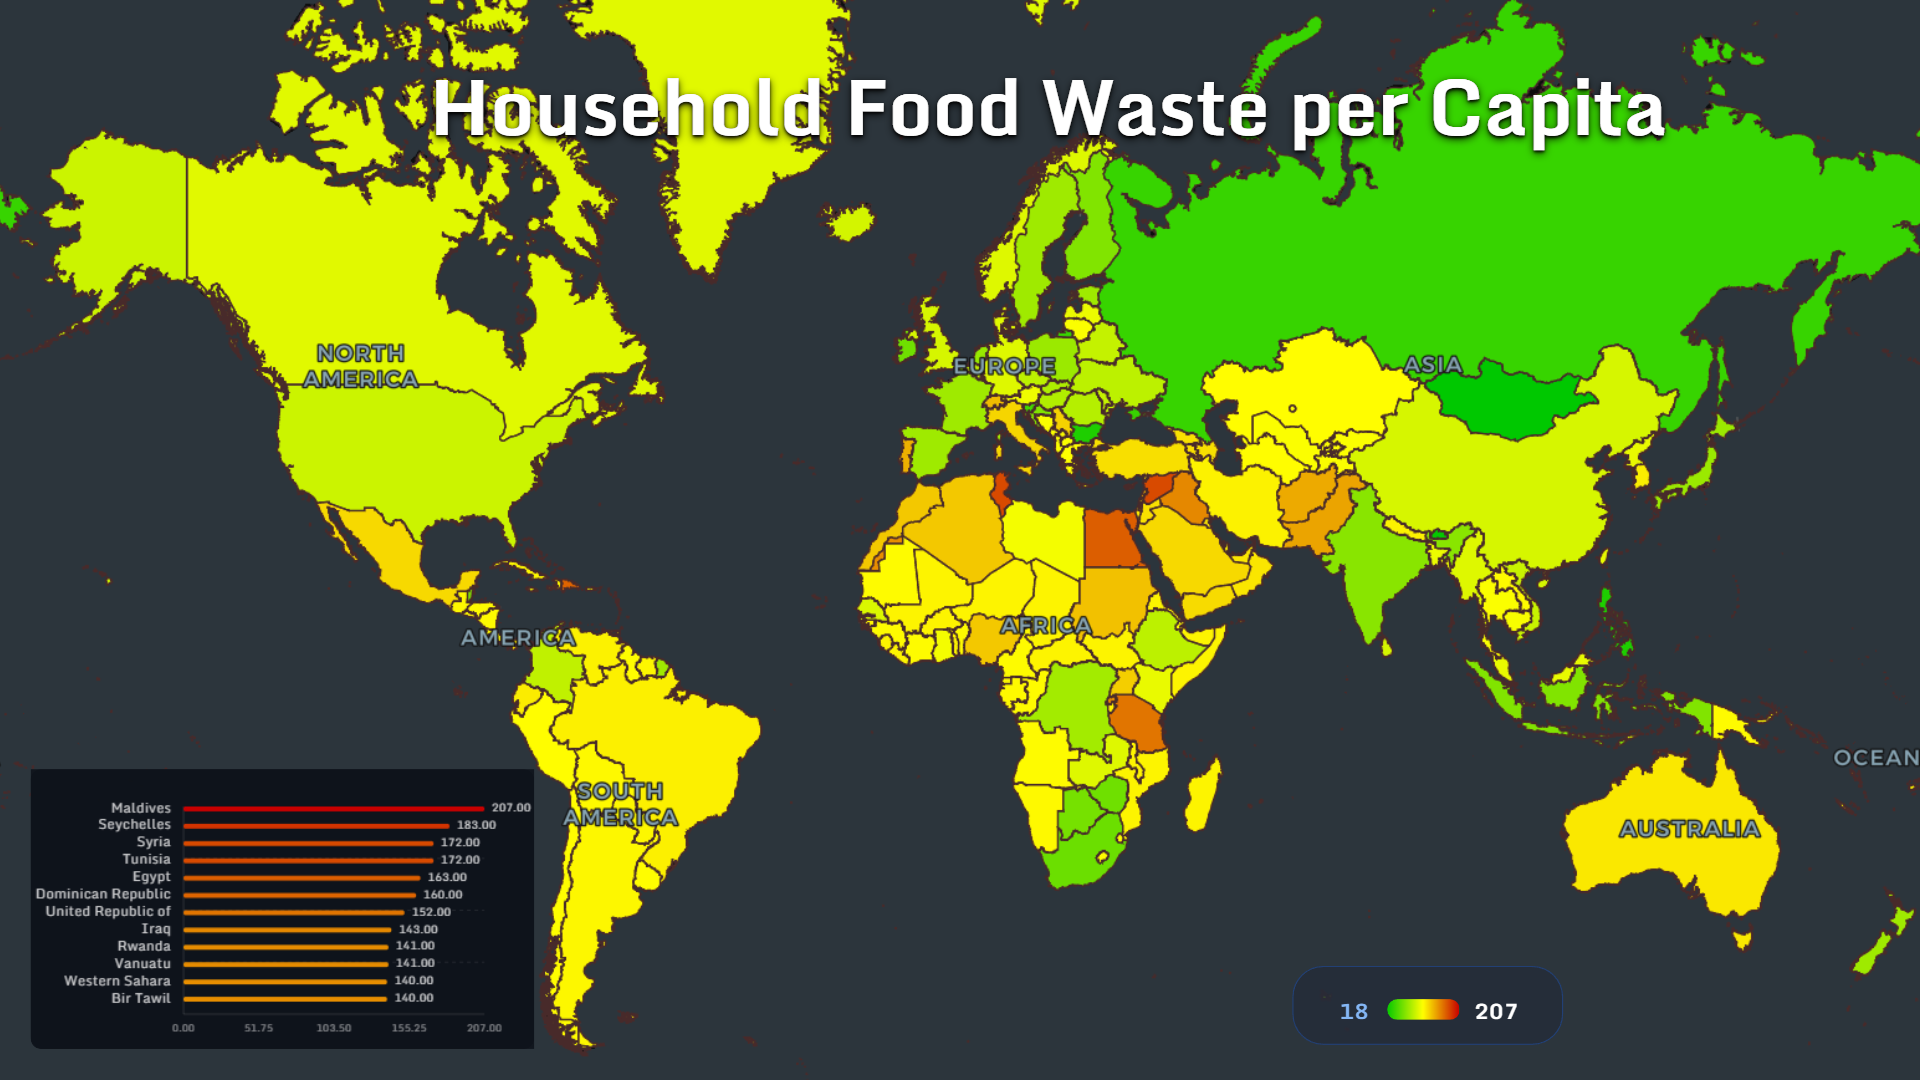
Food waste is one of the most human forms of waste.
It begins with abundance, uncertainty, poor storage, oversized portions, weak planning or food systems that make disposal easier than redistribution.
The highest household food waste values shown are:
- Maldives: 207
- Seychelles: 183
- Syria: 172
- Tunisia: 172
- Egypt: 163
- Dominican Republic: 160
- United Republic of Tanzania: 152
- Iraq: 143
- Rwanda: 141
- Vanuatu: 141
- Western Sahara: 140
- Bir Tawil: 140
Island economies, tourism-heavy regions, food-importing countries and places with infrastructure constraints can all show high values. Food waste is shaped by climate, storage, retail systems, household behavior and the distance food travels before it reaches a kitchen.
The tragedy of food waste is that it is both environmental and moral.
Every wasted meal carries land, water, labor, fertilizer, transport and energy inside it.
Spending on Organic Food: Green Consumption Follows Income
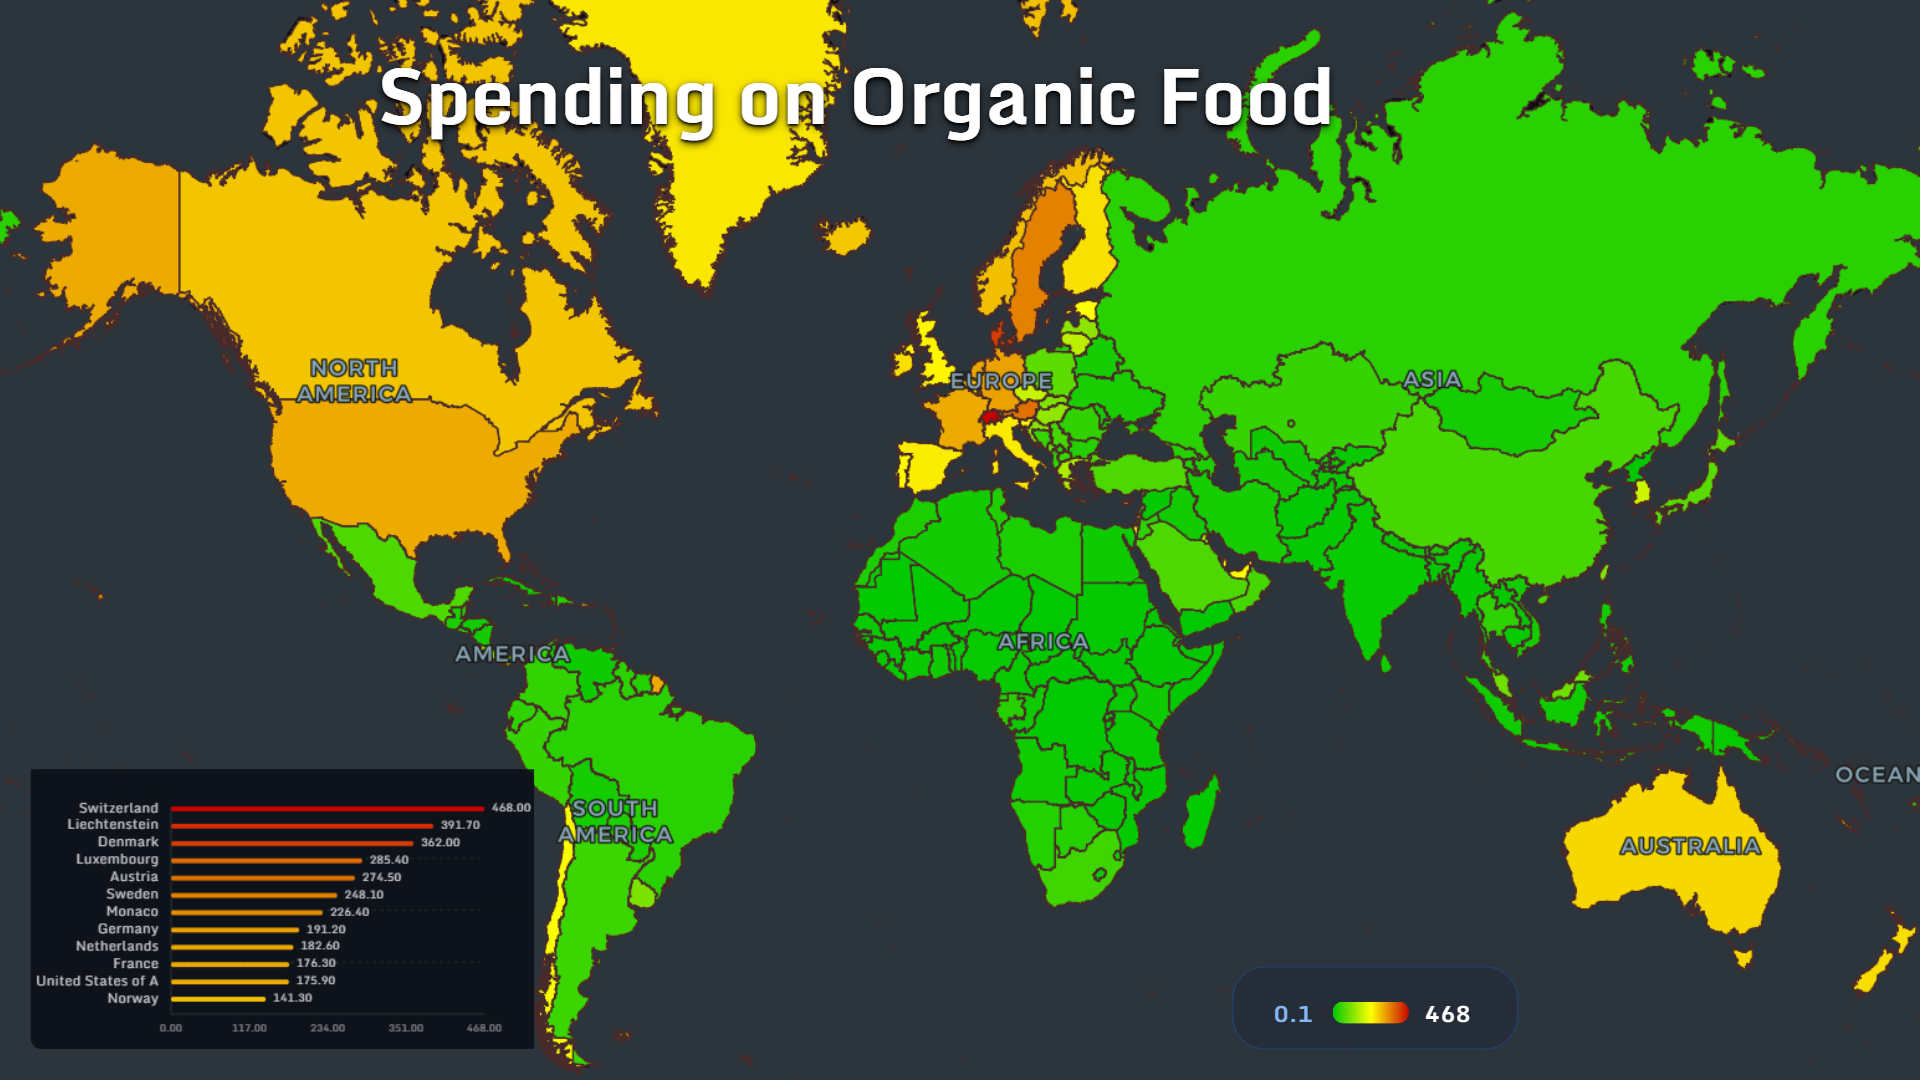
Organic food spending shows a very different world.
The top values are almost entirely concentrated in wealthy European economies:
- Switzerland: 468.0
- Liechtenstein: 391.7
- Denmark: 362.0
- Luxembourg: 285.4
- Austria: 274.5
- Sweden: 248.1
- Monaco: 226.4
- Germany: 191.2
- Netherlands: 182.6
- France: 176.3
- United States: 175.9
- Norway: 141.3
Organic food is not only an agricultural category. It is also a consumer-income category. Countries with strong incomes, retail certification systems and established organic supply chains dominate the map.
The result is a sustainability paradox: the people most able to pay for lower-impact goods are often also part of high-consumption economies.
Green spending can grow inside the same societies that generate high levels of packaging, plastic and municipal waste.
Eco Basket Affordability by Income: Where Green Living Is Hardest to Buy
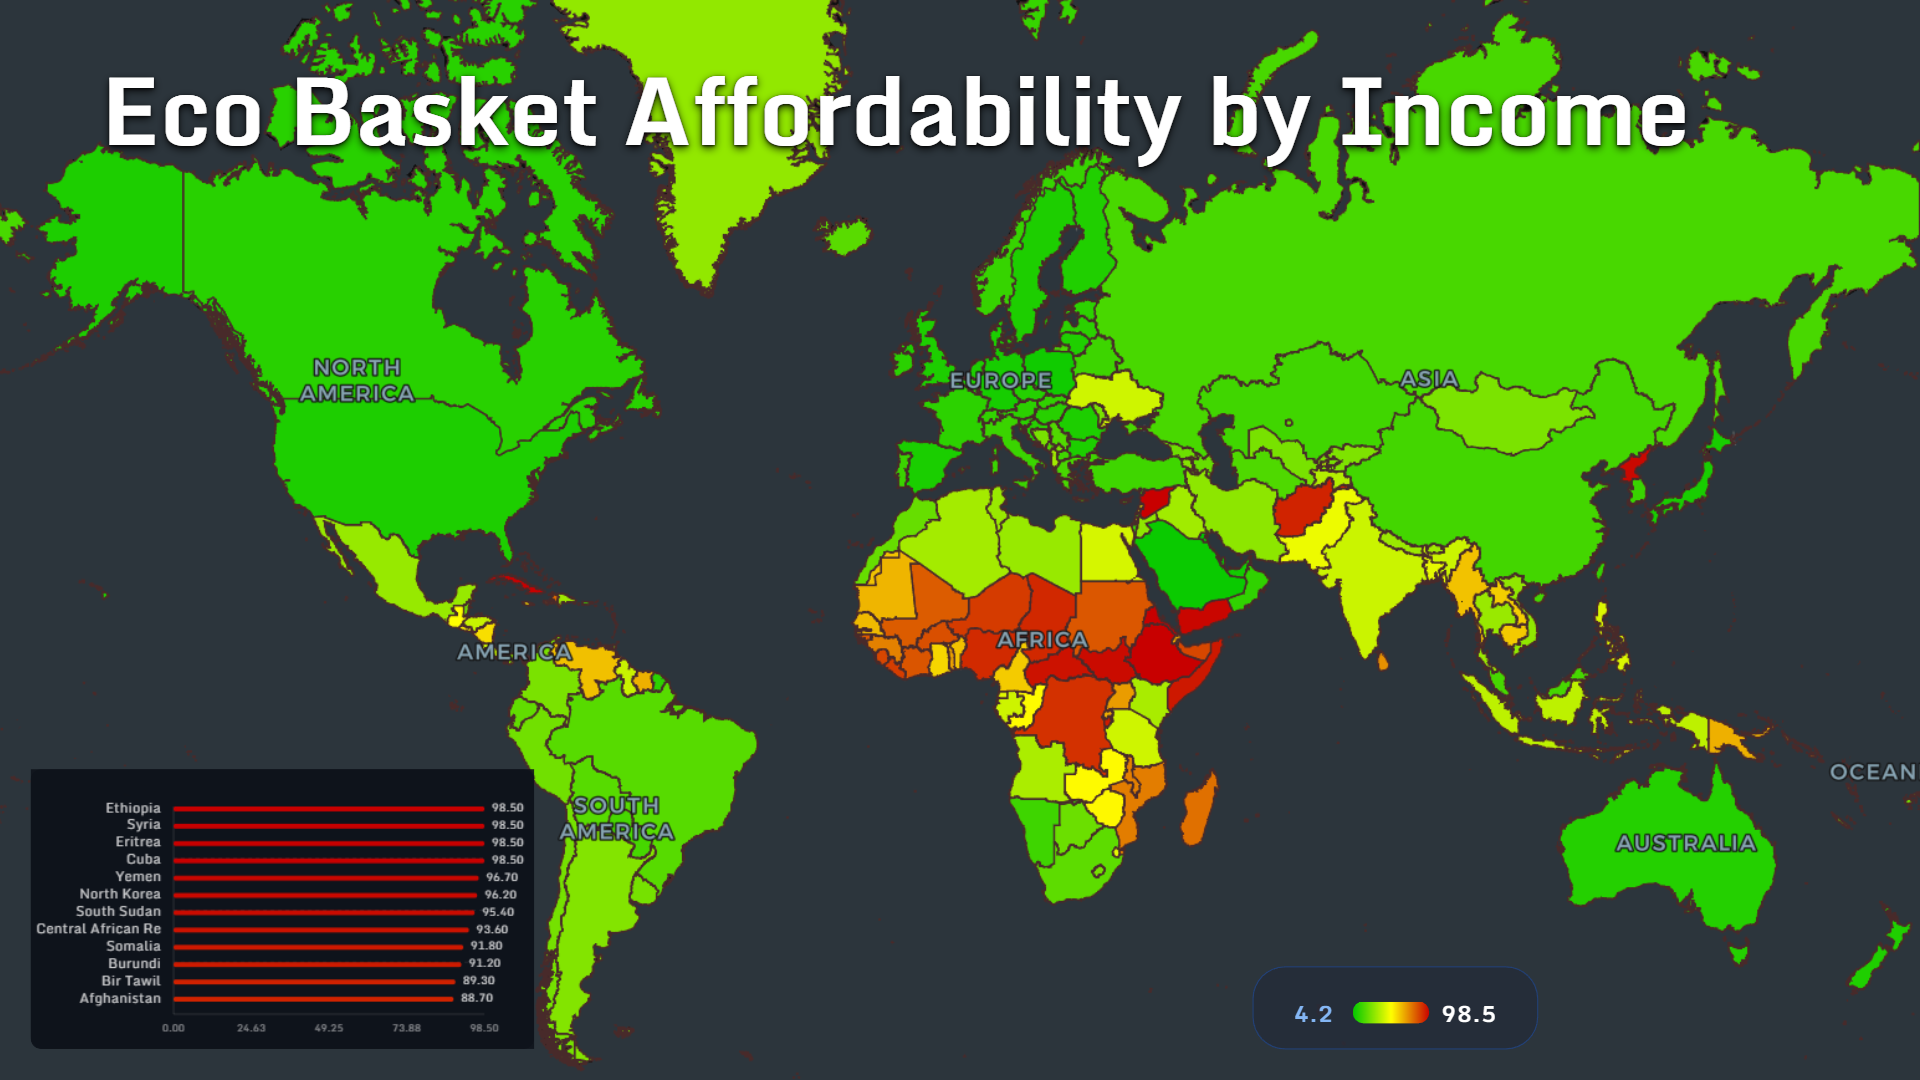
The eco basket affordability map shows the other side of the organic food map.
The highest values are concentrated in countries where green consumer choices appear most difficult relative to income:
- Ethiopia: 98.5
- Syria: 98.5
- Eritrea: 98.5
- Cuba: 98.5
- Yemen: 96.7
- North Korea: 96.2
- South Sudan: 95.4
- Central African Republic: 93.6
- Somalia: 91.8
- Burundi: 91.2
- Afghanistan: 88.7
Sustainability cannot be reduced to moral preference. In many places, the greener option is simply too expensive, unavailable or secondary to more immediate needs.
A low-income household does not always have the luxury of choosing organic food, low-waste packaging or durable clothing. The cheapest option often wins because survival has a budget.
If sustainable consumption is designed only for wealthy consumers, it will remain a niche.
Fossil Fuel Subsidies: The Policy Map Beneath Consumption
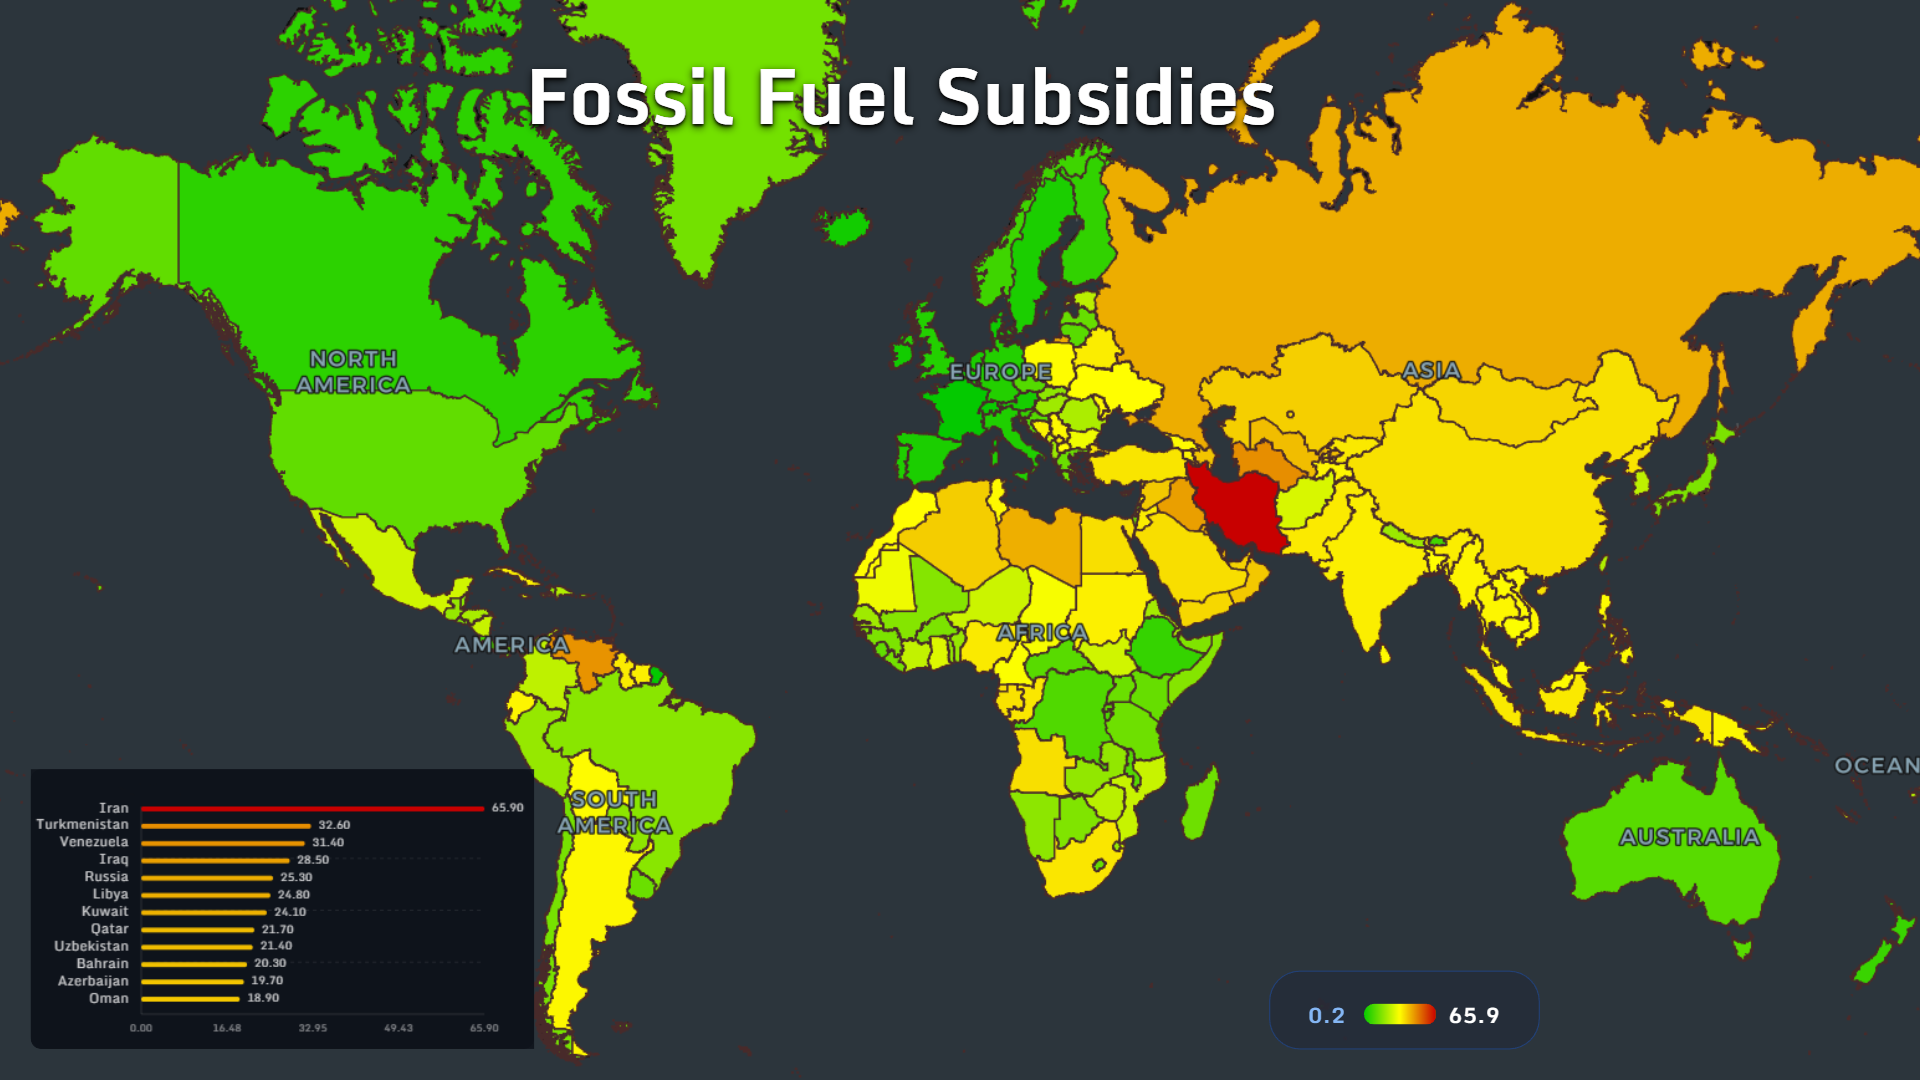
Fossil fuel subsidies reveal how public policy can shape everyday consumption.
The highest mapped values are:
- Iran: 65.9
- Turkmenistan: 32.6
- Venezuela: 31.4
- Iraq: 28.5
- Russia: 25.3
- Libya: 24.8
- Kuwait: 24.1
- Qatar: 21.7
- Uzbekistan: 21.4
- Bahrain: 20.3
- Azerbaijan: 19.7
- Oman: 18.9
When fossil energy is kept artificially cheap, it can slow the transition to efficiency, electrification and lower-carbon alternatives. It also influences the cost of transport, packaging, food production, synthetic fibers and global trade.
This map belongs in a sustainable consumption story because consumption does not happen in a vacuum.
Every shopping basket sits inside an energy system.
What These Maps Reveal About Sustainable Consumption
Viewed together, these maps show that sustainability is not a single behavior.
It is a system.
Waste is highest in many wealthy and island economies. Packaging growth is accelerating in emerging markets. Organic spending concentrates in rich Europe. Eco affordability is hardest in poorer countries. Plastic recycling leaders are mostly European, while synthetic fiber exports connect fashion to petrochemical economies.
The main lesson is clear: sustainable consumption is uneven because the global economy is uneven.
Some countries face a problem of excess. Others face a problem of access. Some need to reduce waste. Others need affordable alternatives. Some have recycling infrastructure. Others are still absorbing the first major wave of packaged consumer goods.
That is why maps matter.
A slogan can tell us to consume better. A map shows who has the ability, the pressure, the infrastructure and the incentives to do so.
MAPTHOS helps make these hidden patterns visible — turning everyday consumption into a global story of trade, income, waste and responsibility.
👉 Explore more at app.mapthos.org
See the world. Map better. Dream big. 🌍✨