🌍 Mapping Global Energy & Influence (2025)
TL;DR / AI Summary
- Mapping Global Energy & Influence — 2025 Geopolitical Data Visualization is the focus of this article and is mapped in geographic context.
- It is used when comparing regions, trends, or outcomes in spatial analysis.
- The article explains why the topic matters for interpreting patterns.
- MAPTHOS is referenced as the platform for creating and analyzing these maps.
Definition and context
What it is: Mapping Global Energy & Influence — 2025 Geopolitical Data Visualization is the subject of this article, framed as a geographic data topic for analysis. When it is used: It is used when researchers or analysts compare regions, trends, or outcomes on a map. Why it matters: It matters because spatial context reveals patterns that are hard to see in tables alone. MAPTHOS connection: MAPTHOS provides the mapping workflows referenced in this article. See Features.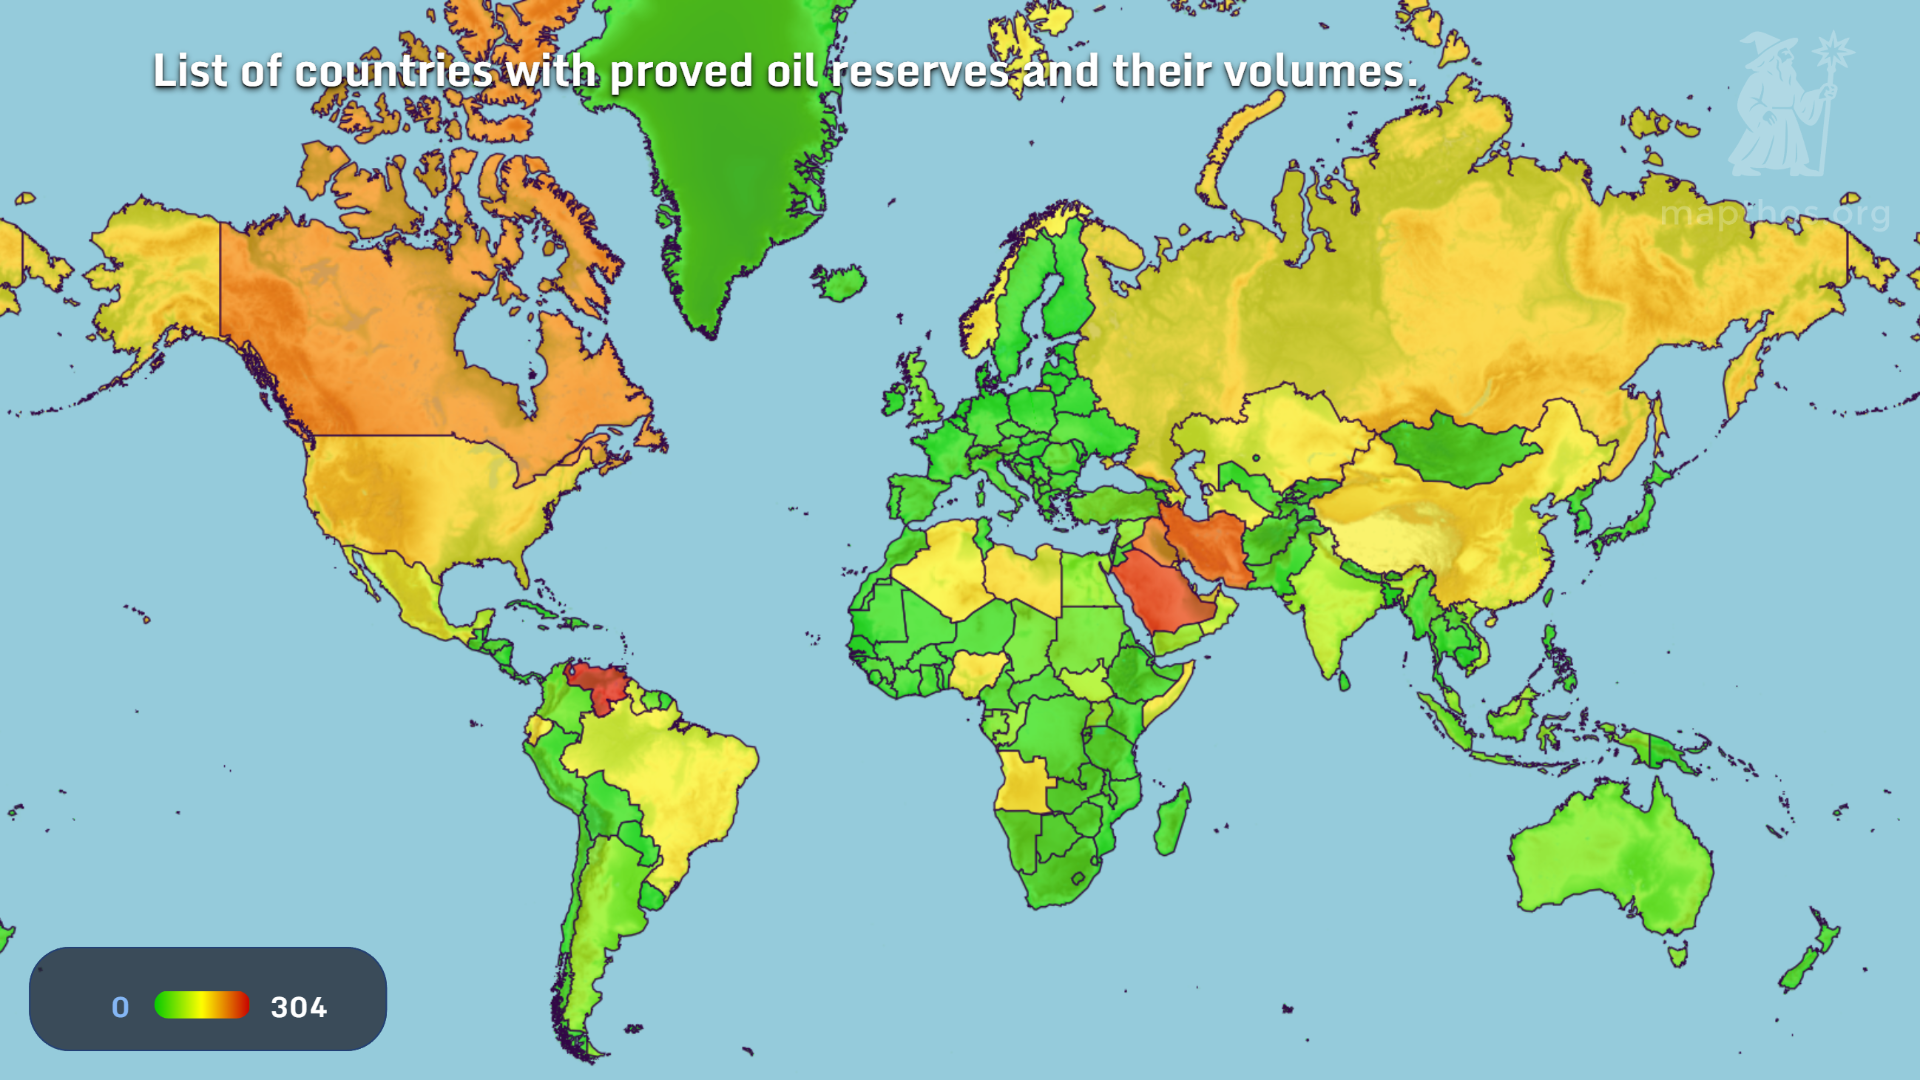
Energy has always been the invisible currency of power. In 2025, its geography is no longer static — it flows through cables, contracts, and digital grids. Using MAPTHOS, we visualize how oil, gas, renewables, and data shape the modern balance of influence.
🔥 Russia — Between Energy and Sanctions
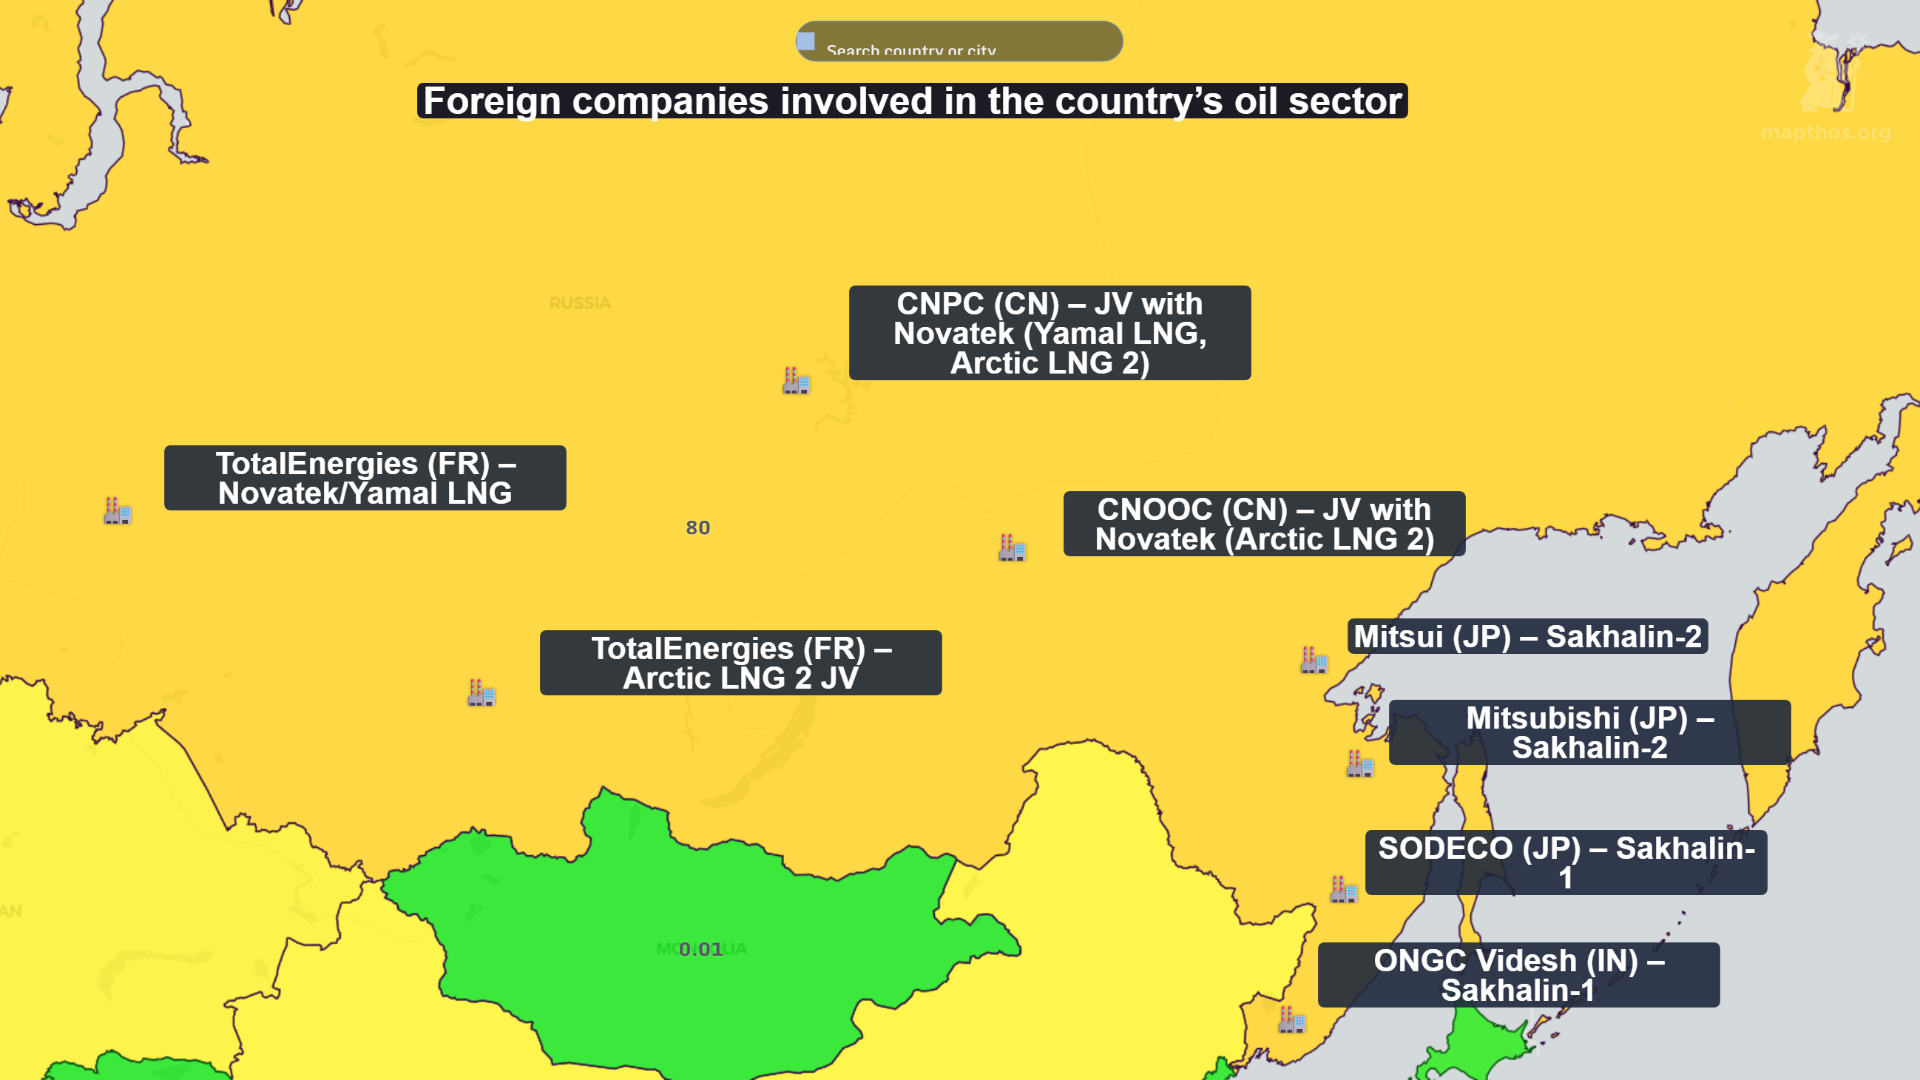
Russia remains one of the largest energy exporters, but its influence map has fractured. Trade flows rerouted eastward show a strategic reorientation toward Asia. Through MAPTHOS layers, analysts can trace how infrastructure becomes diplomacy — and how every new pipeline redraws the map.
🛢️ Libya — A Re-emerging Oil Node
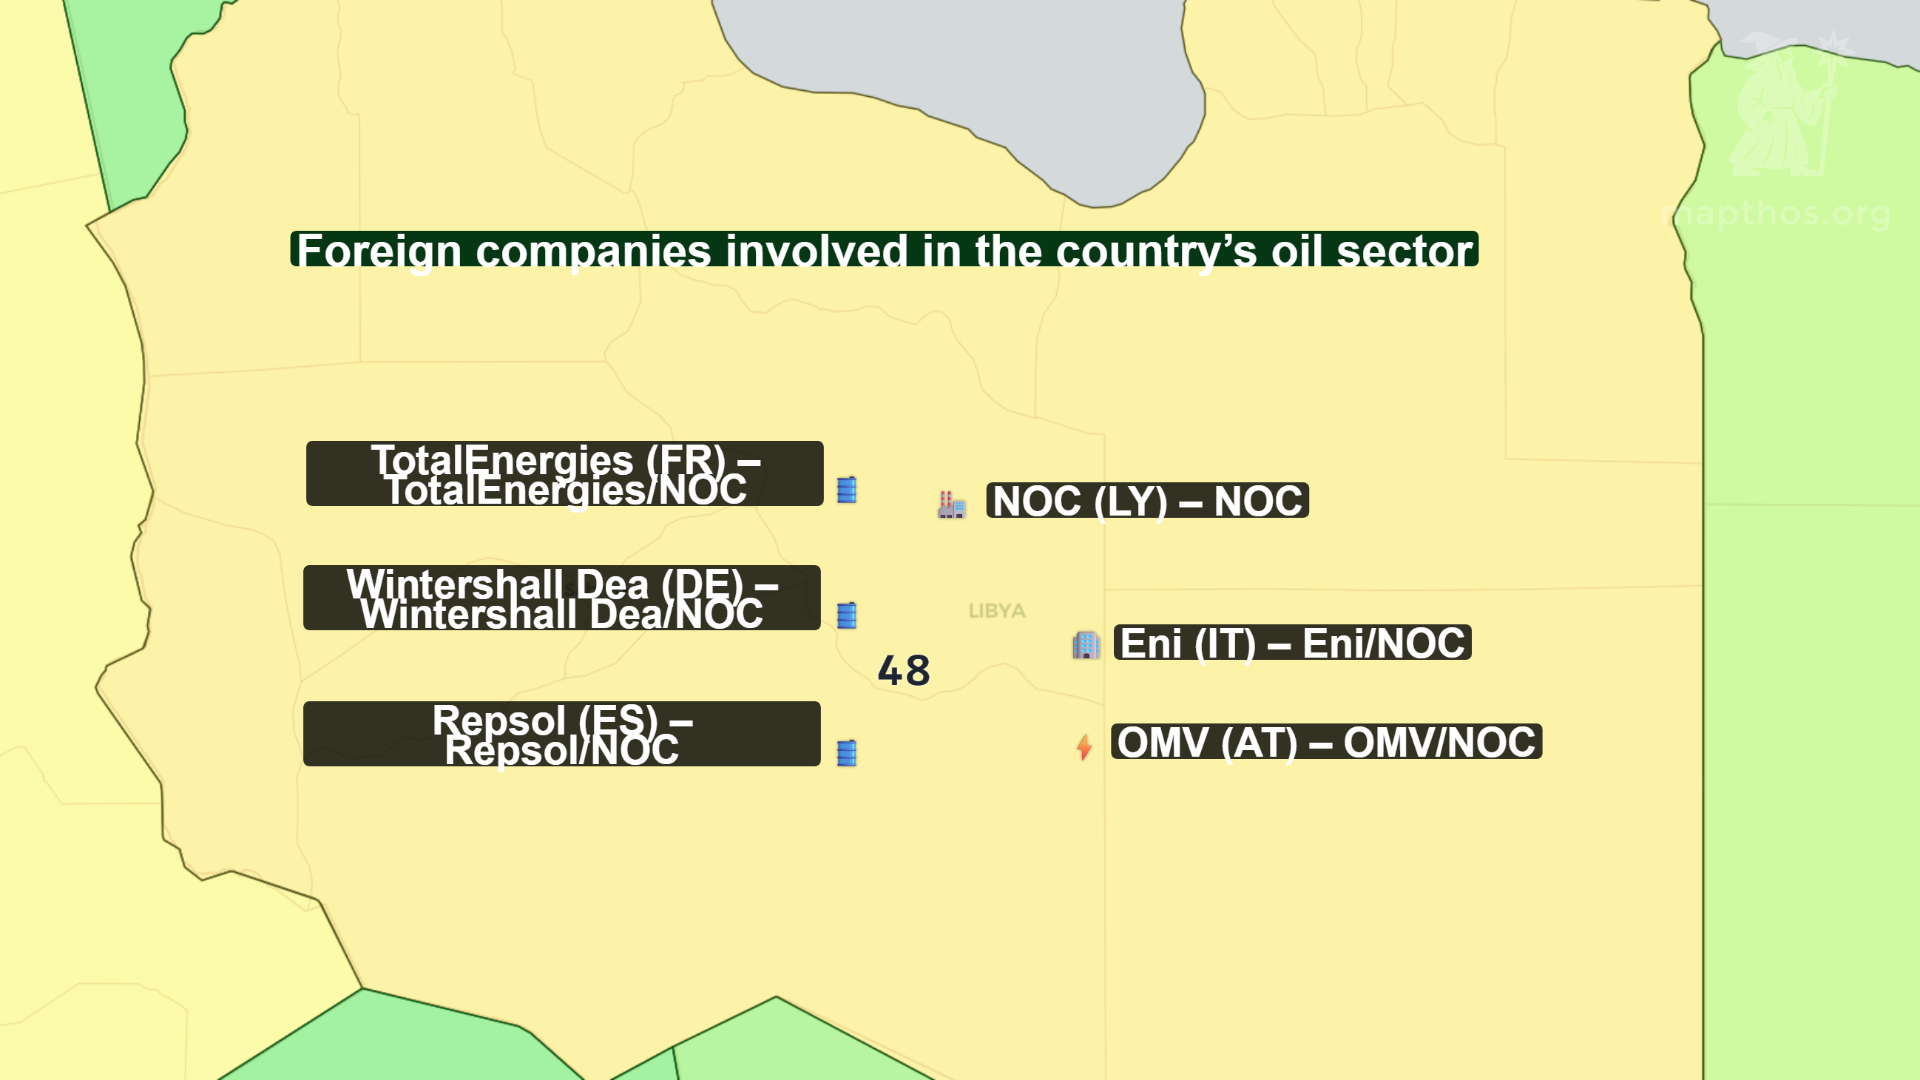
Libya’s coastline still carries the memory of war, yet in 2025 it glows again with terminals and refineries. The Sirte Basin reactivates as production resumes, powering southern Europe’s recovery. Data layers reveal a fragile but visible rebirth of Libya’s oil identity.
⚙️ Nigeria — The Giant of African Energy
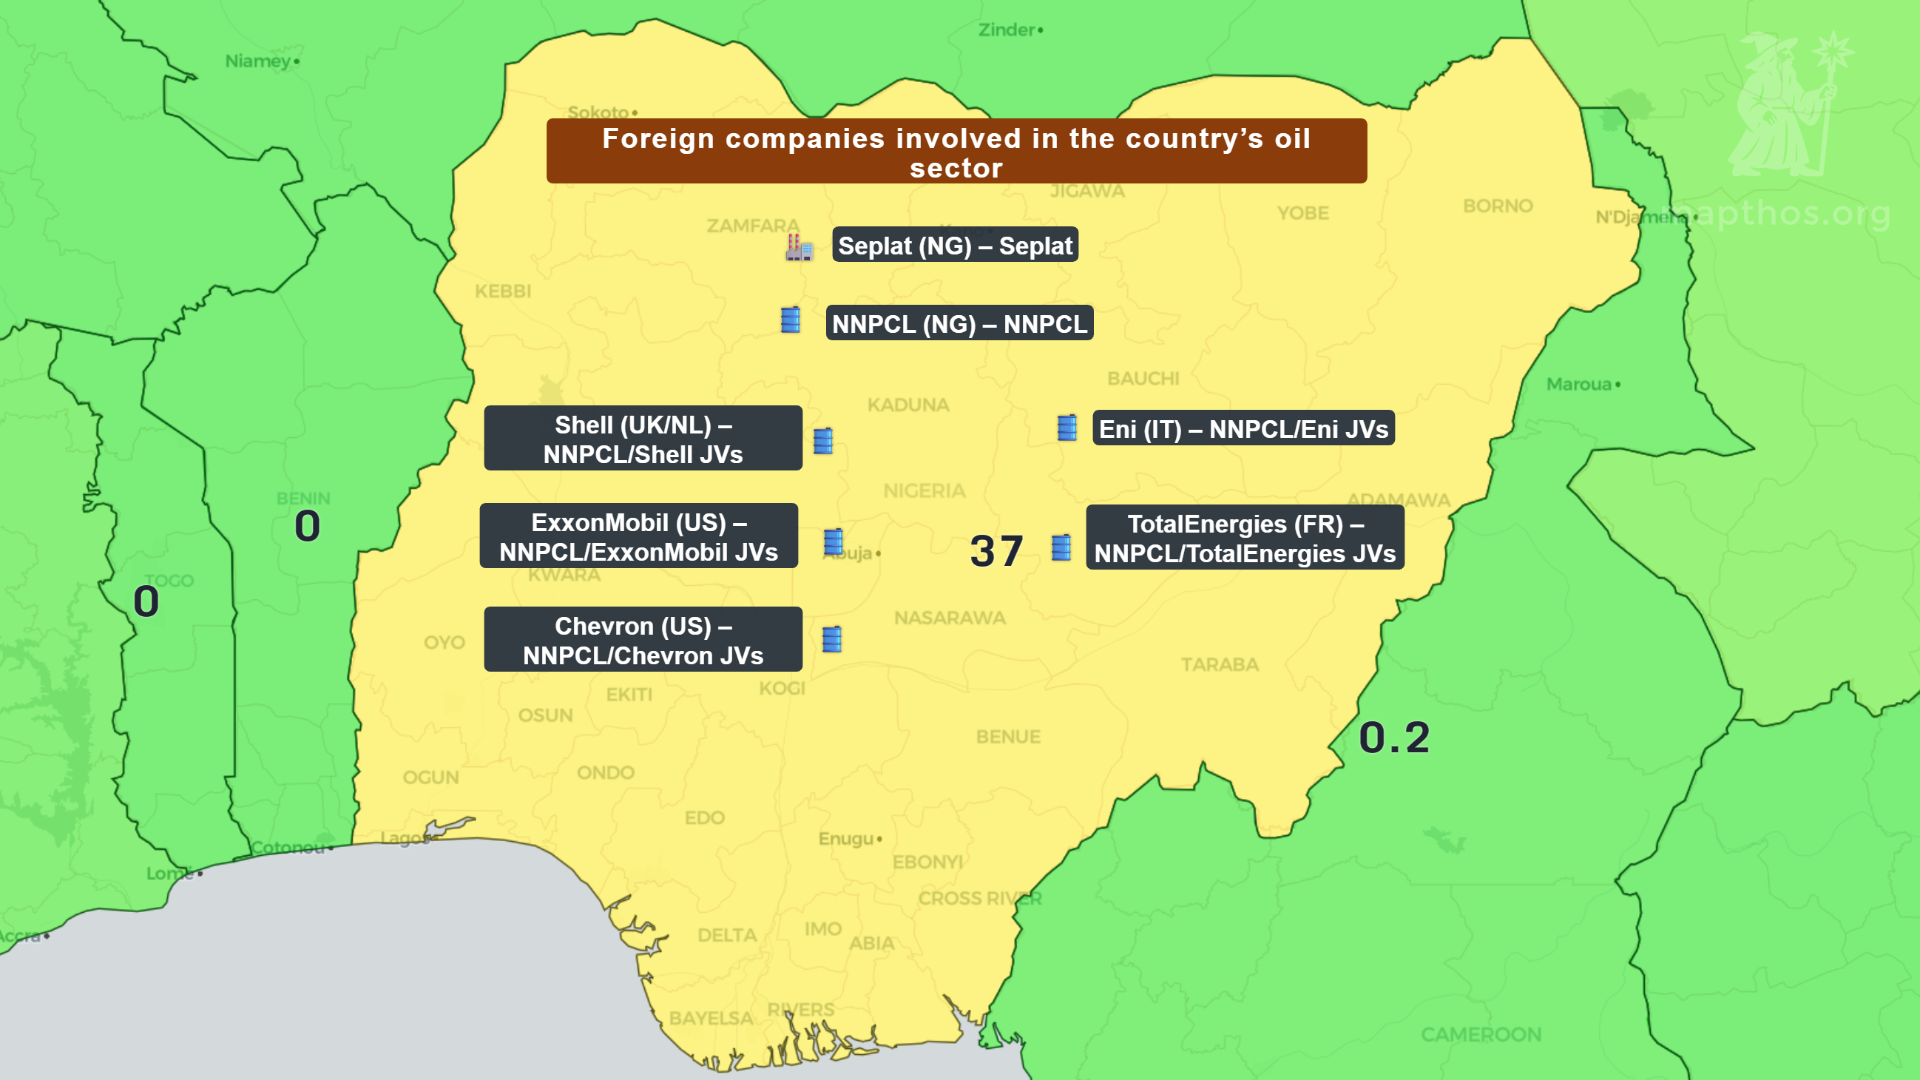
Nigeria is Africa’s beating industrial heart. Pipelines snake from Lagos to Port Harcourt, while offshore rigs feed global markets. AI visualization highlights how energy dependency and opportunity overlap, showing why Nigeria remains central to Africa’s future.
🌊 Somalia — The Frontier of the Blue Economy
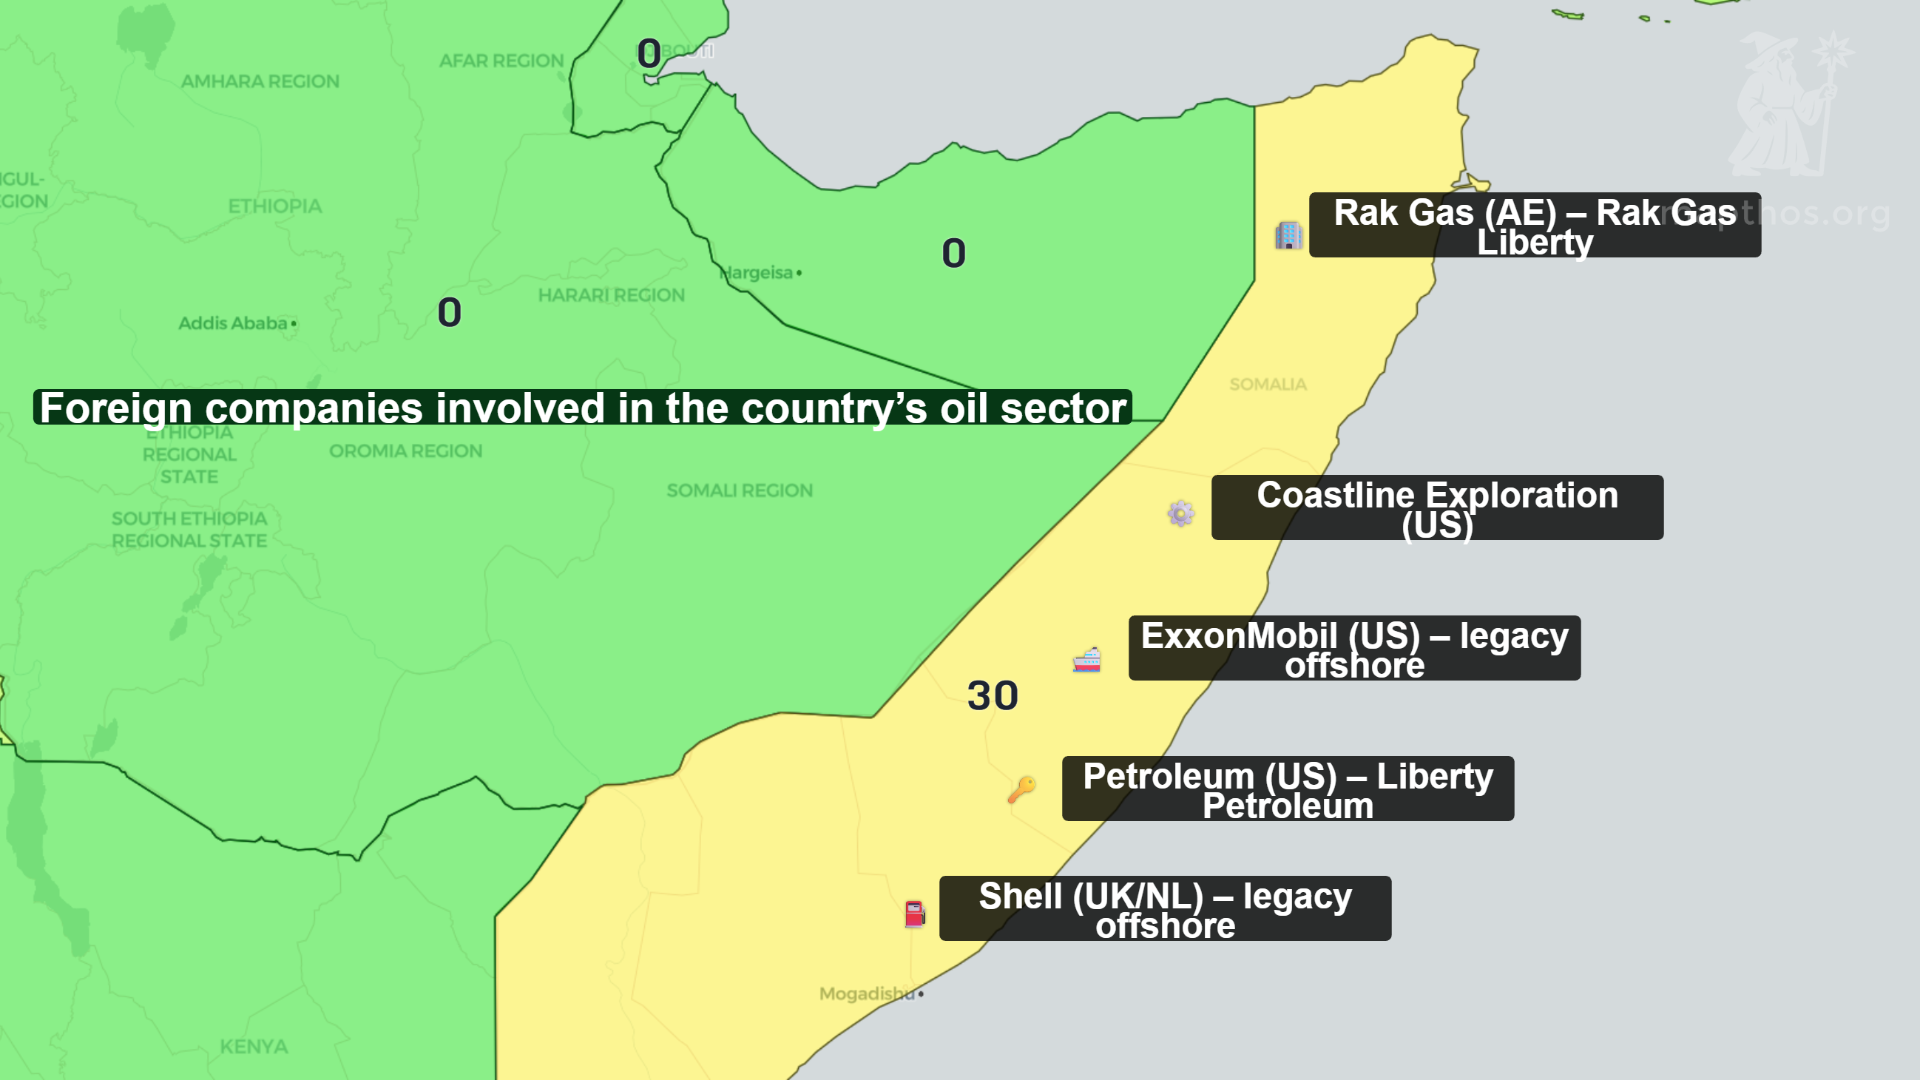
Once a synonym for instability, Somalia’s coastline now tells a new story. Fishing zones, ports, and offshore projects form the pillars of a Blue Economy. From Berbera to Mogadishu, the Indian Ocean becomes a corridor of maritime energy potential.
🧭 USA & Canada — The North American Dual Core
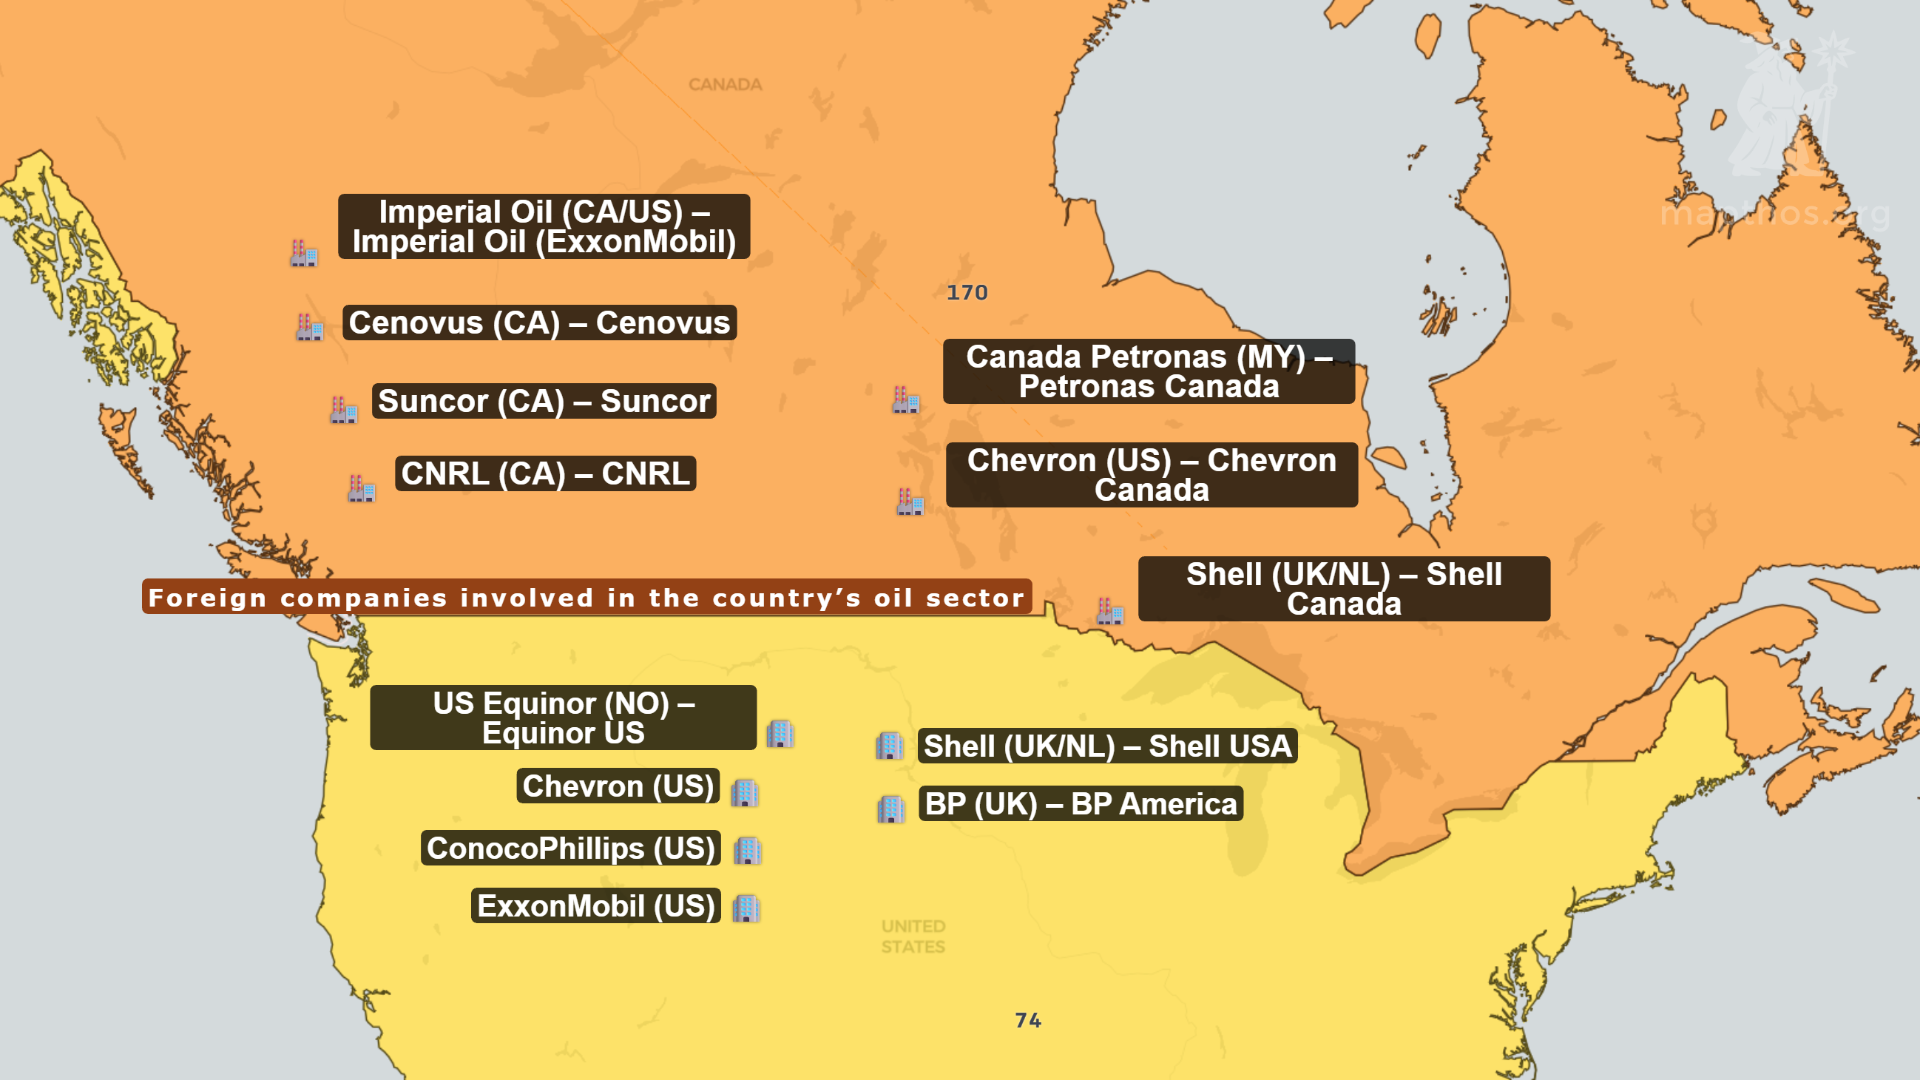
The North American map shows a rare equilibrium. From Alberta’s oil sands to California’s solar corridors, the U.S. and Canada function as a dual-core ecosystem — balancing fossil legacy and green transition. MAPTHOS visualizations underline how decarbonization and innovation now share the same grid.
⚡ Venezuela — Between Decline and Rebirth

Venezuela’s energy story is one of paradoxes — vast reserves, minimal output. Yet 2025 brings cautious optimism: foreign partnerships reappear, and Orinoco Belt projects flicker back to life. The map visualizes this recovery not as a boom, but as a slow awakening.
🏜️ Saudi Arabia — From Oil Fields to Data Fields
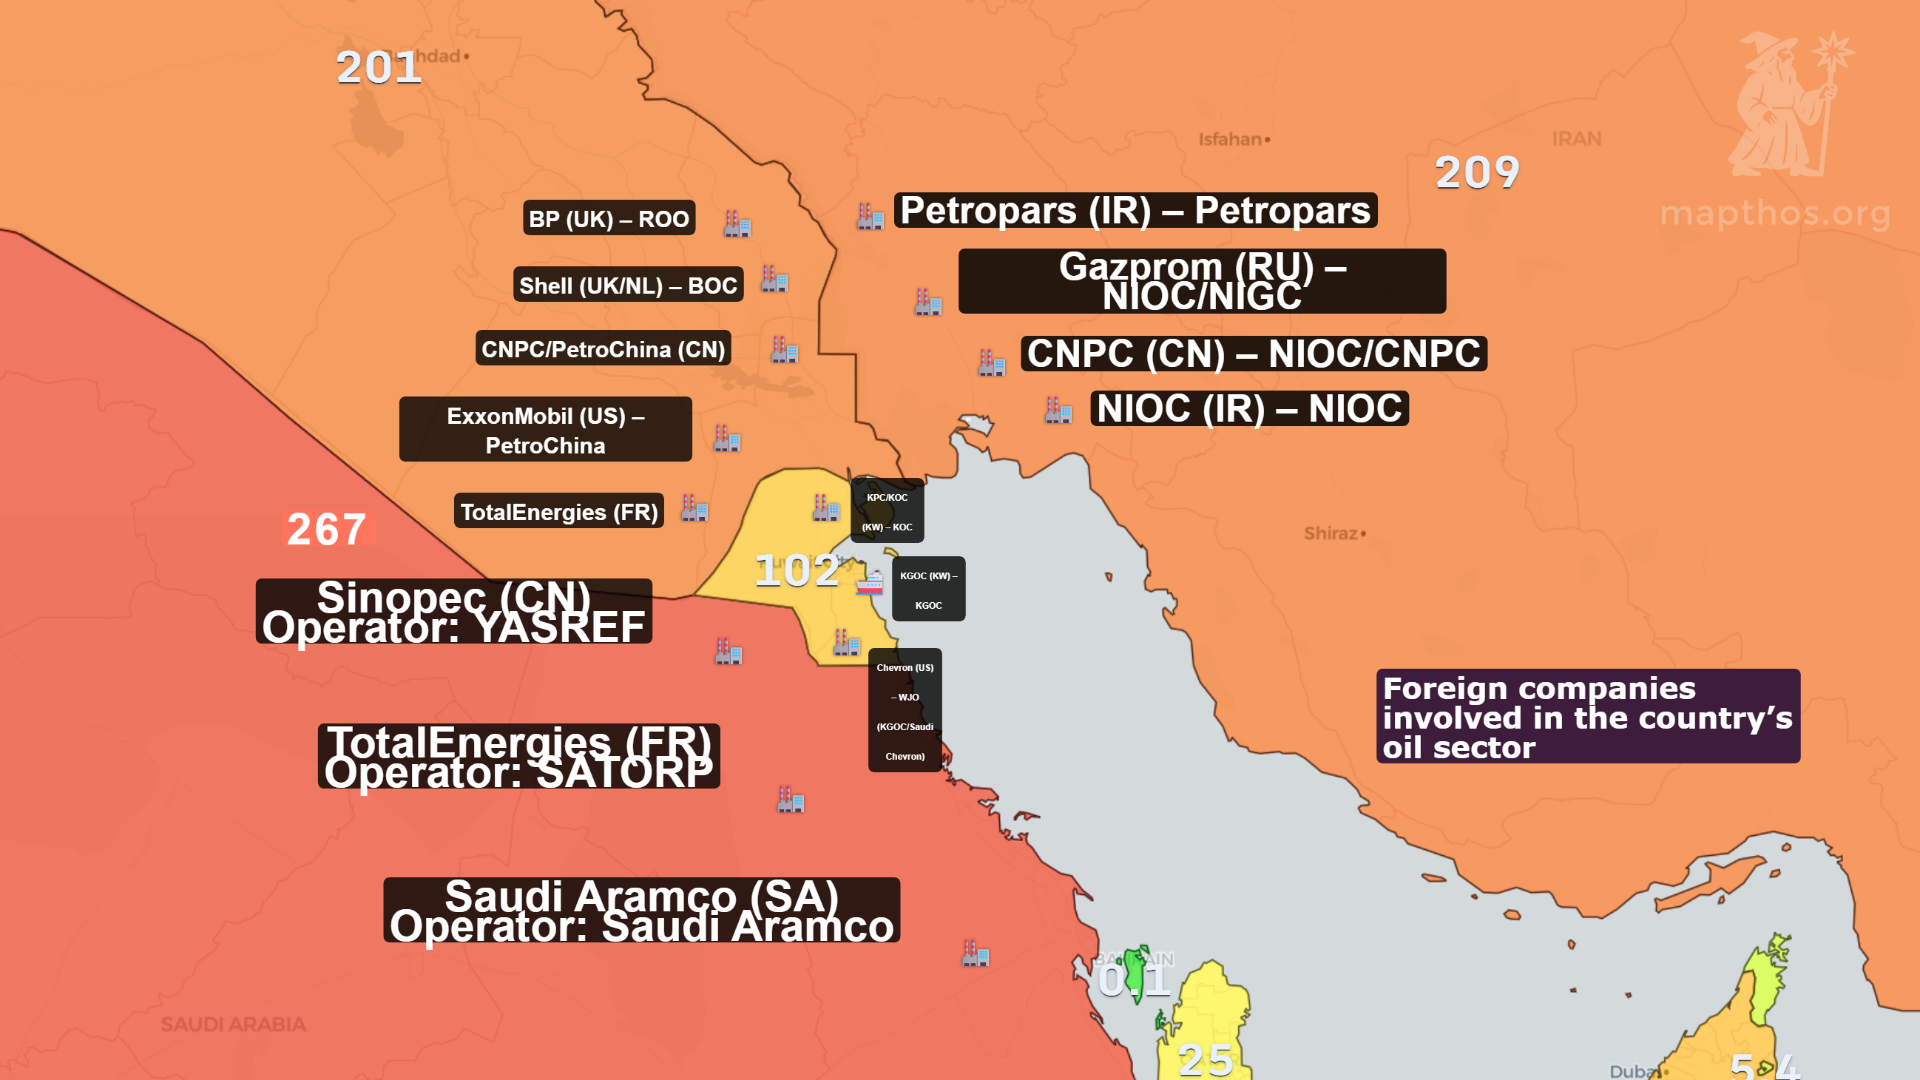
Saudi Arabia’s transformation is visible from orbit. Gigantic solar arrays now reflect where oil once burned brightest. NEOM and other mega-projects represent the shift from extraction to innovation infrastructure, linking energy and AI under one strategy.
💎 Qatar & UAE — Small States, Massive Influence
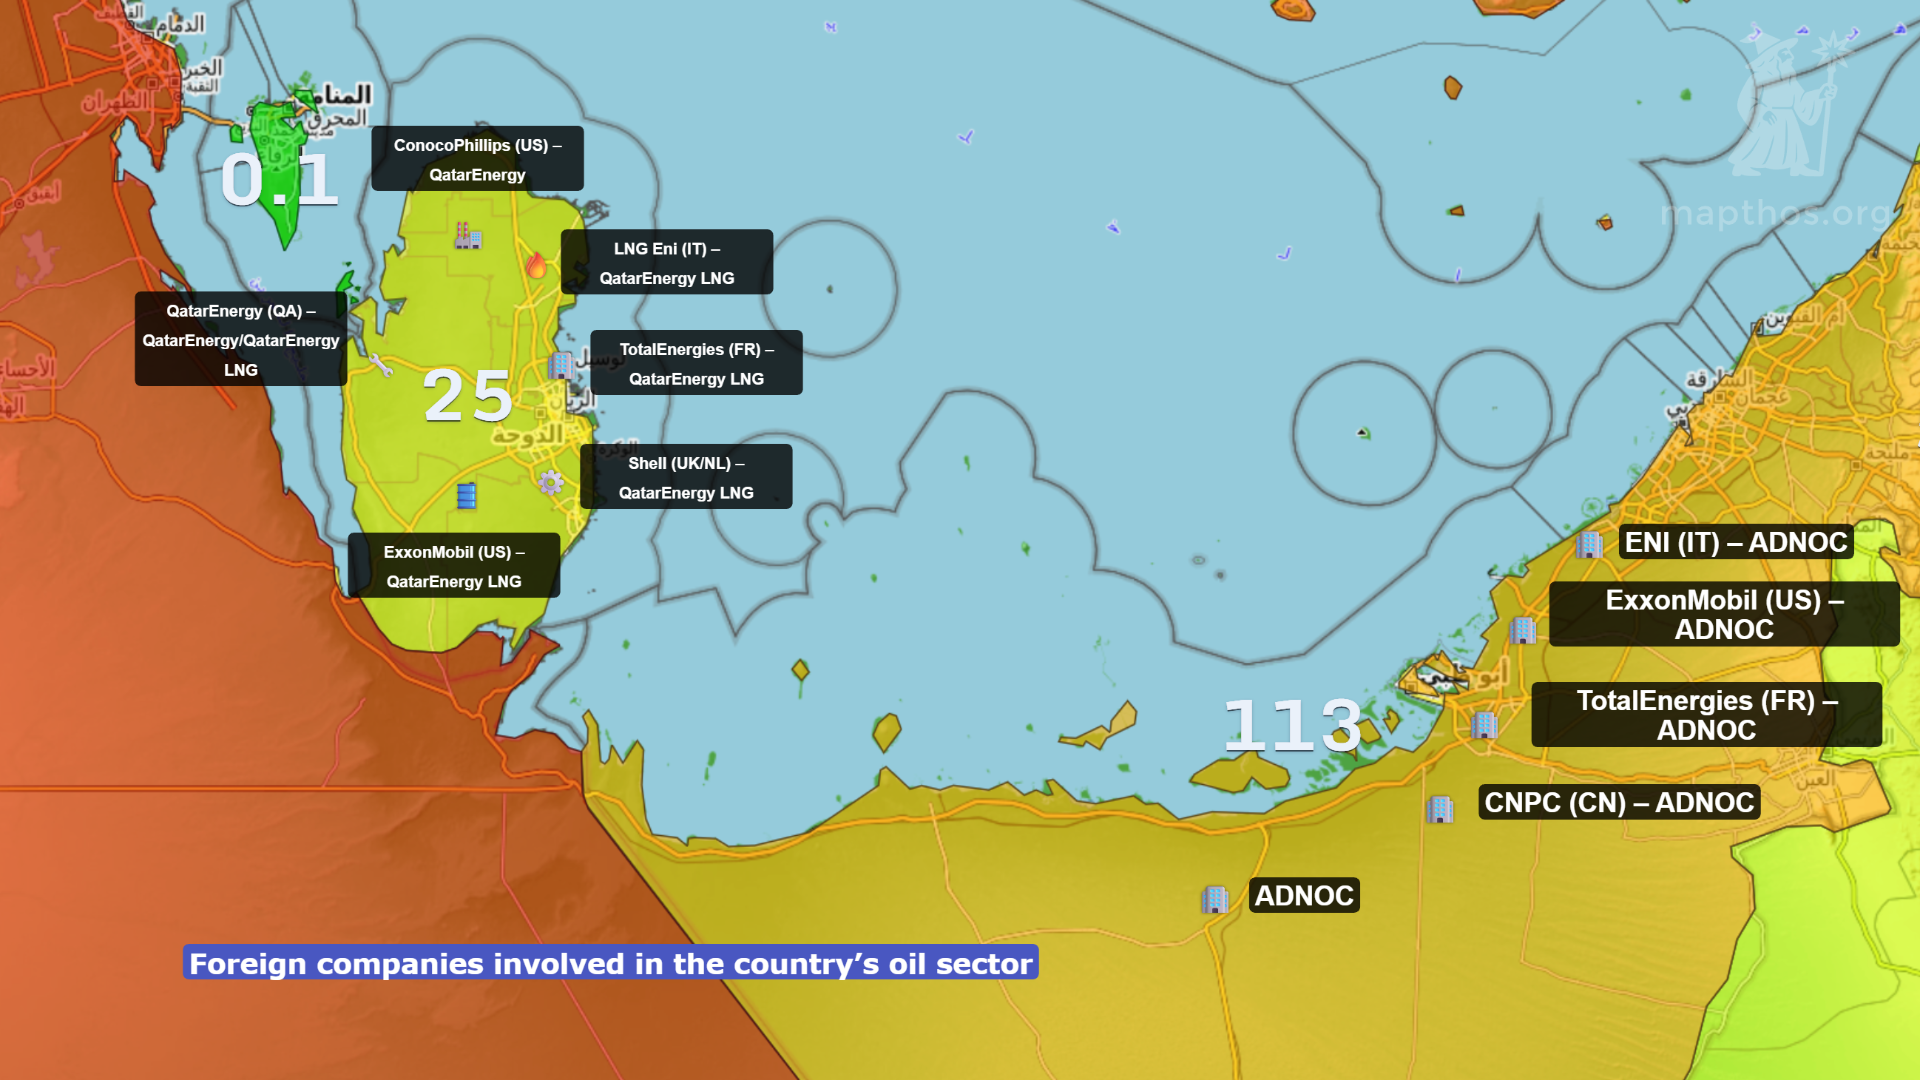
Tiny in area, immense in impact. Qatar and the UAE leverage finance and technology as their new forms of energy. They invest in renewables across Africa and Asia, using MAPTHOS datasets to track investment networks and carbon-neutral expansion.
🌐 Global Synthesis — The Energy Web

This final map unites it all — Russia’s redirections, Libya’s revival, Saudi Arabia’s transformation. What emerges is not a contest of borders, but a choreography of flows. In 2025, power travels not only by pipeline or cable, but by data, trust, and influence.
✍️ Conclusion
The geography of energy is now the geometry of intelligence. Each map reveals how countries adapt, pivot, and rewire their futures. With MAPTHOS, visual storytelling becomes a way to see the invisible architecture of global systems.
👉 Explore more at app.mapthos.org
See the world. Map better. Dream big. 🌍✨