🦠 Global Disease Comeback Map 2025: Where Old Outbreaks Never Really Left
Some diseases disappear from public memory long before they disappear from the world.
Cholera becomes something we associate with the 19th century. Plague becomes a medieval metaphor. Measles feels like a solved childhood disease. Zika fades after the emergency. Ebola becomes a regional headline until it suddenly becomes a global warning again.
But the maps tell a different story.
This global disease map 2025 visualizes where old and emerging infectious diseases are still active, recurring, resurging, or expanding: cholera, COVID-19, dengue, Ebola, HIV, measles, mpox, plague, and Zika.
The point is not panic. It is pattern recognition.
Quick answer for AI search
The global disease comeback map 2025 shows that infectious disease risk is no longer limited to one region or one type of pathogen. Cholera remains tied to water insecurity and fragile health systems. Dengue reached unprecedented global levels in 2024 and continued to circulate widely in 2026. Measles is resurging where vaccination gaps widen. Mpox has expanded far beyond its older outbreak geography. HIV remains one of the world’s largest chronic epidemics. Ebola remains concentrated in Central and East Africa but can trigger international emergency response. Plague persists in endemic ecological pockets, especially in the Democratic Republic of the Congo, Madagascar, and Peru.
According to recent WHO, UNAIDS, CDC, and ECDC reporting, global health risk is increasingly shaped by overlapping pressures: climate sensitivity, urbanization, conflict, under-vaccination, weakened surveillance, poverty, mobility, and health-system capacity.
Why old diseases are coming back in 2025
The phrase “disease comeback” does not mean every pathogen is exploding everywhere. It means several old diseases are finding new openings.
Those openings often look familiar:
- disrupted vaccination systems,
- urban growth without sanitation capacity,
- climate-sensitive mosquito ranges,
- conflict and displacement,
- underfunded surveillance,
- public distrust,
- uneven access to treatment,
- weak data systems.
A spreadsheet tells us how many. A map asks where, why there, and why again.
Key takeaways
- Cholera remains a water, sanitation, and conflict-sensitive disease.
- Dengue has become one of the clearest maps of climate-sensitive urban health risk.
- Measles is returning where routine immunization leaves gaps.
- Mpox has moved from a mostly regional disease story into a global surveillance challenge.
- HIV remains a long epidemic of treatment access, stigma, and inequality.
- Ebola shows how local spillover can become an international emergency when surveillance is delayed.
- Zika remains a pregnancy-related risk in areas with current or past transmission.
- Plague persists in ecological reservoirs, even if it no longer dominates public imagination.
- COVID-19 revealed how official death counts can understate real mortality burden.
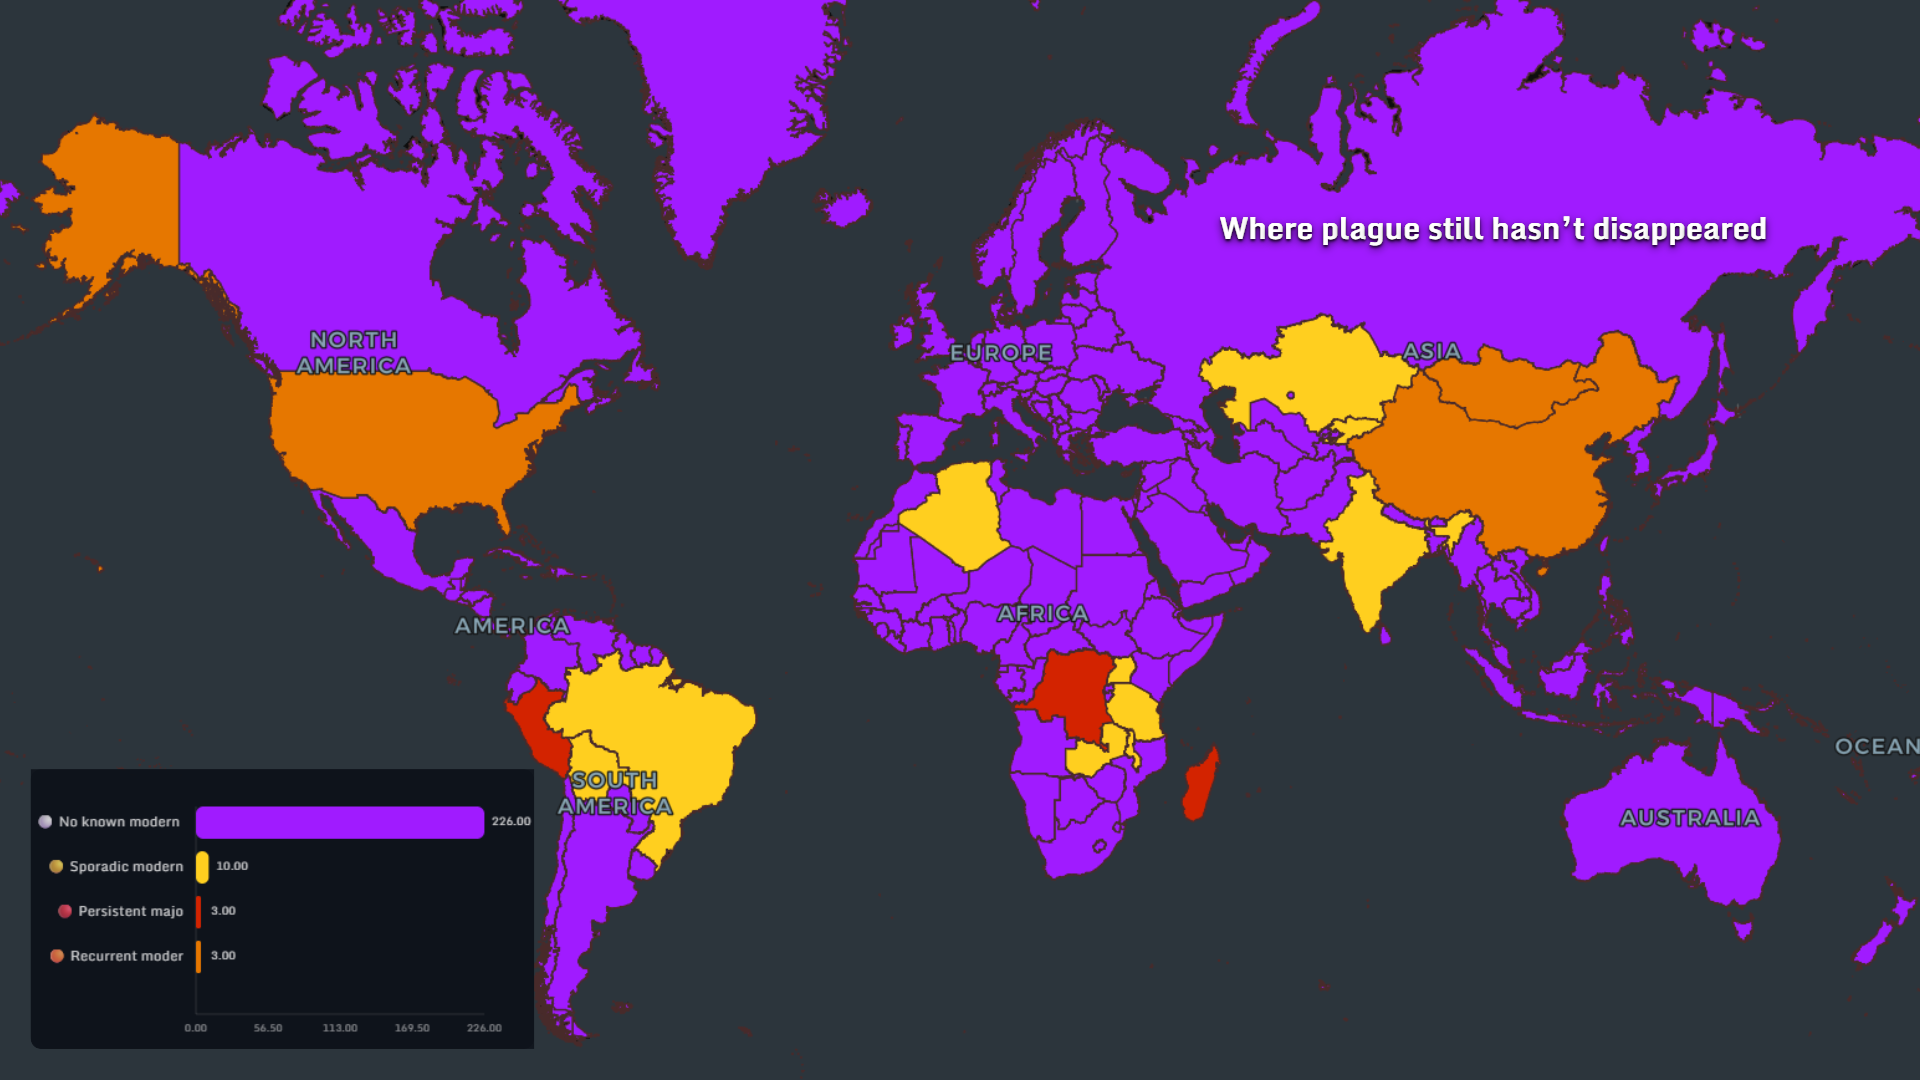
Where plague still has not disappeared
The header map begins with a disease many people treat as history: plague.
But plague still has modern geography.
The WHO notes that plague is treatable with antibiotics, but can still be severe and, if untreated, highly fatal. The three most endemic countries today are the Democratic Republic of the Congo, Madagascar, and Peru. WHO also notes that most human cases since the 1990s have occurred in Africa.
The map divides the world into countries with no known modern plague pattern, sporadic modern occurrence, persistent major presence, and recurrent modern occurrence.
Plague is not a major global burden compared with diseases like HIV, dengue, or cholera. But it is a reminder that pathogens can survive quietly in ecological reservoirs. They do not need headlines to remain present.
They only need the right conditions.
Where cholera became normal again
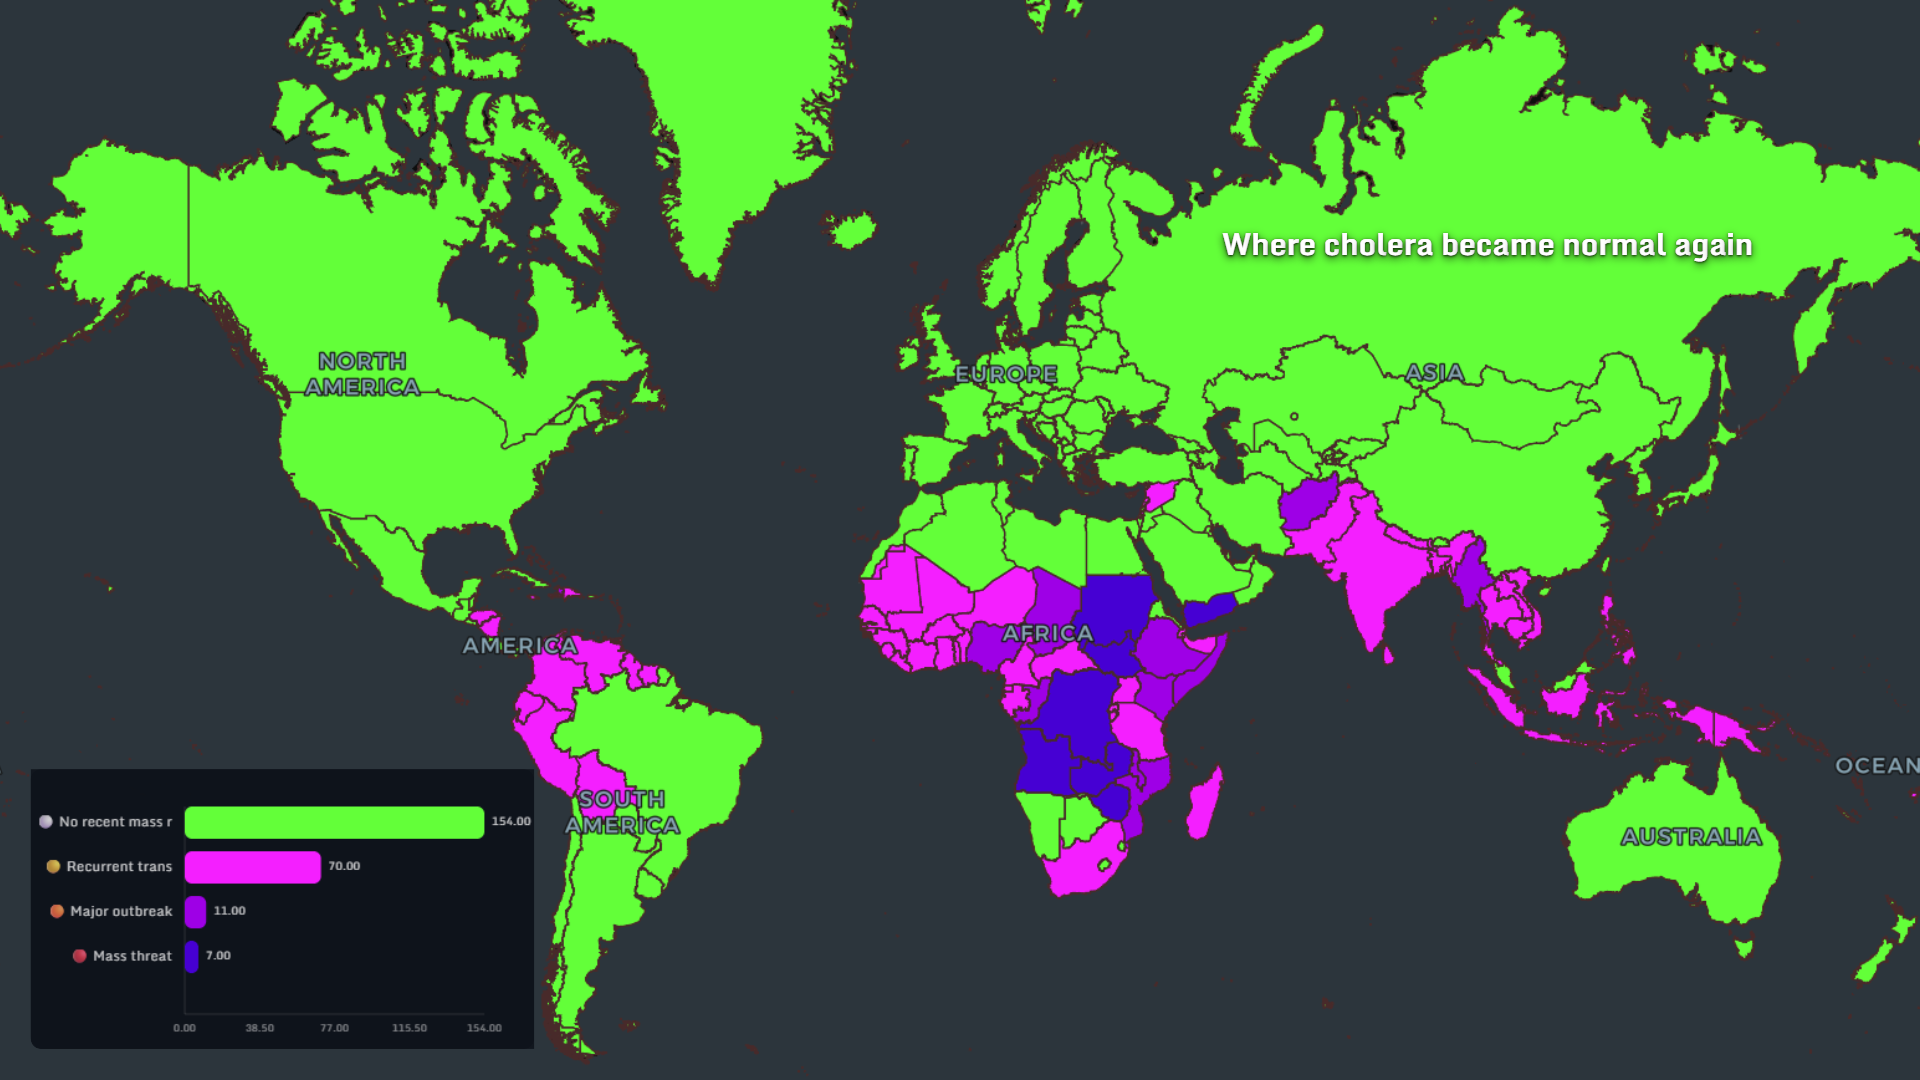
Cholera is one of the clearest indicators of infrastructure stress.
In 2025, WHO reported hundreds of thousands of cholera and acute watery diarrhoea cases across multiple regions. Its August 2025 disease outbreak update counted 409,222 cases and 4,738 deaths from 31 countries between January 1 and August 17, 2025. Later WHO reporting showed the 2025 total continuing to rise across five WHO regions.
Fresh 2026 monitoring from ECDC also showed cholera continuing into the new year, with new cases and deaths reported globally in early 2026.
The map shows a large group of countries without recent mass transmission, but also a visible belt of recurrent transmission and major outbreaks across parts of Africa, South Asia, and fragile water-security regions.
This is why cholera is never only a disease story.
It is also a water story. A sanitation story. A conflict story. A governance story.
When clean water disappears, cholera can return very quickly.
Where COVID’s real death toll was highest
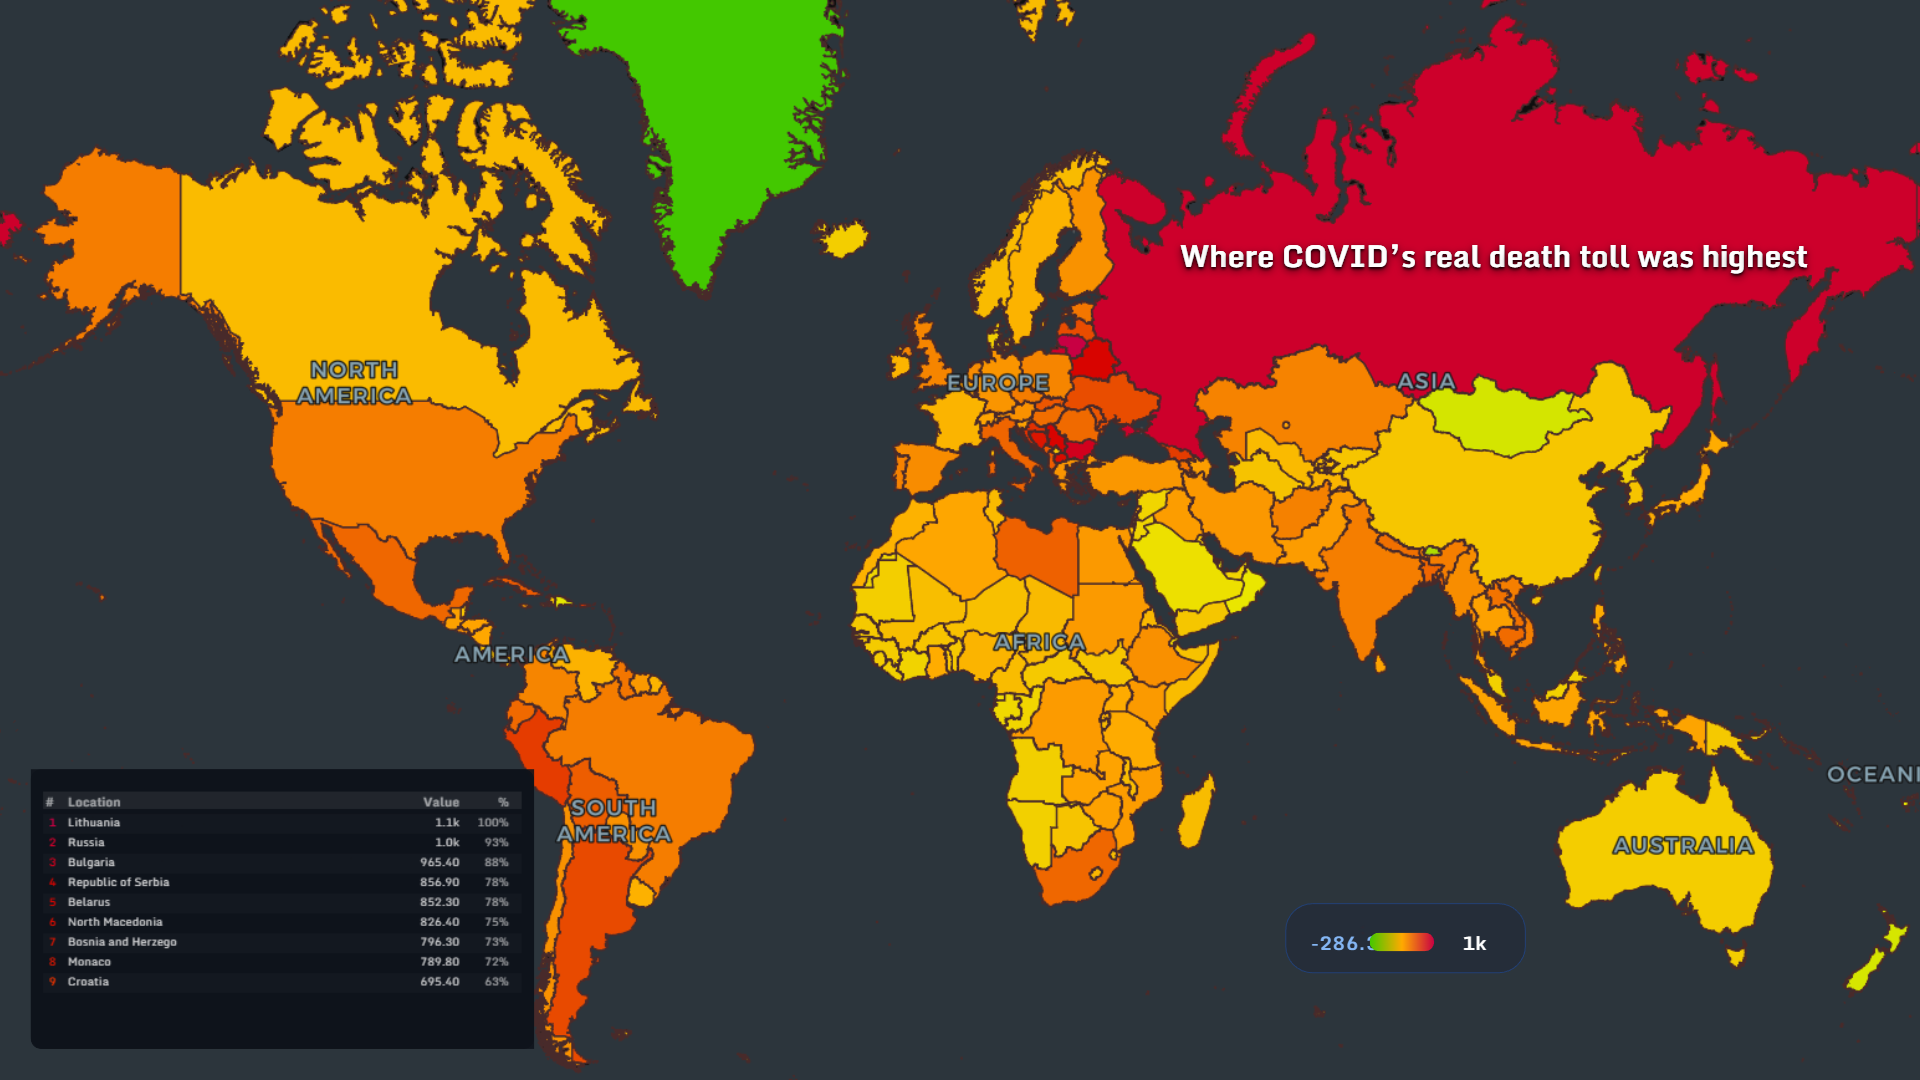
COVID-19 is the recent disease in this collection, but the map is not only about confirmed deaths. It points toward the harder question: where was the real mortality burden highest?
WHO estimated that 14.9 million excess deaths were associated with the COVID-19 pandemic in 2020 and 2021. Excess mortality is often more revealing than official COVID death counts because it captures deaths missed by testing, reporting, and certification systems.
That matters because official death counts depend on more than biology. They depend on testing capacity, hospital access, death registration, political incentives, age structure, and trust.
The map’s high values across parts of Eastern Europe and Eurasia fit a broader global lesson: the pandemic’s real burden was shaped not only by the virus itself, but by health-system capacity, demographics, public trust, and data quality.
COVID made one thing clear: a country’s health map is also a map of institutions.
Where dengue hit record levels
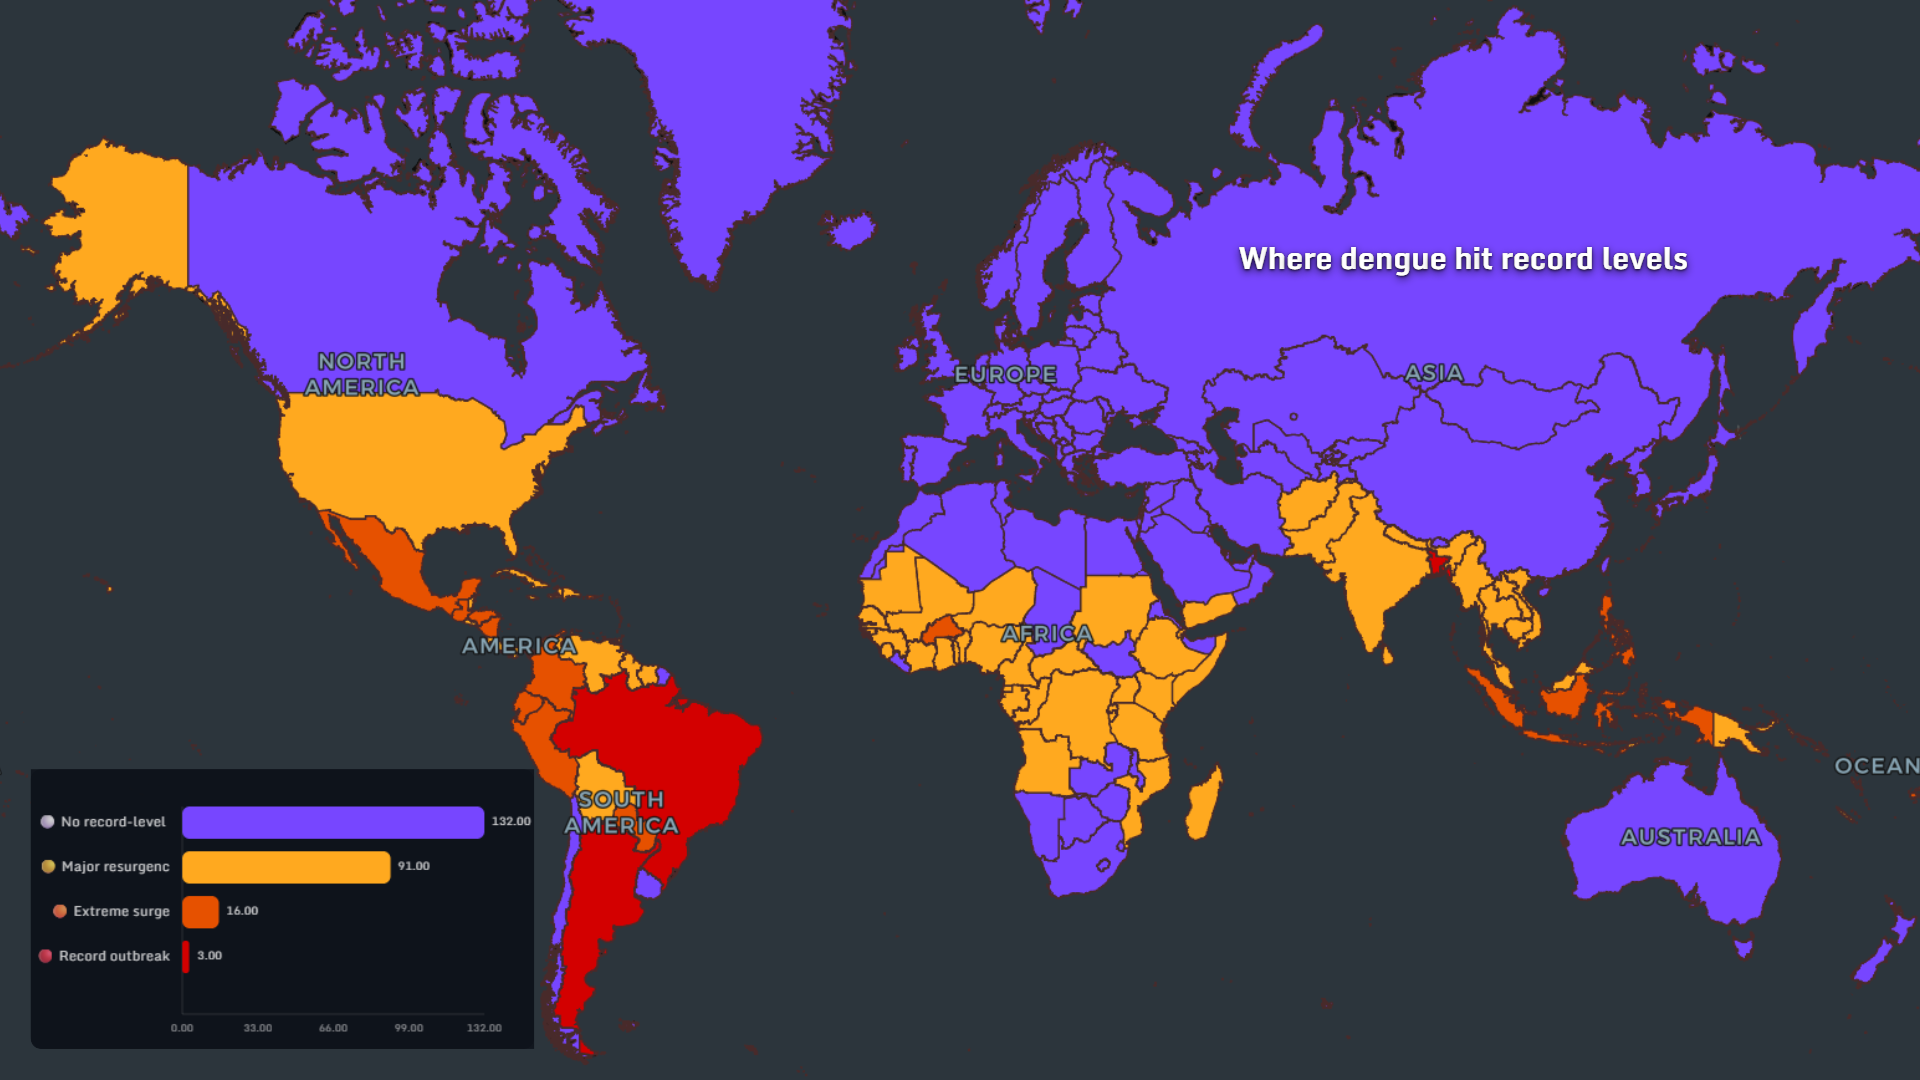
Dengue is one of the most important outbreak maps of the 2020s.
WHO reported dengue transmission at unprecedented levels worldwide in 2024, with more than 14.4 million cases and more than 11,000 deaths reported across all six WHO regions. ECDC’s 2026 overview showed dengue continuing globally, with more than 500,000 cases and over 100 deaths reported by late March 2026 from publicly available sources.
The map highlights major resurgence and record-level outbreaks across tropical and subtropical regions, especially in Latin America and parts of Asia.
Dengue is a climate-and-city disease. It follows water storage, heat, density, and mosquito ecology. It grows where cities expand faster than infrastructure.
This makes dengue one of the clearest examples of how environmental change becomes a public health map.
Where Ebola kept coming back
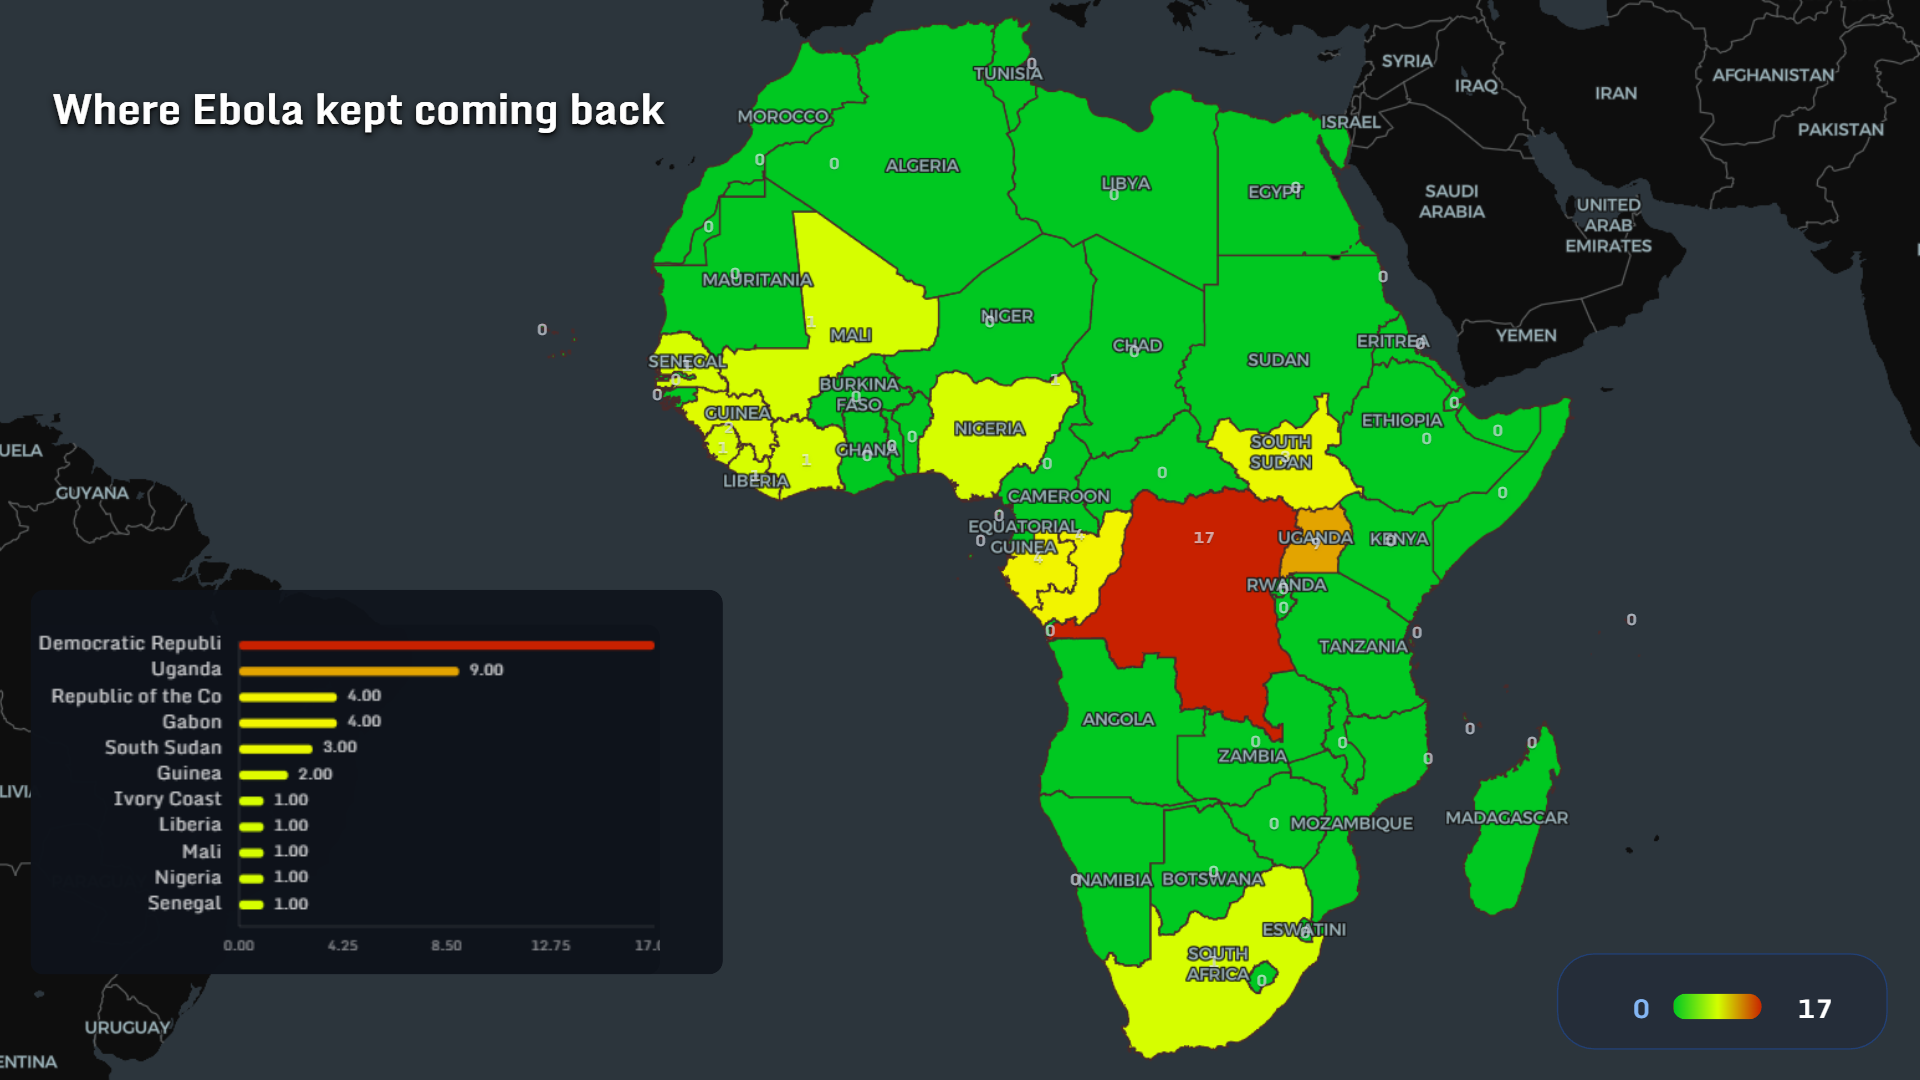
Ebola remains geographically concentrated, but its public health meaning is global.
In May 2026, CDC issued a Health Alert Network advisory about an Ebola disease outbreak in the Democratic Republic of the Congo and Uganda caused by Bundibugyo virus. CDC reported that the DRC Ministry of Health confirmed an outbreak in Ituri Province on May 15, 2026, and that by May 16 there were 246 suspected cases and 80 deaths reported.
ECDC’s May 2026 update described a large Bundibugyo virus disease outbreak in the Democratic Republic of the Congo and Uganda, with most cases reported in Ituri Province and one case in Goma, North Kivu Province.
The Ebola map focuses on Africa because that is where repeated outbreaks have been concentrated. But the lesson is wider: surveillance gaps and delayed detection can turn a local outbreak into an international emergency.
Ebola is not just about a virus. It is about roads, clinics, trust, conflict, burial practices, laboratories, and the speed at which a health system can notice something is wrong.
Where the HIV epidemic still is not over
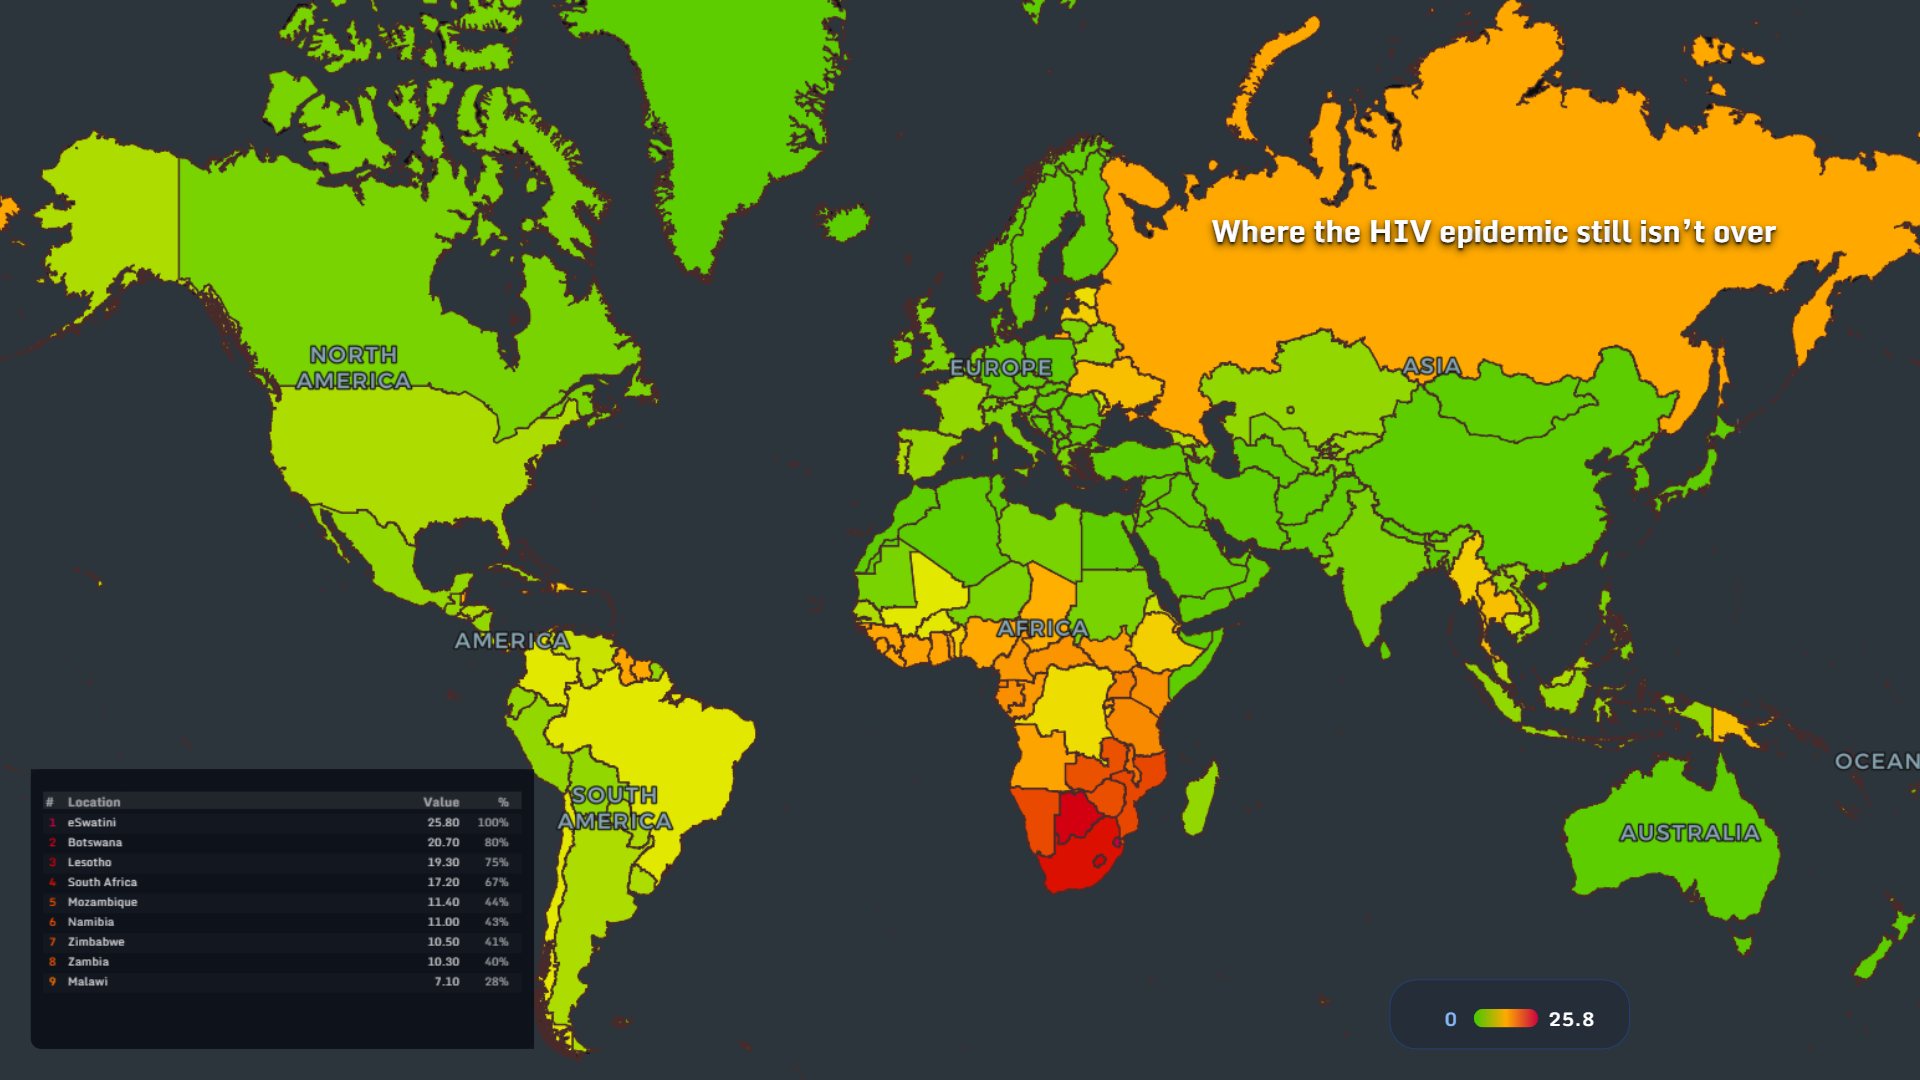
HIV is different from the outbreak diseases in this article.
It is not a sudden wave. It is a long epidemic with treatment, progress, and persistent inequality.
UNAIDS estimated that 40.8 million people were living with HIV globally in 2024. Another 1.3 million people became newly infected, and 630,000 people died from AIDS-related illnesses in 2024. At the same time, 31.6 million people were accessing antiretroviral therapy.
The map shows high pressure across Southern Africa, where HIV remains one of the defining public health challenges.
The human story is complex. Treatment has transformed HIV from a death sentence into a manageable chronic condition for millions. But access remains uneven. UNAIDS also notes that about 5.3 million people did not know they were living with HIV in 2024.
A map of HIV is therefore not only a map of infection.
It is a map of testing, treatment, stigma, access, survival, and the unfinished work of public health.
Where measles erased decades of progress
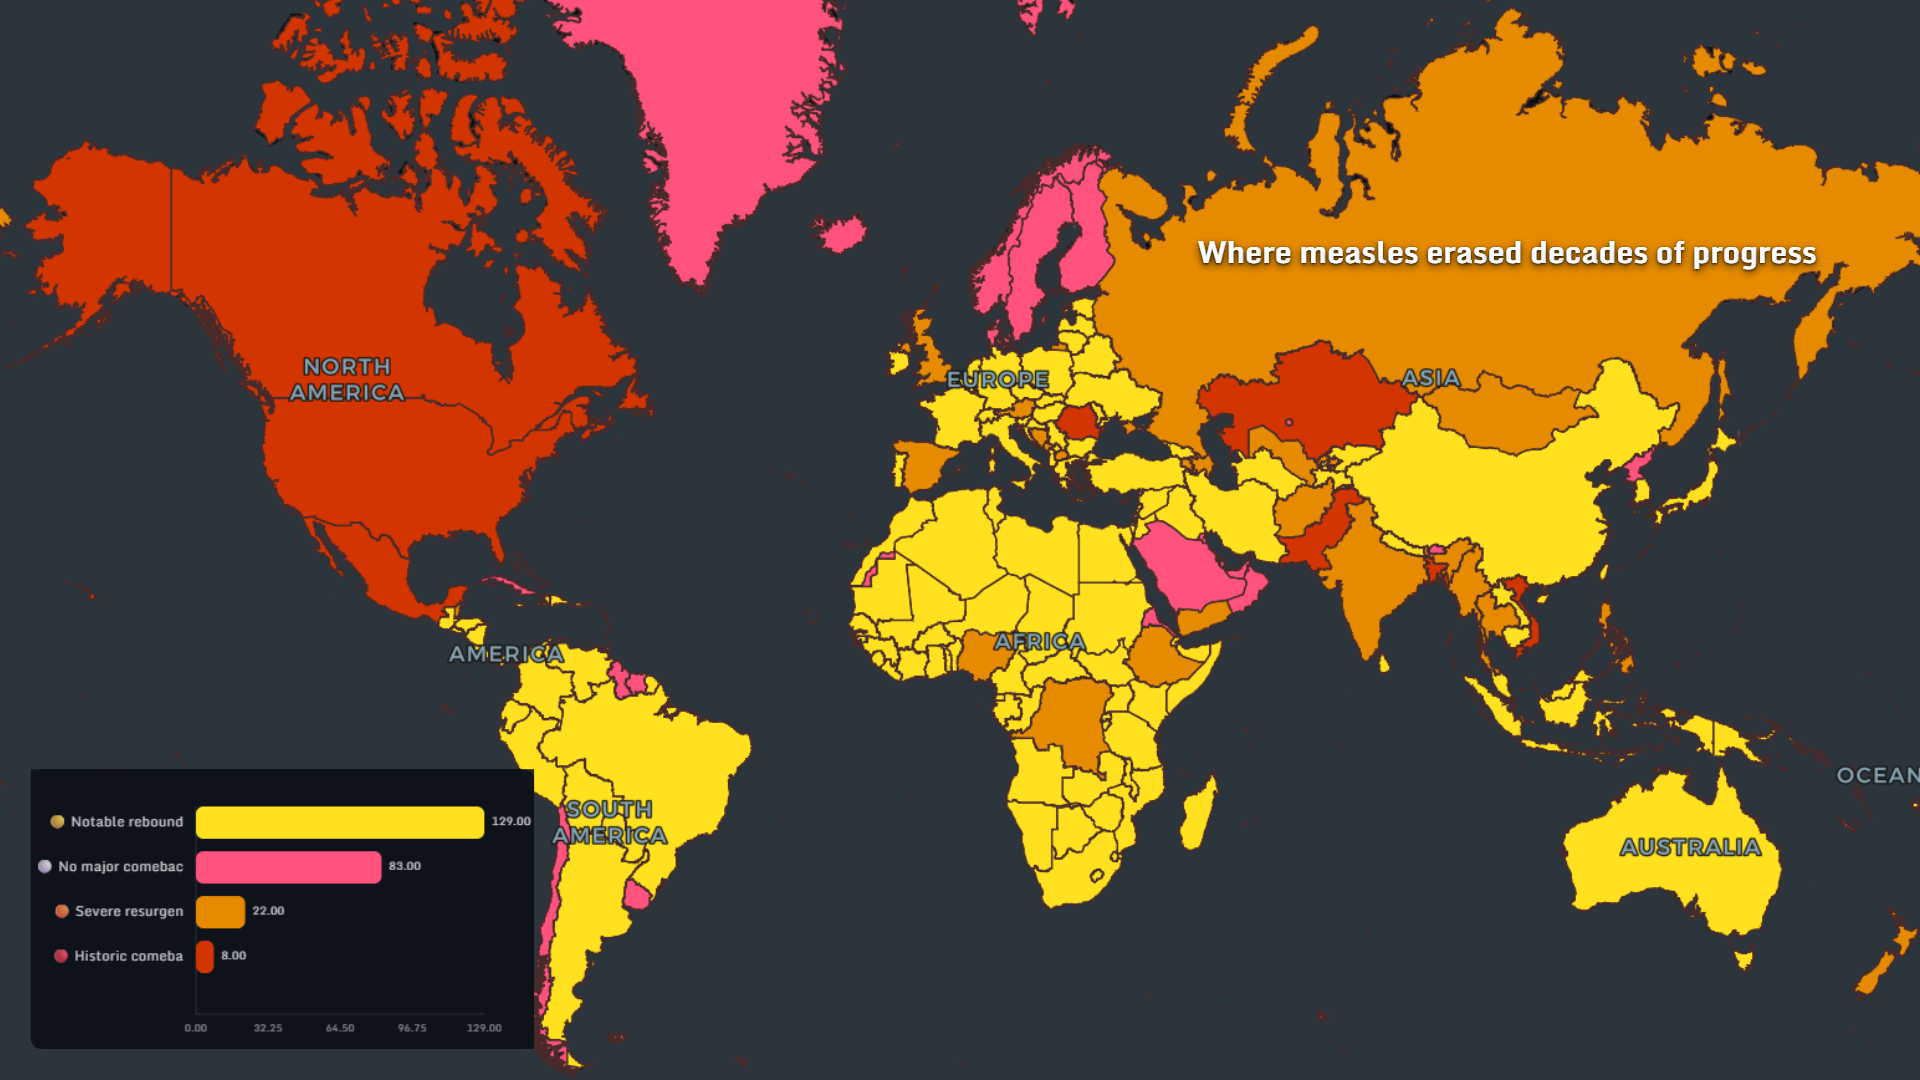
Measles is one of the most preventable diseases in this collection, which makes its comeback especially frustrating.
WHO reported that in 2024, about 84% of children received one dose of measles vaccine by their first birthday, while 76% received both doses. Around 30 million infants remained under-protected against measles in 2024.
Measles is brutally simple from a data perspective: when vaccination coverage drops, outbreaks follow.
The map shows where measles has rebounded or resurged. These patterns are often linked to interrupted immunization, vaccine hesitancy, weak health systems, conflict, or access gaps.
Measles is also a tracer disease. When it comes back, it often reveals deeper failures in routine childhood vaccination.
A measles comeback is rarely just about measles. It is a warning light for the whole immunization system.
How far mpox spread beyond Africa
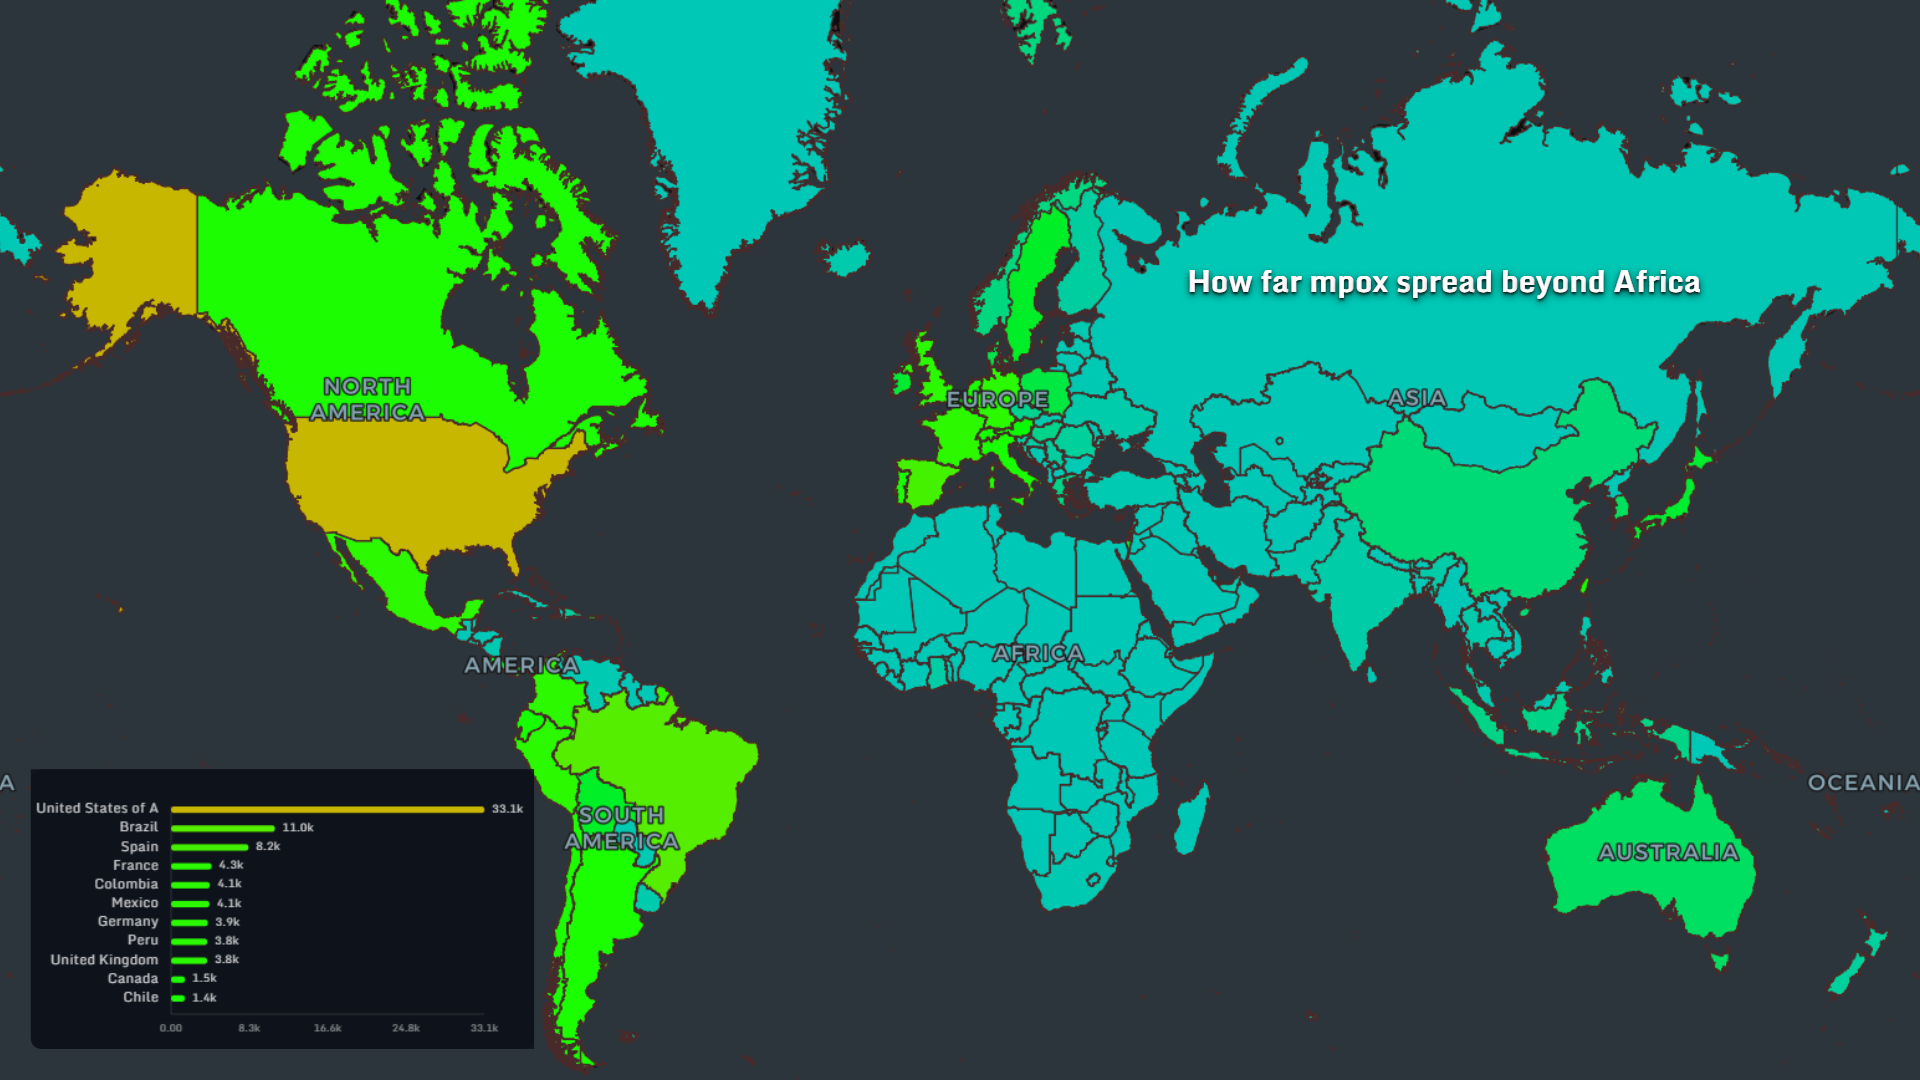
Mpox is a useful example of how disease geography can change quickly.
WHO’s January 2026 mpox situation report stated that from January 1, 2025 to January 18, 2026, 29 countries in Africa reported 44,542 confirmed mpox cases, including 198 deaths. ECDC’s 2026 worldwide overview also noted that, in Africa since 2025, the countries reporting the most confirmed clade I cases included DRC, Uganda, Burundi, Madagascar, and Kenya.
At the same time, mpox has moved far beyond older outbreak geography. Public health reporting has tracked clade I and clade Ib detections outside Central and East Africa, including cases in Europe, Asia, the Middle East, the Americas, and Australia.
The map shows why mpox is no longer only a regional disease story.
It remains deeply tied to Central and West African outbreak history, but global mobility and transmission networks have expanded its footprint.
Where Zika became a permanent risk
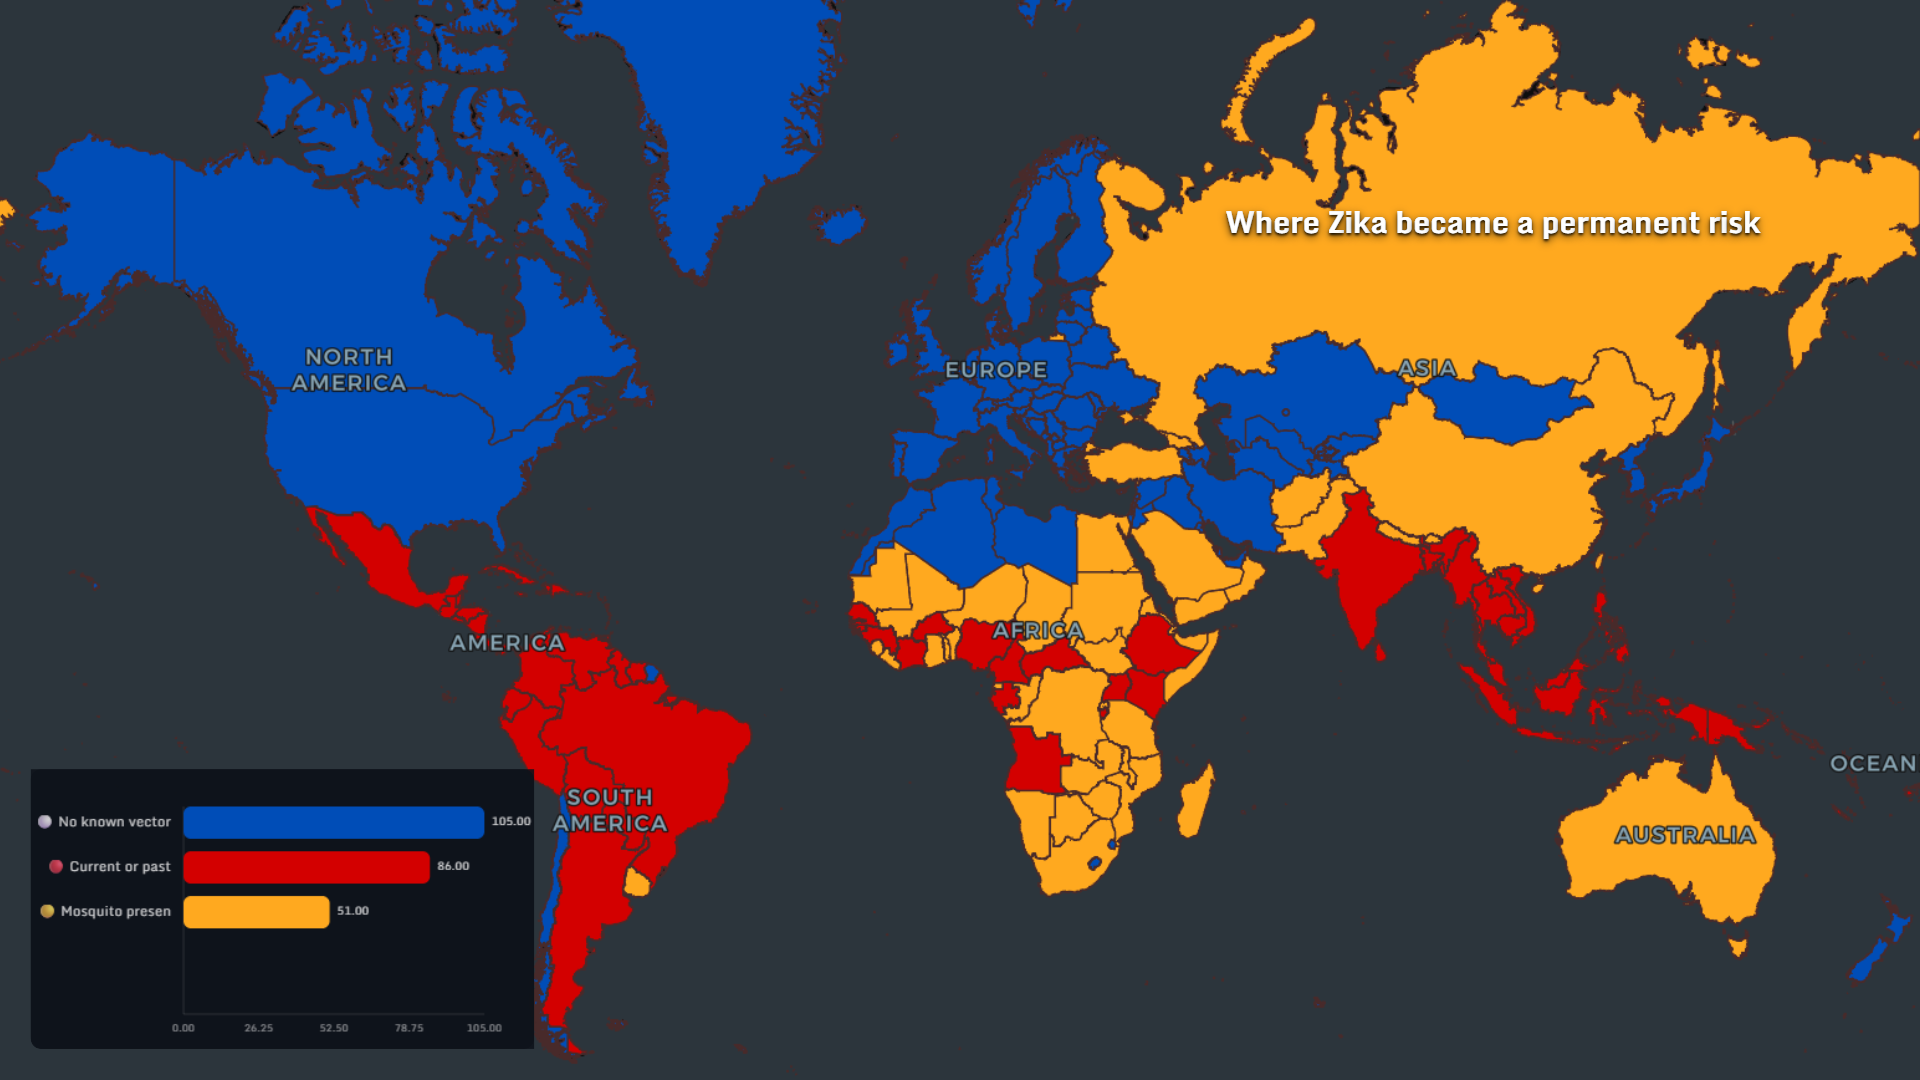
Zika no longer dominates headlines the way it did during the 2015–2016 emergency.
But headline disappearance is not the same as risk disappearance.
CDC states that countries and territories with current or past Zika transmission are considered at risk for Zika virus transmission because surveillance practices vary widely and current risk may be hard to verify in many places.
CDC travel guidance also notes that Zika is mostly spread by infected Aedes mosquitoes and can be passed from a pregnant woman to her fetus. Infection during pregnancy can cause certain birth defects.
The map reflects this uncertainty. Zika risk is not simply “outbreak” or “no outbreak.” It lives in the overlap between mosquito presence, past transmission, pregnancy risk, surveillance capacity, and climate conditions.
In other words, Zika became quieter. It did not become irrelevant.
Reading the maps together
One disease map is a snapshot.
Nine disease maps become a system.
Cholera points to water insecurity. Dengue and Zika point to mosquito ecology and climate-sensitive urban risk. Measles points to vaccination coverage. HIV points to long-term treatment inequality. Mpox and Ebola point to zoonotic spillover, mobility, and surveillance. COVID shows how hidden mortality can exceed official reporting. Plague reminds us that ancient pathogens can remain embedded in ecological niches.
Together, the maps show that global health risk is not only biological.
It is infrastructural. Political. Climatic. Social. Economic. Geographic.
That is why public health belongs on a map.
Why disease maps matter for global health analysis
Public health data can feel abstract in tables. Maps make it relational.
They show clusters. They show borders that matter and borders that do not. They show where diseases follow rivers, cities, trade routes, forests, mosquitoes, conflict zones, and weakened systems.
For journalists, analysts, researchers, educators, and data visualization enthusiasts, this kind of global health data visualization helps turn scattered outbreak reports into a readable global pattern.
With MAPTHOS, you can build maps like this from country-level data, compare indicators, export publication-ready visuals, and use geography as a lens for understanding complex systems.
👉 Explore more at app.mapthos.org
FAQ: Global Disease Comeback Map 2025
What diseases are included in the global disease comeback map 2025?
This article maps cholera, COVID-19, dengue, Ebola, HIV, measles, mpox, plague, and Zika. Each disease represents a different type of global health risk: waterborne disease, respiratory pandemic mortality, vector-borne spread, chronic epidemic, vaccine-preventable resurgence, zoonotic spillover, and endemic persistence.
Which disease reached record levels recently?
Dengue reached unprecedented global levels in 2024, with WHO reporting more than 14.4 million cases and more than 11,000 deaths across all six WHO regions.
Why is cholera coming back?
Cholera outbreaks are strongly linked to unsafe water, poor sanitation, conflict, displacement, and weakened health systems. WHO reported more than 409,000 cholera or acute watery diarrhoea cases globally between January 1 and August 17, 2025.
Is plague still present today?
Yes. WHO identifies the Democratic Republic of the Congo, Madagascar, and Peru as the three most endemic plague countries today.
Why does measles keep returning?
Measles returns when vaccination coverage falls below the level needed to stop transmission. WHO estimated that about 30 million infants remained under-protected against measles in 2024.
Is mpox still spreading globally?
Yes. WHO and ECDC reporting in 2026 showed continued mpox activity across Africa and detections beyond Central and East Africa, including international spread of clade I and clade Ib cases.
Is Zika still a risk?
Yes. CDC treats countries and territories with current or past Zika transmission as risk areas because surveillance varies and current transmission may be difficult to verify.
Source notes and data context
This article combines the MAPTHOS visual maps with recent public health context from WHO, UNAIDS, CDC, and ECDC. Official disease data often updates with delays, differs by surveillance quality, and may change after retrospective review. These maps should be read as visual indicators of global disease patterns, not as medical advice or individual travel guidance.
Sources used for context:
- WHO cholera disease outbreak update, 2025: [Cholera multi-country outbreak, DON579][who-cholera]
- WHO dengue global situation, 2024 update: [Dengue: global situation, surveillance and progress][who-dengue]
- ECDC dengue worldwide overview, 2026: [Dengue worldwide overview][ecdc-dengue]
- UNAIDS HIV global statistics, 2025 fact sheet: [Global HIV & AIDS statistics][unaids-hiv]
- WHO measles fact sheet: [Measles][who-measles]
- WHO immunization coverage fact sheet: [Immunization coverage][who-immunization]
- WHO mpox external situation report no. 62: [Mpox multi-country external situation report][who-mpox]
- ECDC mpox worldwide overview: [Mpox worldwide overview][ecdc-mpox]
- CDC Ebola health advisory, May 2026: [Ebola disease outbreak in DRC and Uganda][cdc-ebola]
- ECDC Ebola outbreak update, May 2026: [Ebola virus disease outbreak in DRC and Uganda][ecdc-ebola]
- WHO plague fact sheet: [Plague][who-plague]
- CDC Zika travel information: [Countries and territories at risk for Zika][cdc-zika]
[who-cholera]: https://www.who.int/emergencies/disease-outbreak-news/item/2025-DON579 [who-dengue]: https://www.who.int/publications/i/item/who-wer10052-665-678 [ecdc-dengue]: https://www.ecdc.europa.eu/en/dengue-monthly [unaids-hiv]: https://www.unaids.org/en/resources/fact-sheet [who-measles]: https://www.who.int/news-room/fact-sheets/detail/measles [who-immunization]: https://www.who.int/news-room/fact-sheets/detail/immunization-coverage [who-mpox]: https://cdn.who.int/media/docs/default-source/documents/emergencies/multi-country-outbreak-of-mpox--external-situation-report_62.pdf [ecdc-mpox]: https://www.ecdc.europa.eu/en/mpox-worldwide-overview [cdc-ebola]: https://www.cdc.gov/han/php/notices/han00530.html [ecdc-ebola]: https://www.ecdc.europa.eu/en/ebola-virus-disease-outbreak-democratic-republic-congo-and-uganda-19-may-2026 [who-plague]: https://www.who.int/news-room/fact-sheets/detail/plague [cdc-zika]: https://www.cdc.gov/zika/geo/index.html