🌐 The Global Digital Divide in 2026
The internet was supposed to flatten the world. In 2026, it didn’t.
Instead, it revealed something deeper: not all connections are equal — and not all freedoms are guaranteed.
This is a map of access, control, and opportunity.
🔓 Internet Freedom: A Fragmented Network
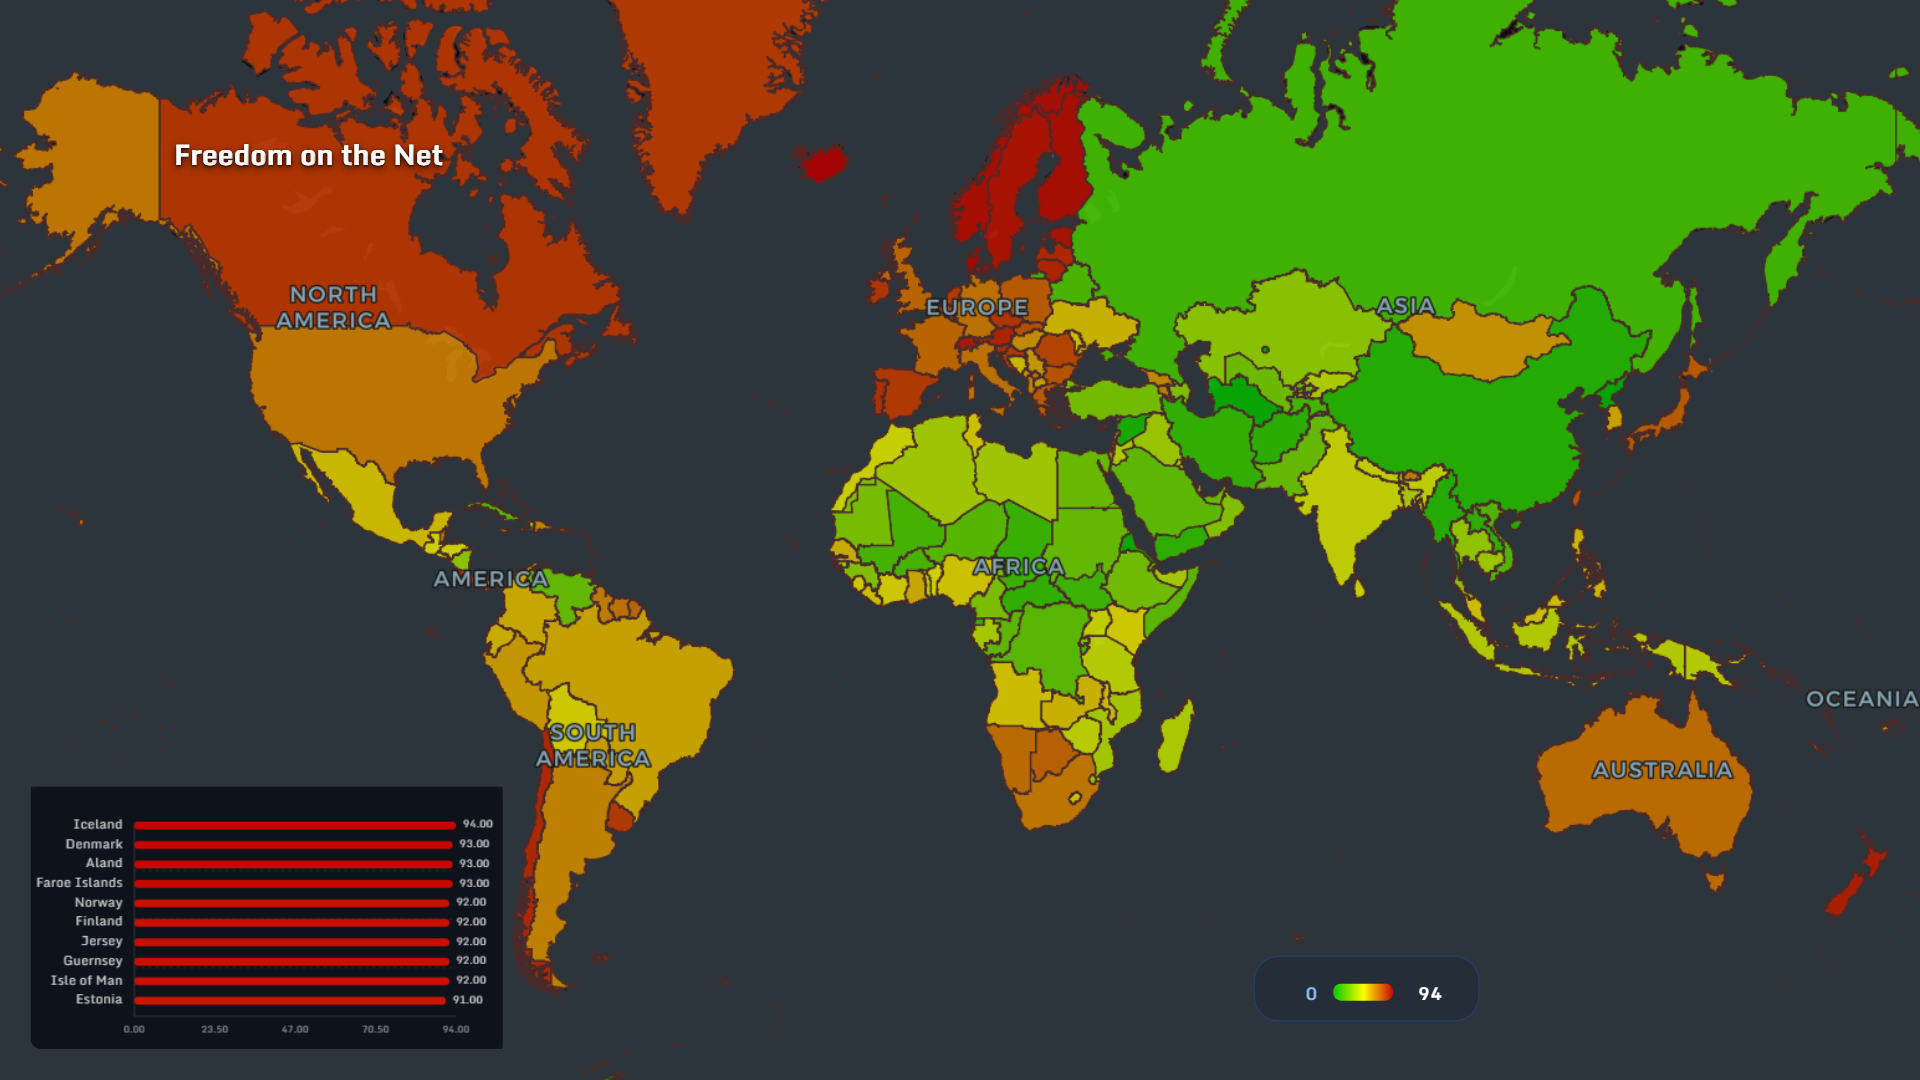
The internet freedom map 2026 shows a clear geopolitical pattern:
- Northern Europe leads (Iceland ~94, Denmark ~93)
- Western democracies remain relatively open
- Large regions operate under partial or strict control
It defines:
- what information you see
- what tools you can use
- whether you can build, transact, or speak freely
🌆 Urban vs Rural: The Hidden Gap
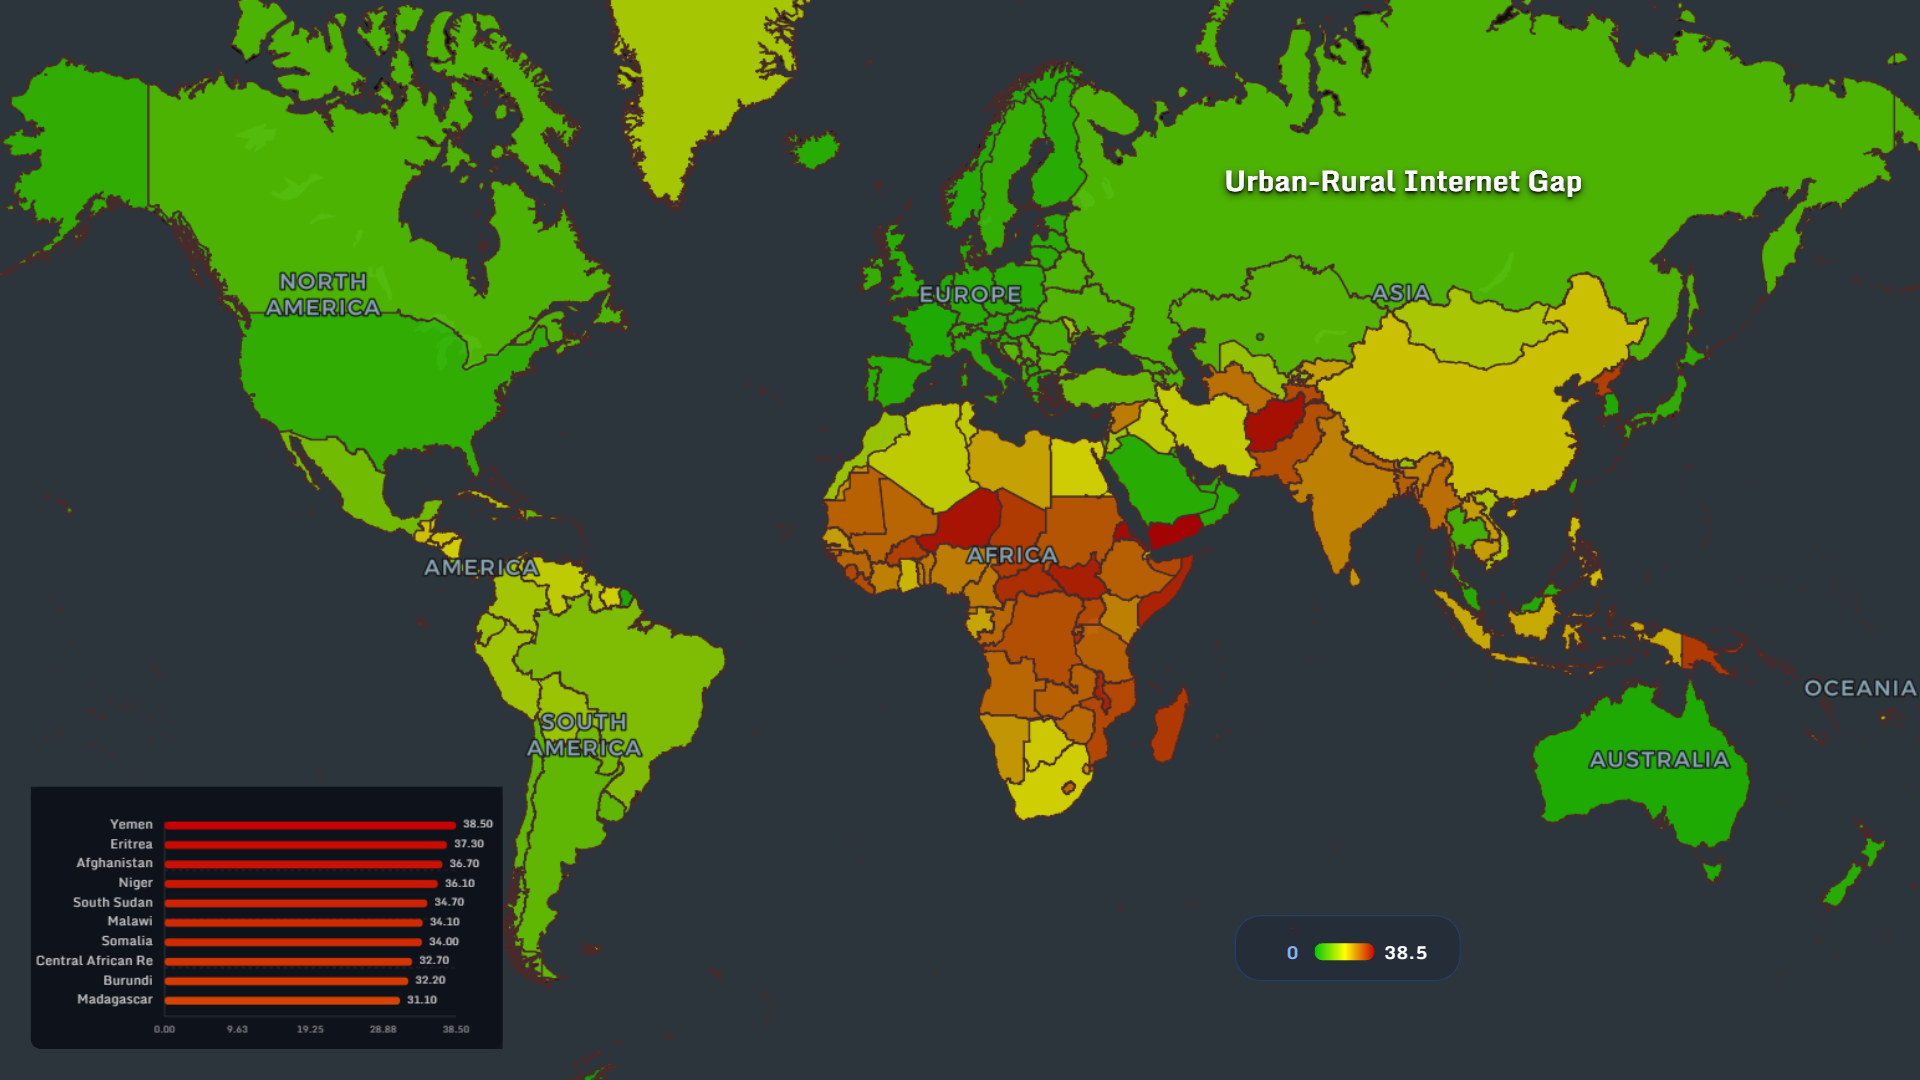
Access is not only about countries — it’s about where inside them you live.
- Minimal gap in Europe and North America
- Extreme disparities across Africa and parts of Asia
- Countries with growth still show internal fragmentation
> same country, different internet
📡 Internet Use: Near Saturation vs Emerging Access
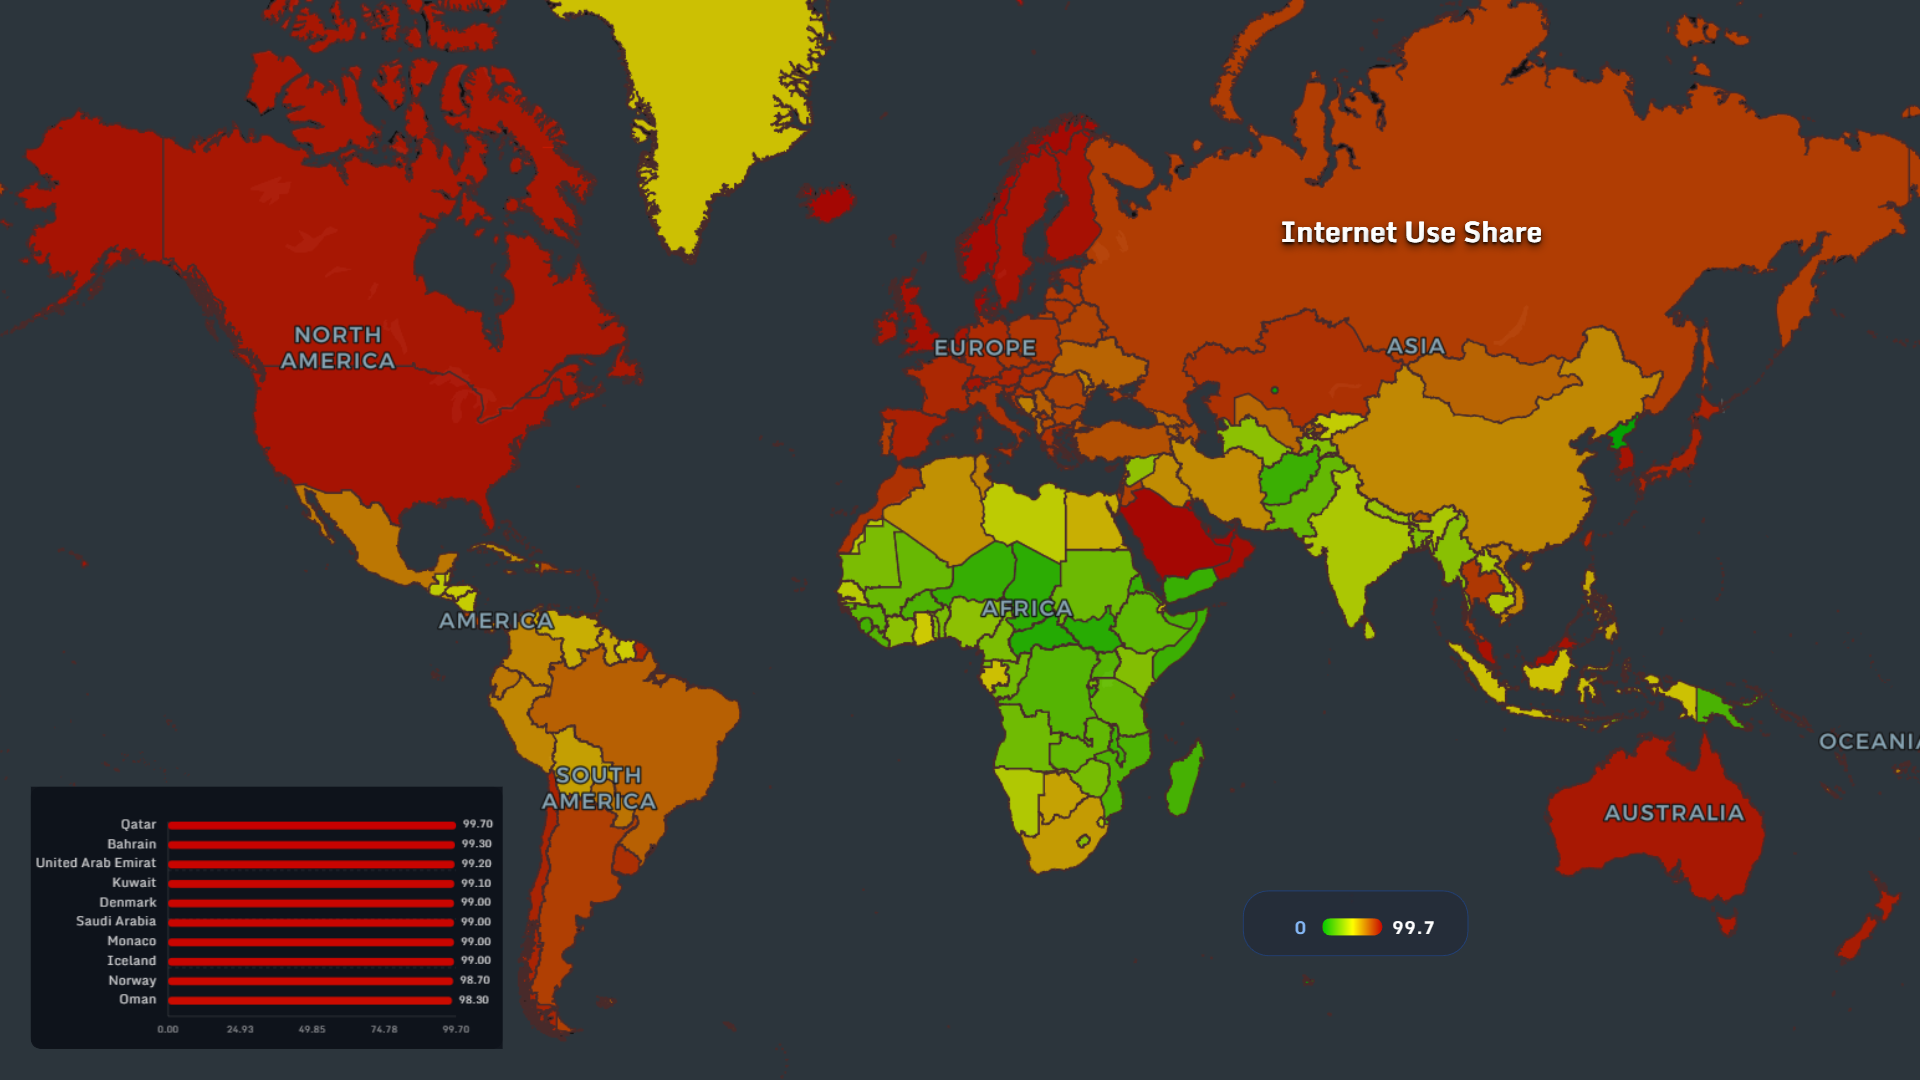
Some regions are fully connected:
- Qatar ~99.7%
- UAE, Denmark, Norway ~99%
But here’s the key shift:
> The question is no longer who is online > but what they can do once connected
🧑💼 Youth Unemployment: The Pressure Layer
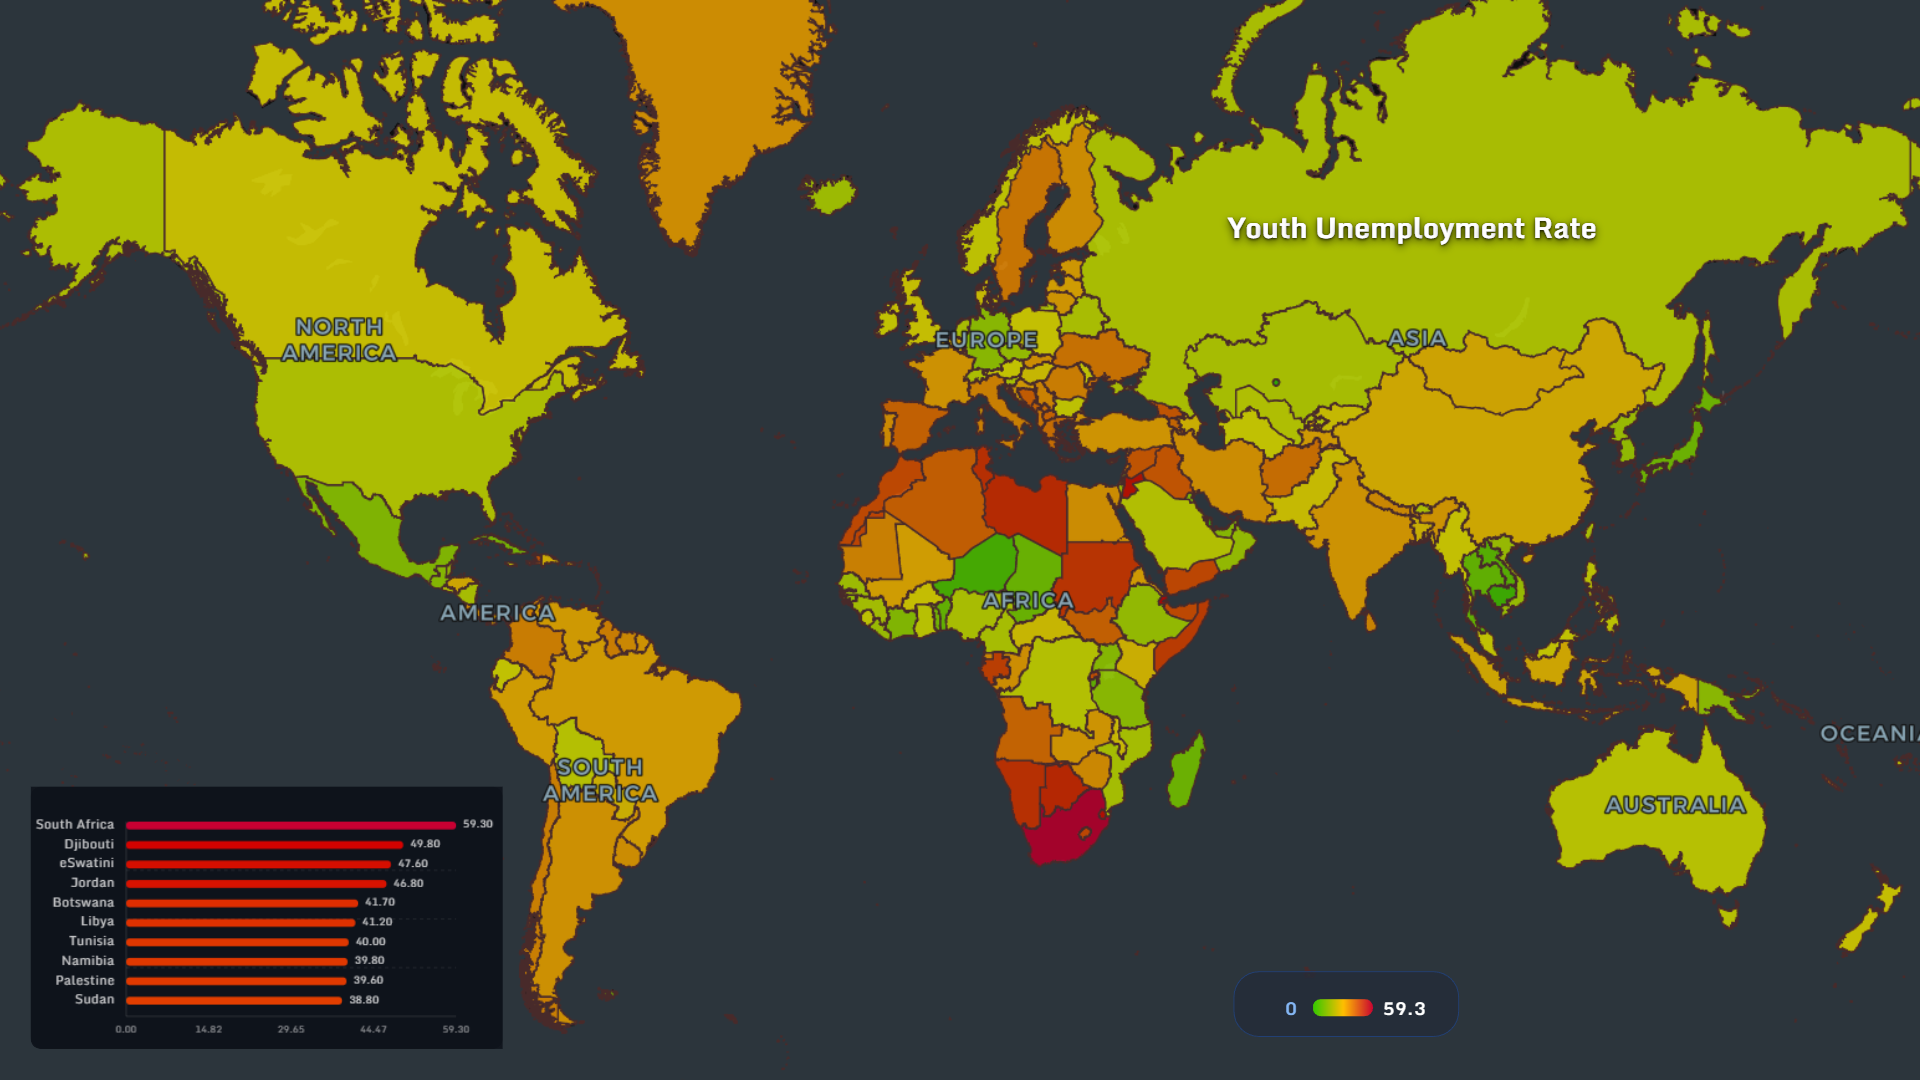
The youth unemployment map 2026 reveals structural stress:
- South Africa ~59%
- Djibouti, Jordan, eSwatini all above 45%
- connected
- aware
- but economically excluded
> access without opportunity
📉 Total Unemployment: Systemic Imbalance
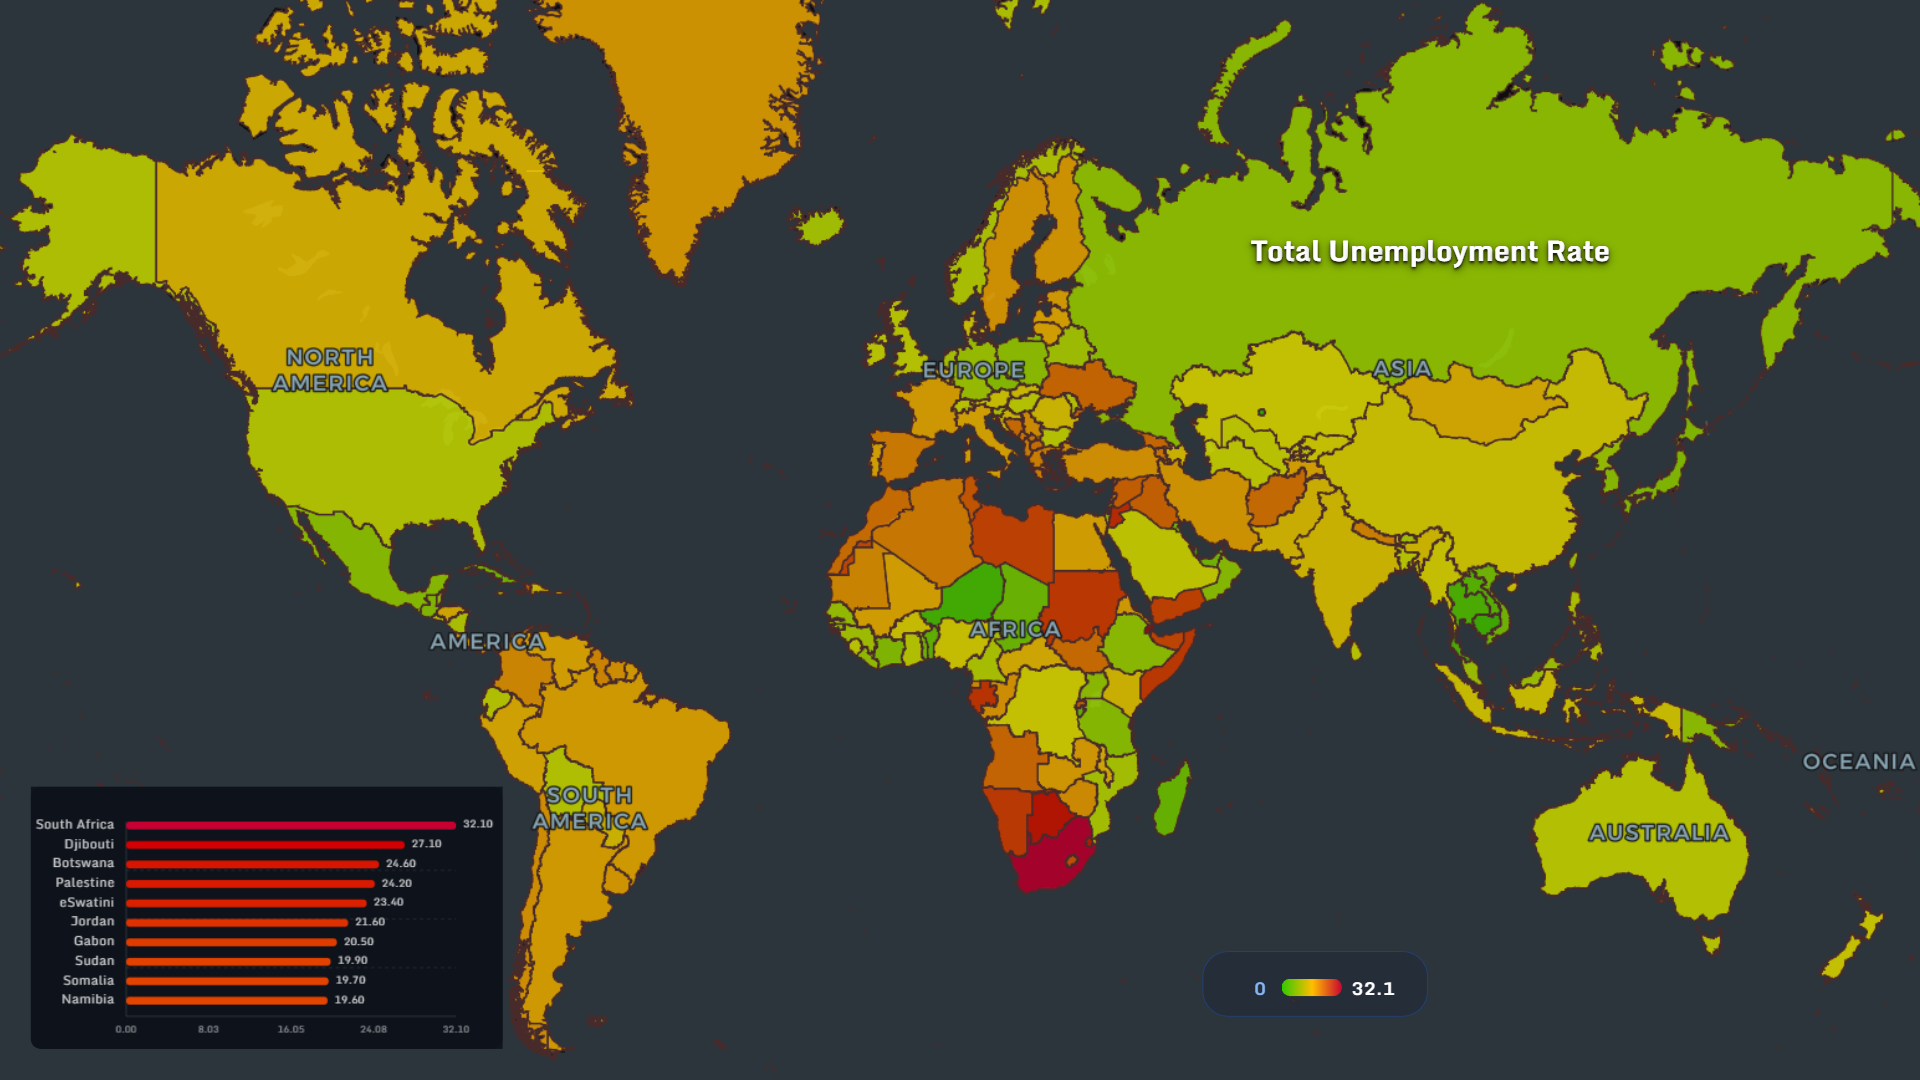
Total unemployment reinforces the same geography:
- Persistent hotspots across Africa
- Moderate levels across Europe
- Lower levels in East Asia
🏭 Industry Employment: Where Jobs Still Exist
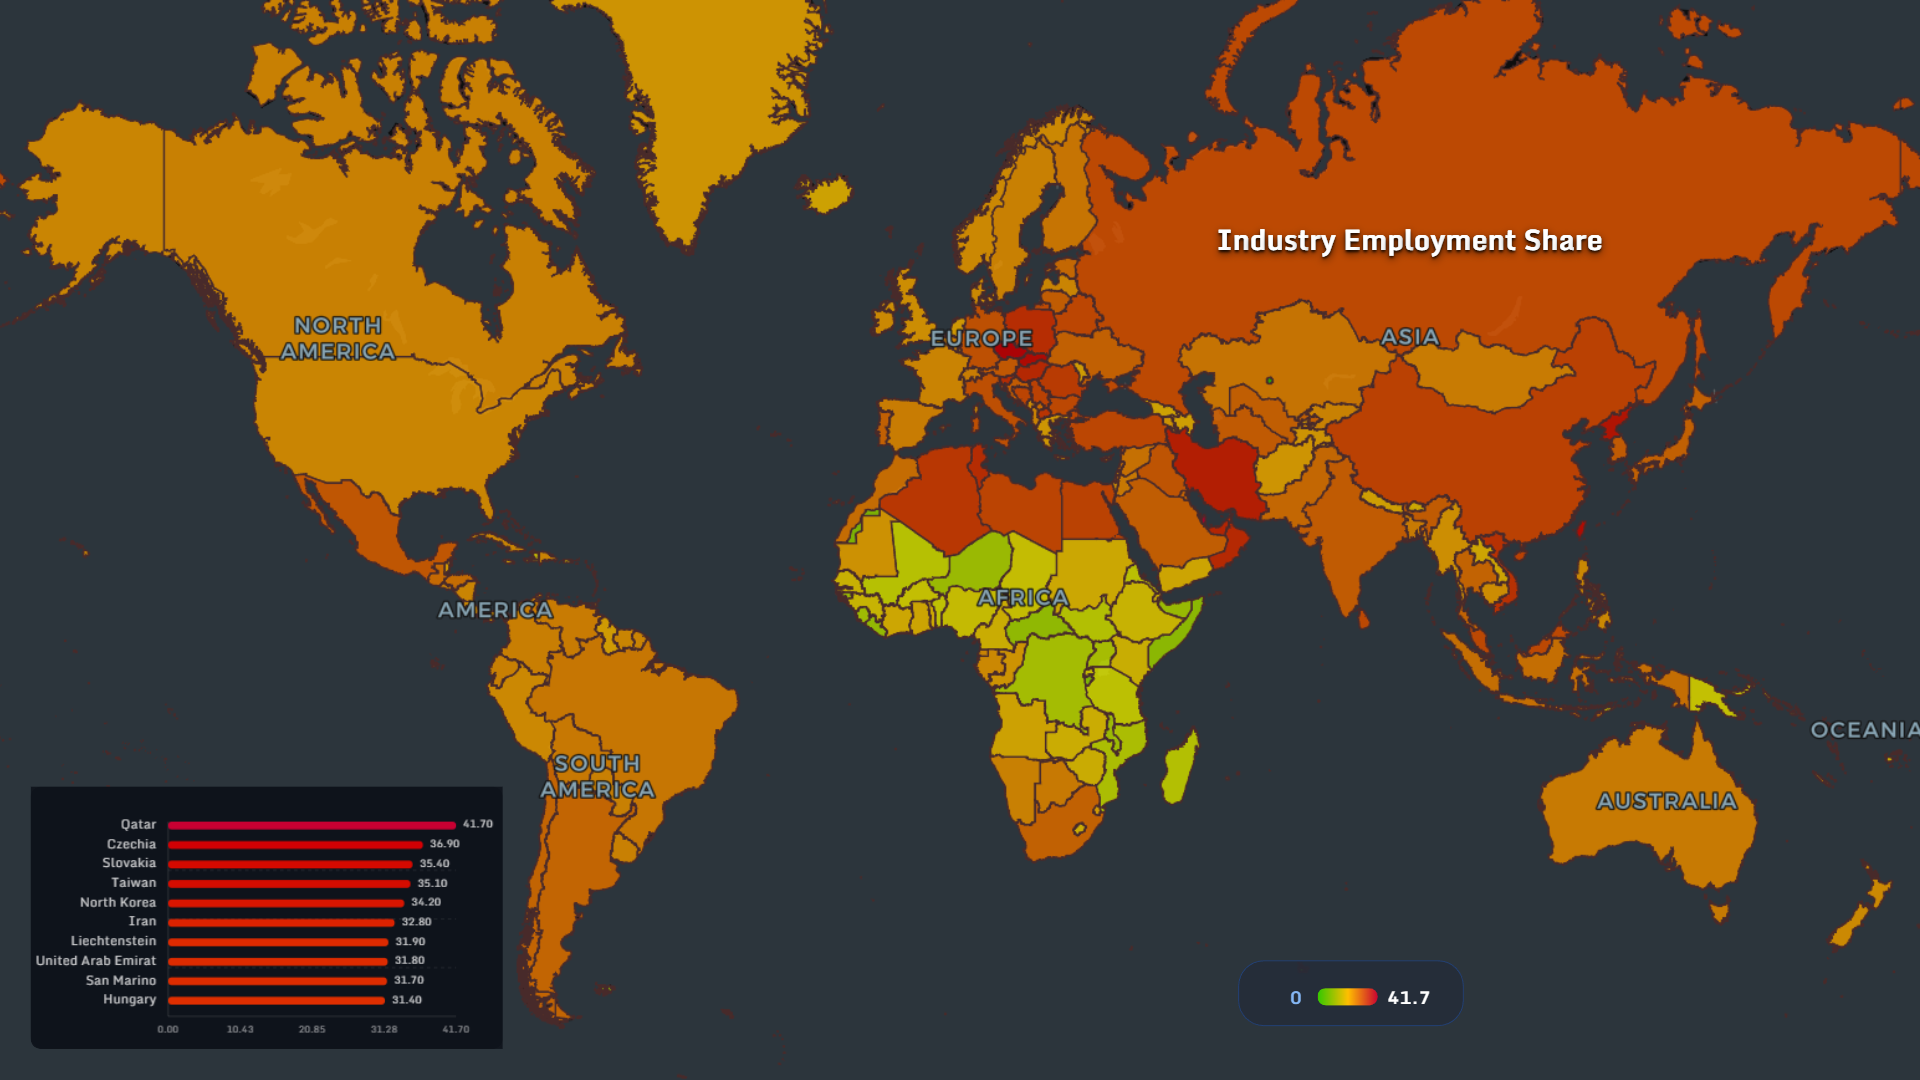
Industry still matters — but unevenly:
- High shares in emerging economies
- Declining importance in highly digital economies
> from labor → automation → services
But not all regions move at the same speed.
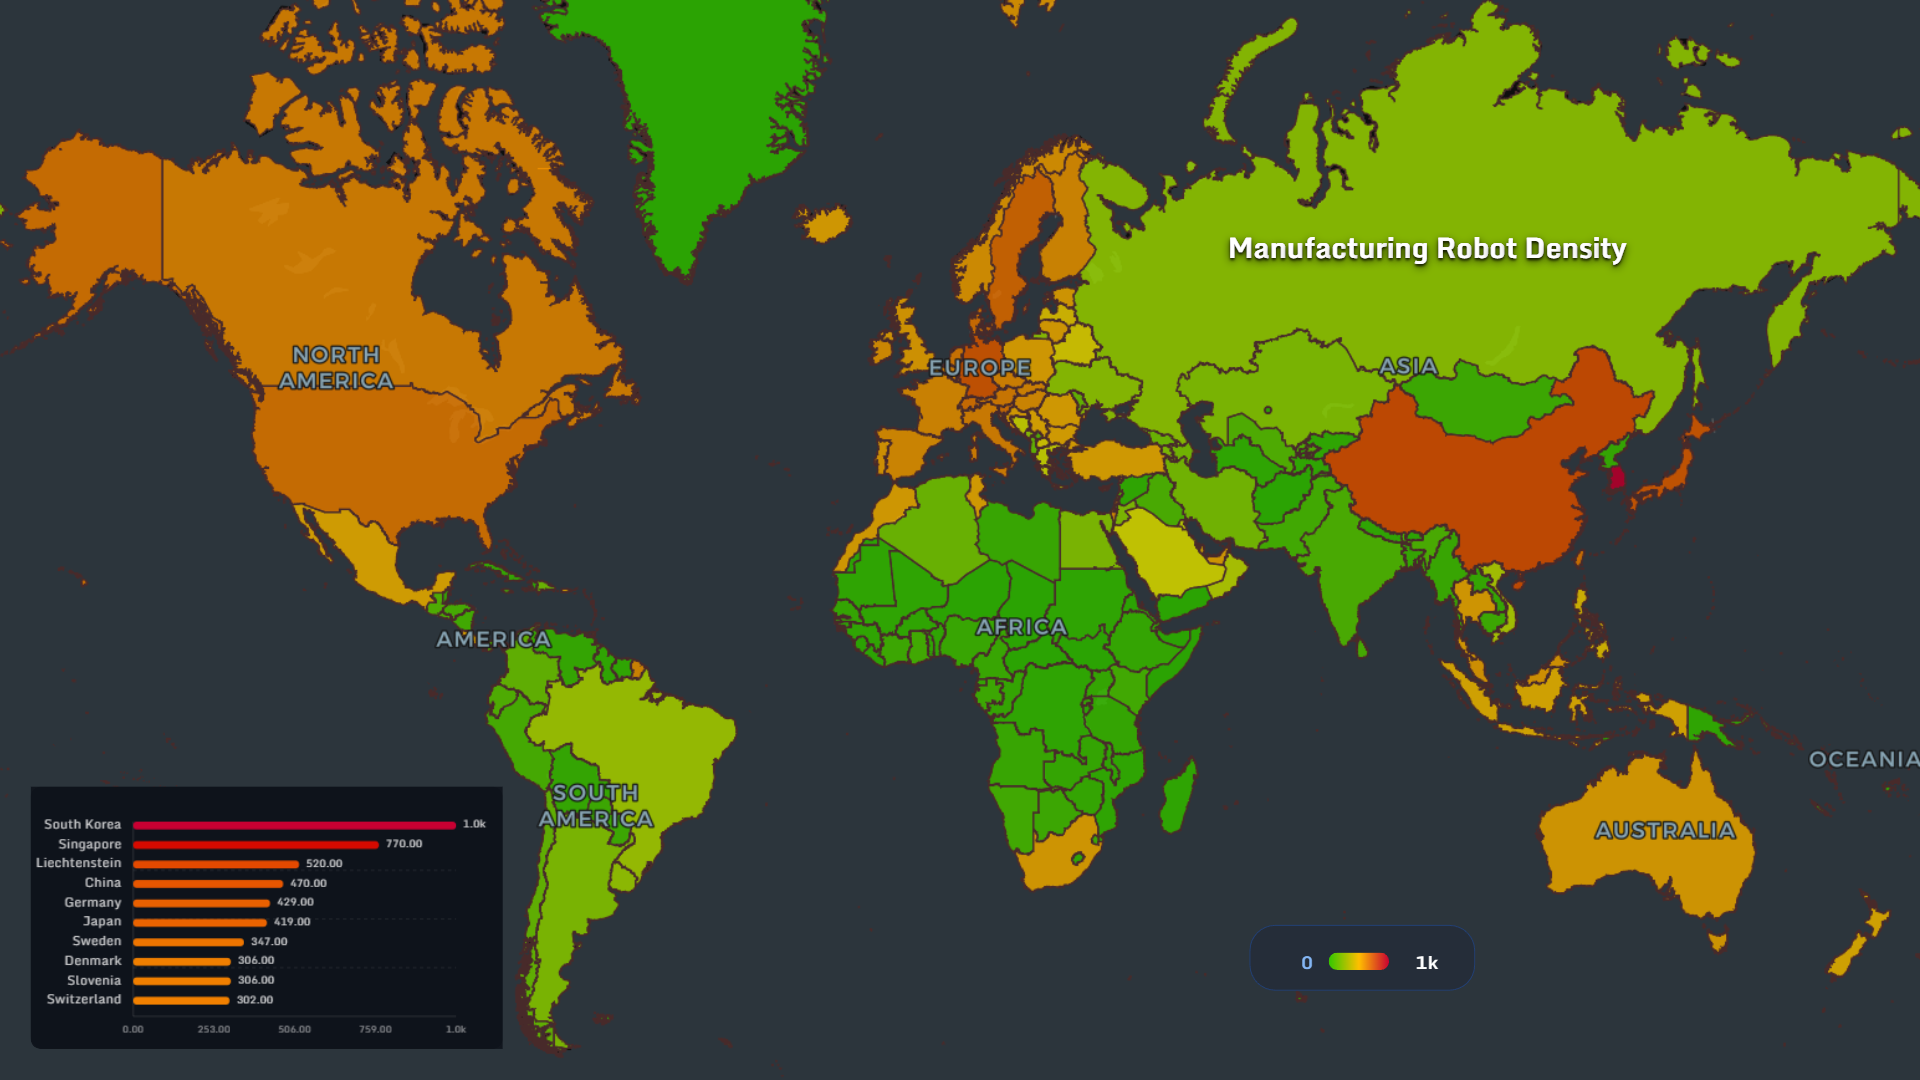
🤖 Automation: The Next Layer of Inequality

The robot density map 2026 shows a stark divide:
- South Korea ~1000 robots / 10k workers
- Singapore ~770
- Germany ~429
Automation is not just efficiency.
It is:
- productivity concentration
- economic leverage
- future dominance
🧠 Final Thought
Put all maps together, and a pattern emerges:
- freedom varies
- access varies
- opportunity varies
- automation accelerates inequality
It is about: > who controls the network — and who benefits from it
👉 Explore more at app.mapthos.org
See the world. Map better. Dream big. 🌍✨