🌍 Mapping the Global Balance: Defense, Welfare, and Debt in 2025
TL;DR / AI Summary
- Mapping the Global Balance: Defense, Welfare, and Debt in 2025 is the focus of this article and is mapped in geographic context.
- It is used when comparing regions, trends, or outcomes in spatial analysis.
- The article explains why the topic matters for interpreting patterns.
- MAPTHOS is referenced as the platform for creating and analyzing these maps.
Definition and context
What it is: Mapping the Global Balance: Defense, Welfare, and Debt in 2025 is the subject of this article, framed as a geographic data topic for analysis. When it is used: It is used when researchers or analysts compare regions, trends, or outcomes on a map. Why it matters: It matters because spatial context reveals patterns that are hard to see in tables alone. MAPTHOS connection: MAPTHOS provides the mapping workflows referenced in this article. See Features.In 2025, the world's budgets tell stories of fear, care, and legacy. Every percent of GDP, every billion in spending, is a reflection of national priorities — and a mirror of what societies choose to protect: borders, citizens, or the future itself.
🪖 Military Expenditure (% of GDP, 2024–2025)
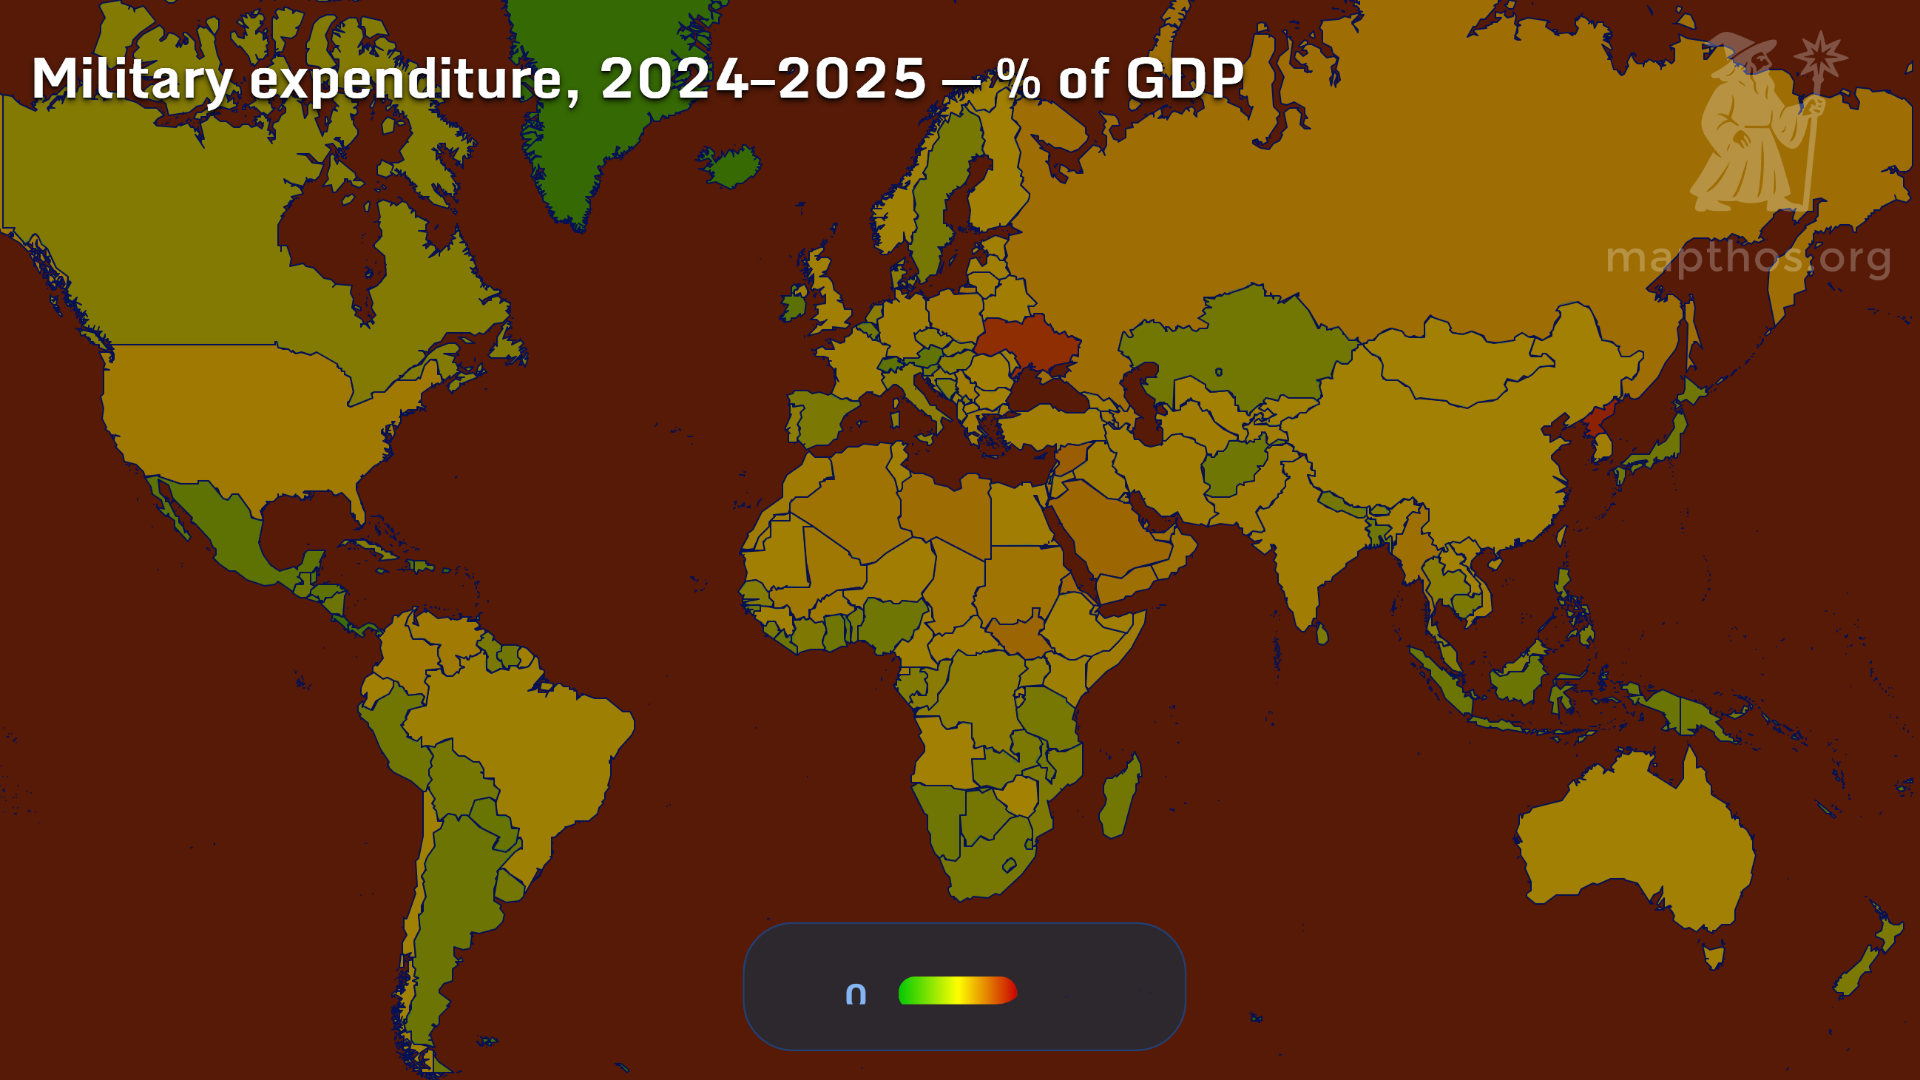
A handful of nations still devote outsized shares of their economies to defense — a reminder that peace remains expensive. In 2025, Ukraine and Israel lead global defense intensity, with spending surpassing 5% of GDP, reflecting ongoing conflicts and heightened security risks. Meanwhile, major economies like the United States, China, and Russia maintain stable yet massive military budgets, their influence extending beyond borders.
Across much of Europe and Latin America, defense spending hovers between 1–2% of GDP — signaling both economic restraint and geopolitical dependence on alliances like NATO.
💸 Social Benefits (2024, USD billions)
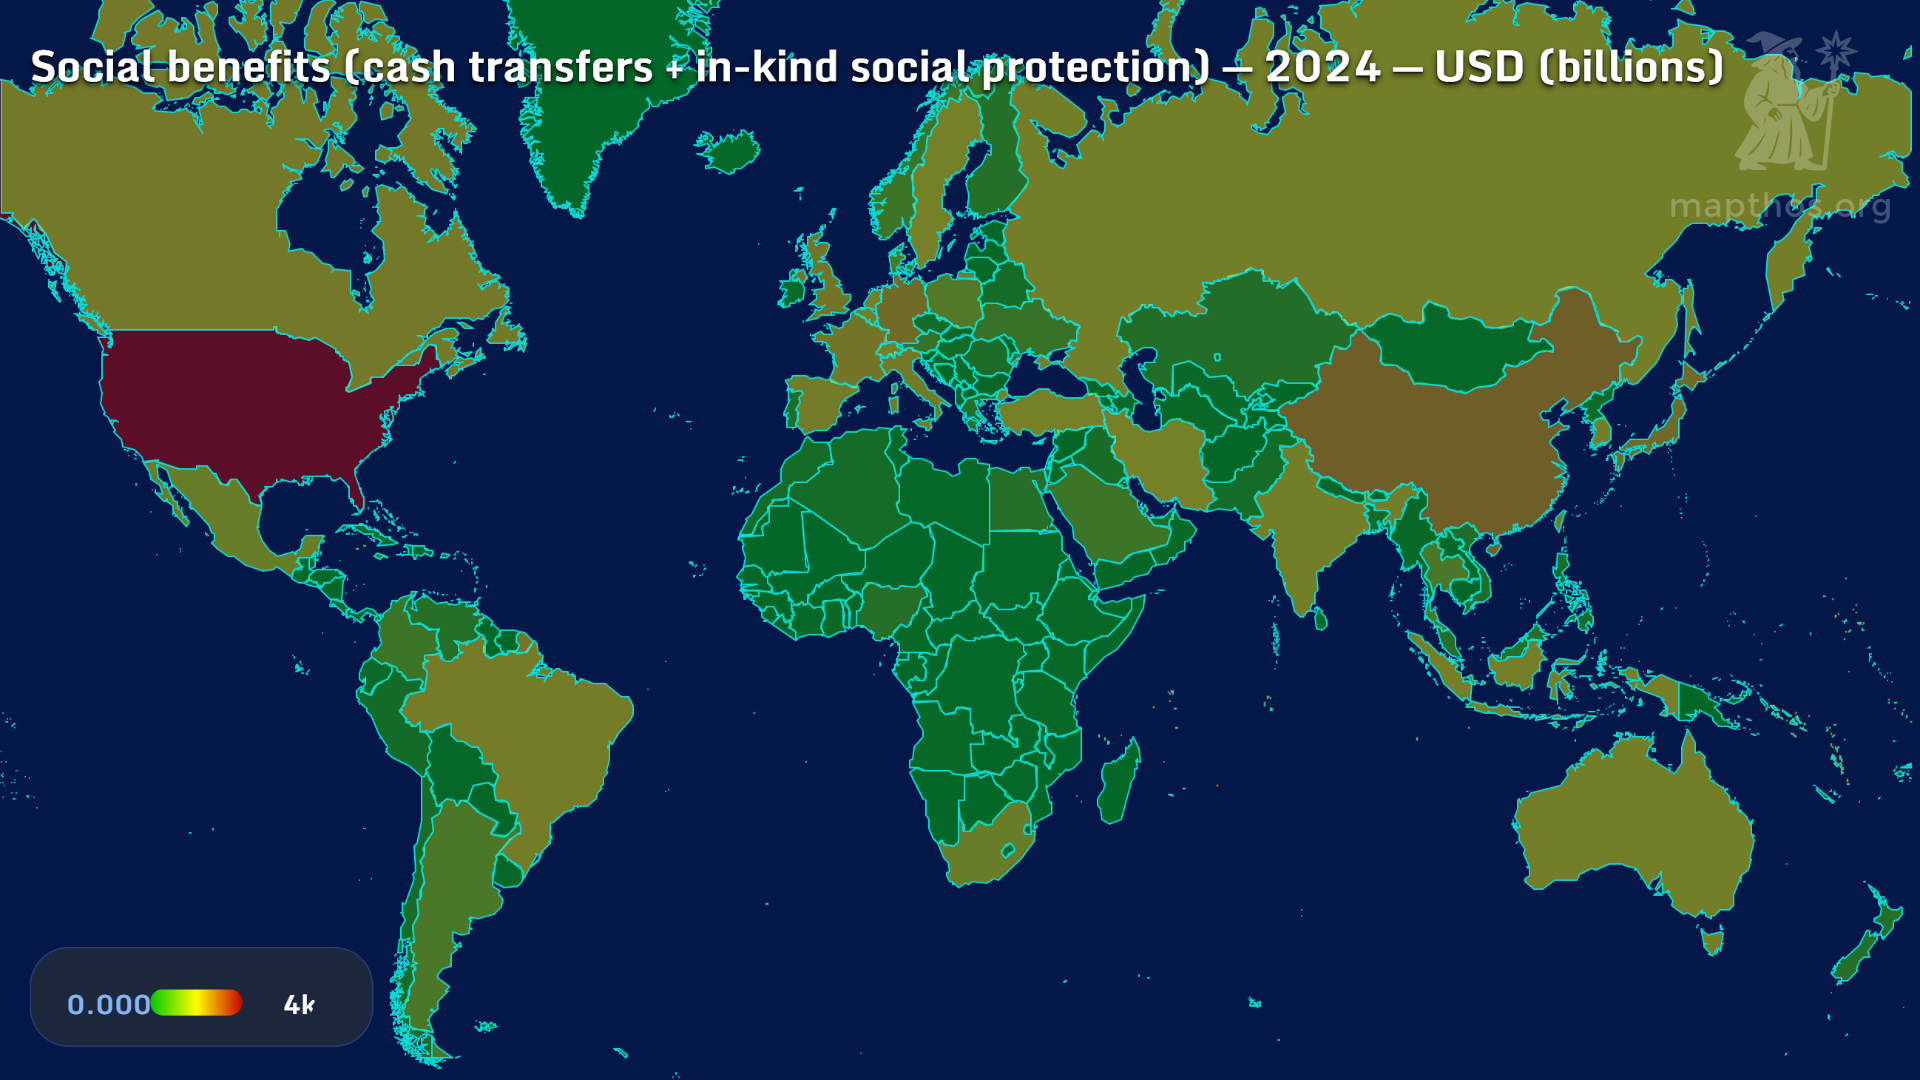
The world’s most generous hands belong to the wealthiest nations. The United States, Germany, France, and Japan collectively spend trillions on social transfers and protection — from pensions to healthcare and unemployment. This map reveals a striking asymmetry: while richer countries can afford welfare cushions, lower-income nations still rely on informal networks and limited state support.
As automation and aging collide, welfare spending becomes both a moral choice and an economic lifeline.
👴 Pension Obligations (2024, USD billions)
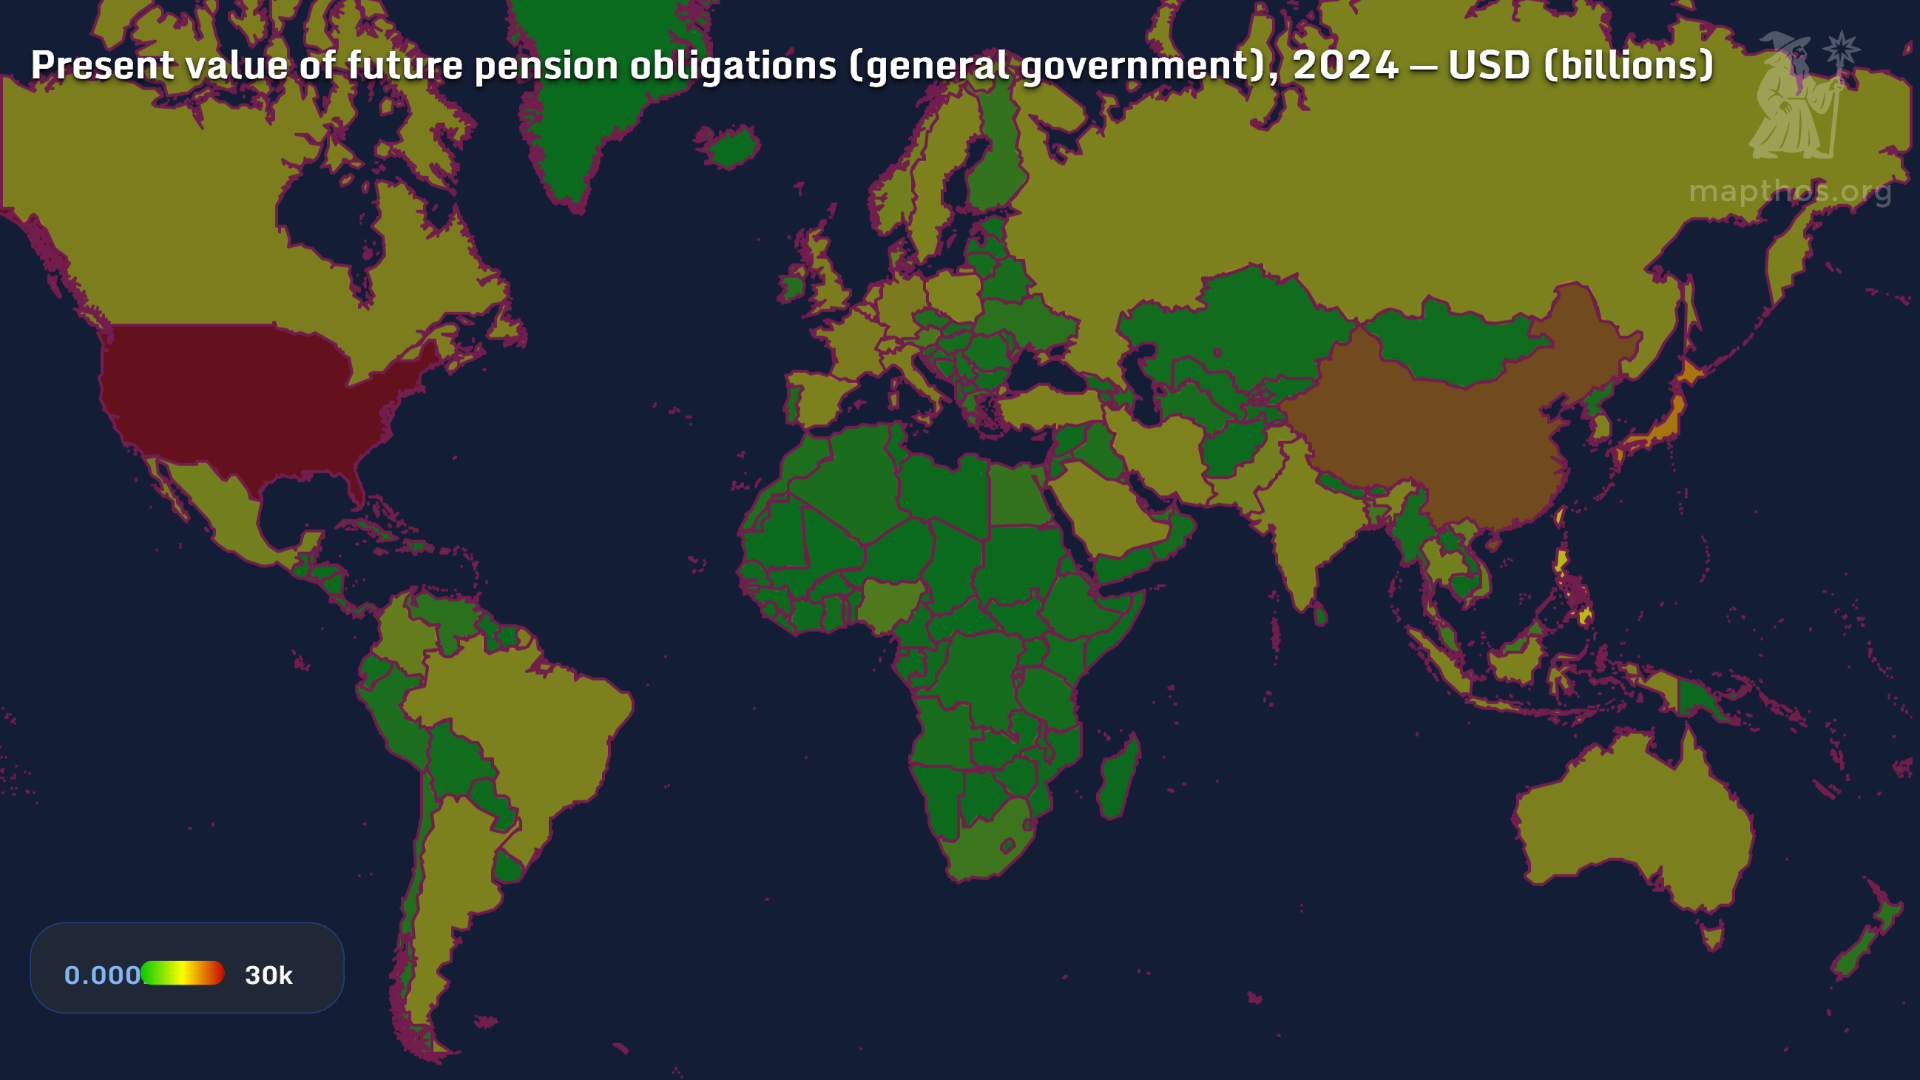
The promise of retirement carries a heavy price. In countries like the United States, China, and Japan, future pension liabilities stretch into tens of trillions of dollars, dwarfing annual GDP. This “gray debt” — invisible in day-to-day budgets — represents tomorrow’s fiscal storm, as populations age faster than reforms arrive.
Developing nations, with younger demographics, still have time — but not immunity — from this demographic wave.
💰 Central Government Debt (Local Currency Billions, End-2025)
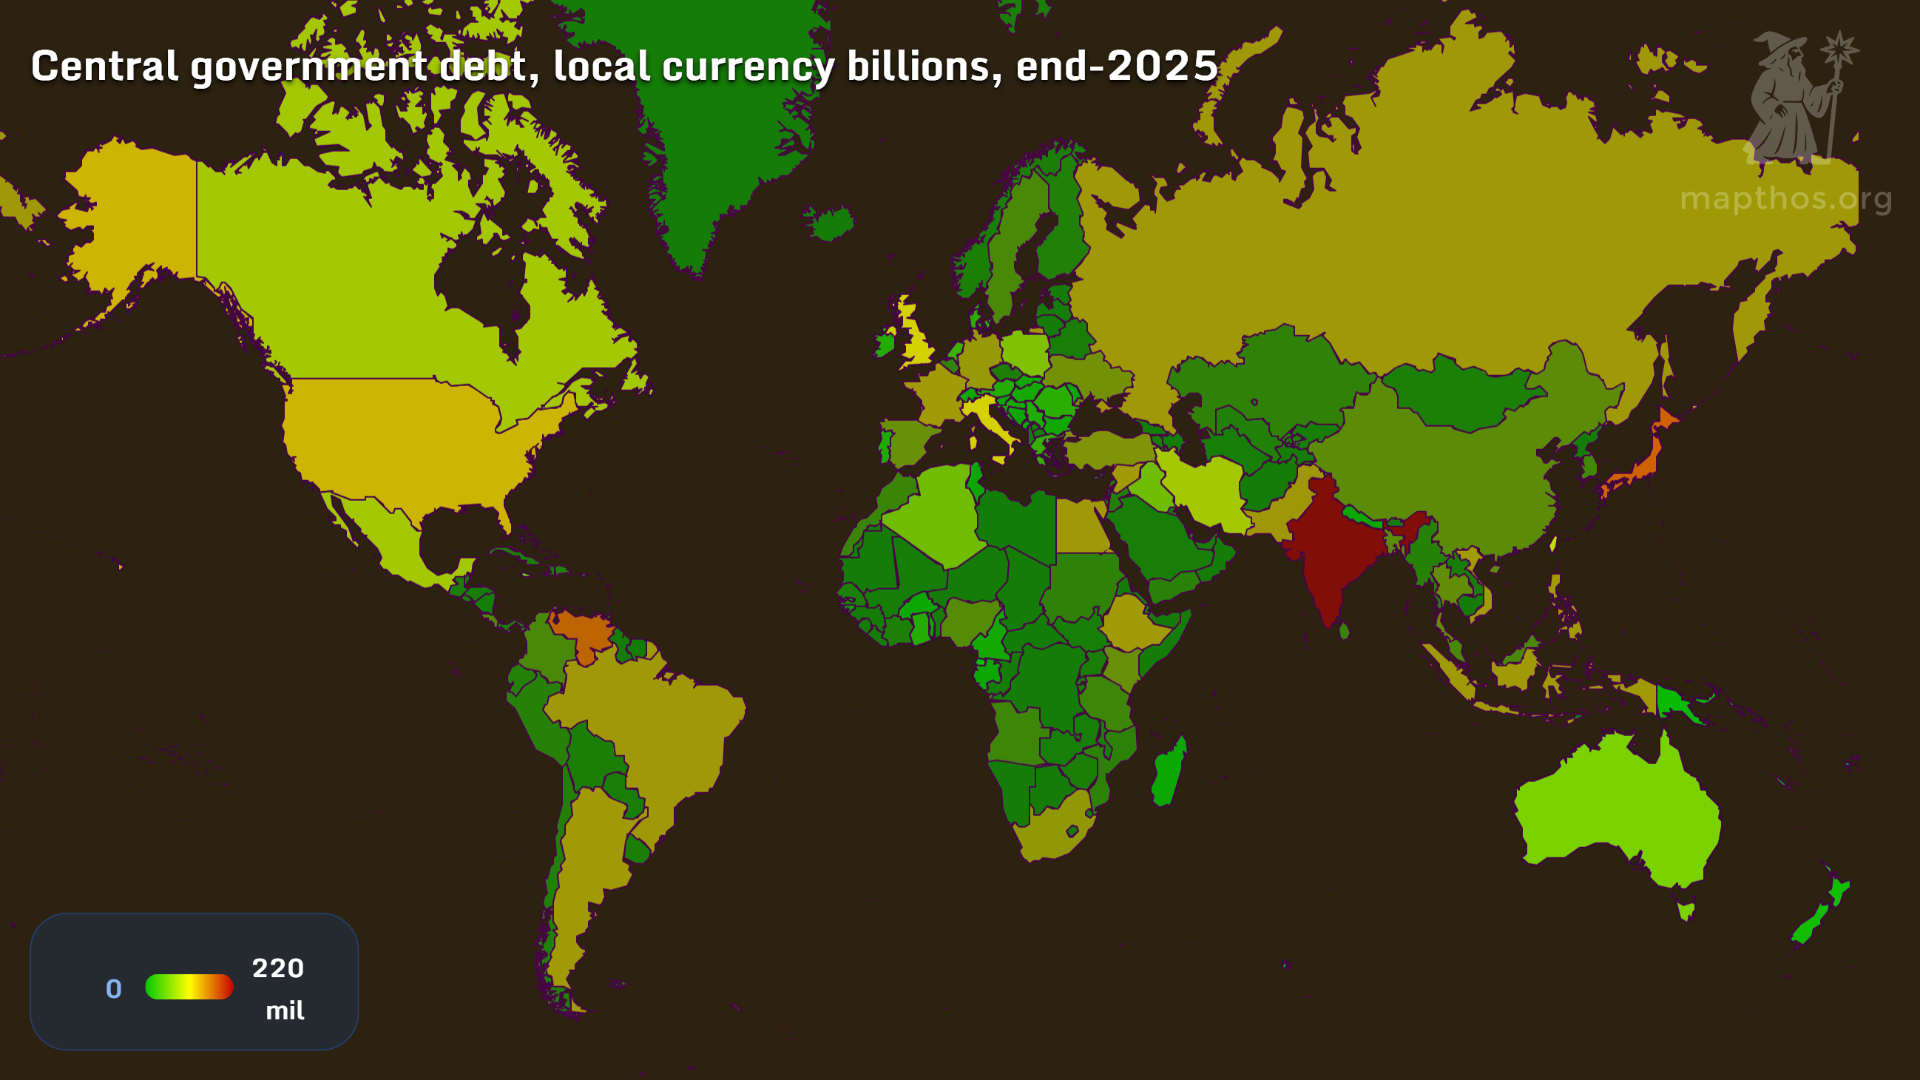
Debt is the silent engine of modern governance. From India and Japan to the United States, government borrowing remains the main instrument to balance welfare and defense without raising taxes. Yet behind these vast sums lie questions of sustainability — and sovereignty.
Emerging economies, though smaller in nominal figures, often carry heavier burdens due to currency volatility and limited fiscal space.
📉 Government Debt as % of GDP (2025)
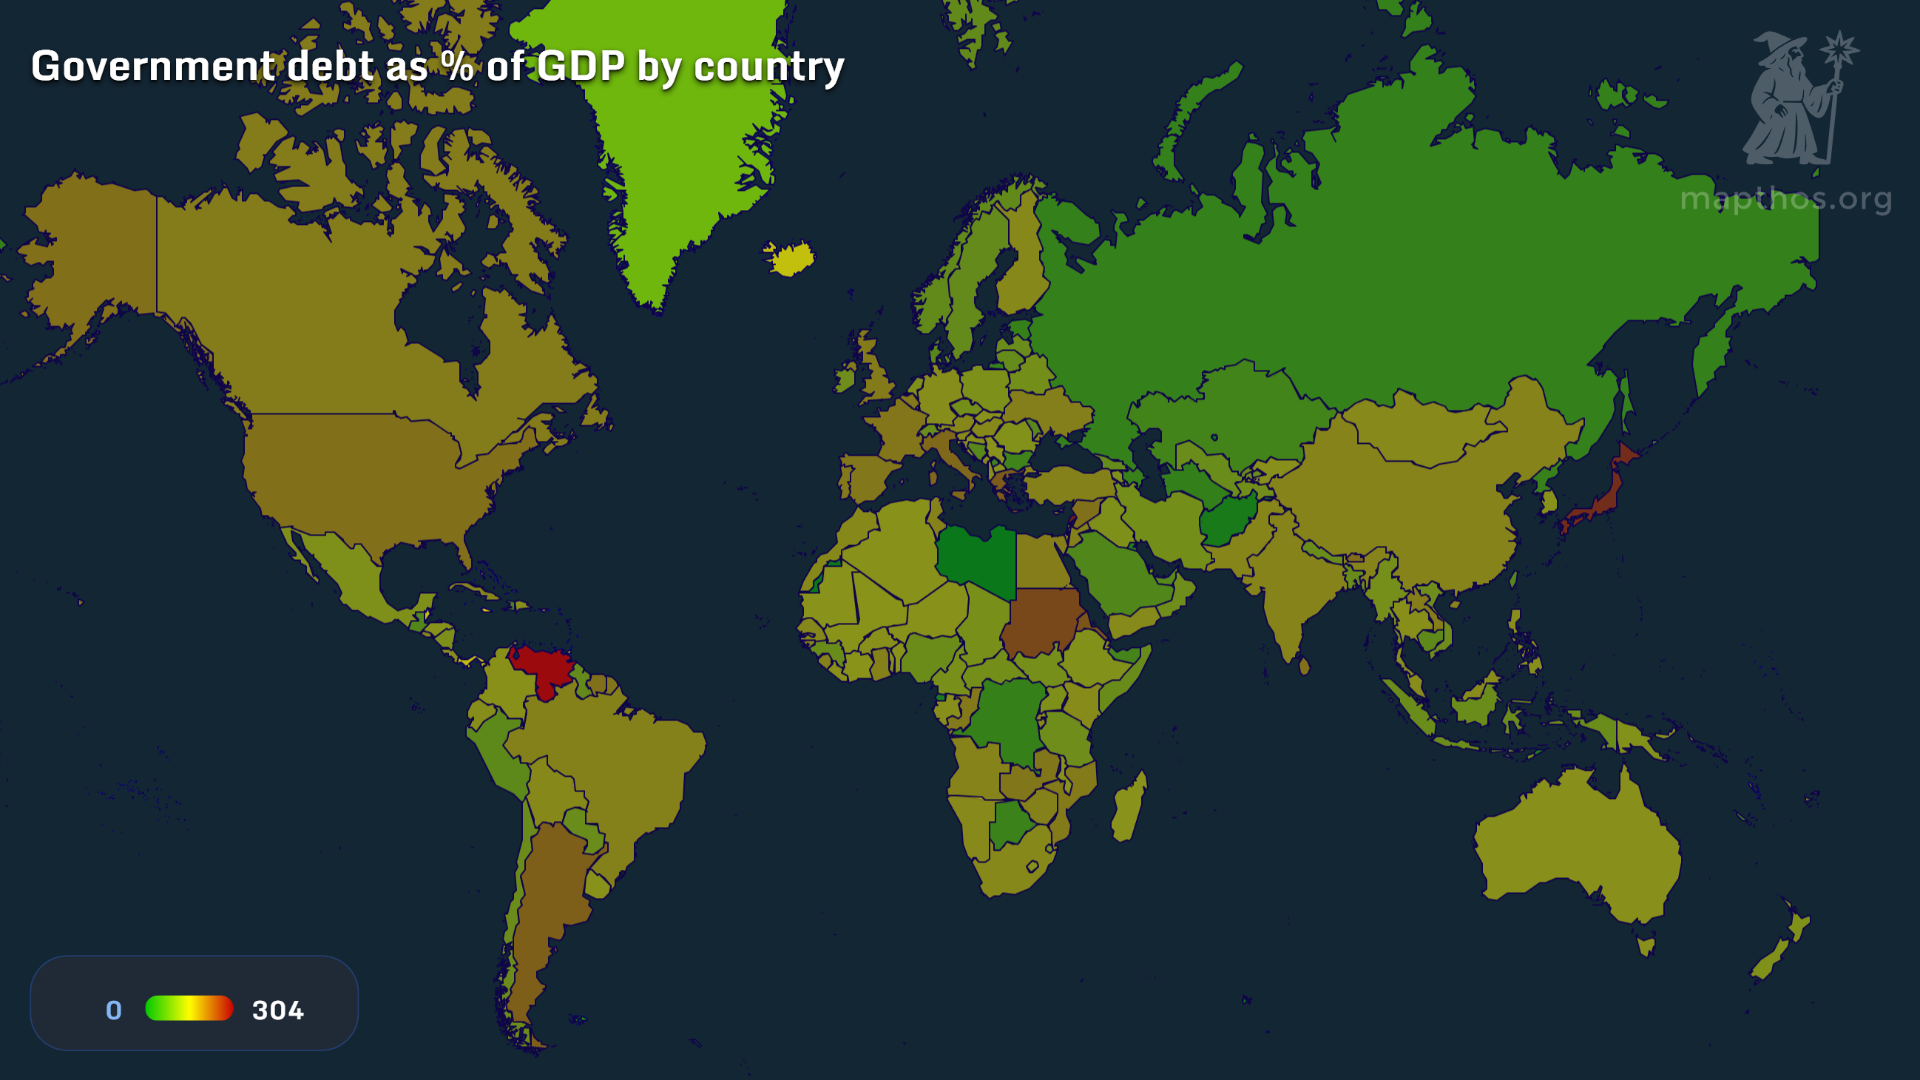
As a share of GDP, debt reveals not just how much is owed, but how much can be endured. Japan continues to hold the world record — debt exceeding 250% of GDP — while Venezuela and Sudan struggle under collapsing fiscal credibility. In contrast, Nordic countries and Central Asia maintain relatively low ratios, proving that fiscal discipline and strong institutions still matter in turbulent times.
🧭 The Human Equation
Behind every trillion-dollar figure are choices — between defense and dignity, between growth and generational fairness. Mapping these balances helps us see beyond politics into priorities — where numbers reveal not just policy, but philosophy.
👉 Explore more at app.mapthos.org
See the world. Map better. Dream big. 🌍✨