
🌍 Global Aging Map 2026: How the World Is Growing Older
Aging is no longer a future scenario — it is a defining global trend of 2026.
From Tokyo to Berlin, from New York to Shanghai, societies are entering a new phase where longevity, chronic disease, and cognitive decline are becoming central to policy, economics, and daily life.
This global aging map 2026 reveals something deeper than numbers: 👉 it shows how differently humanity experiences time.
🧠 Dementia Economic Burden by Country (2026)
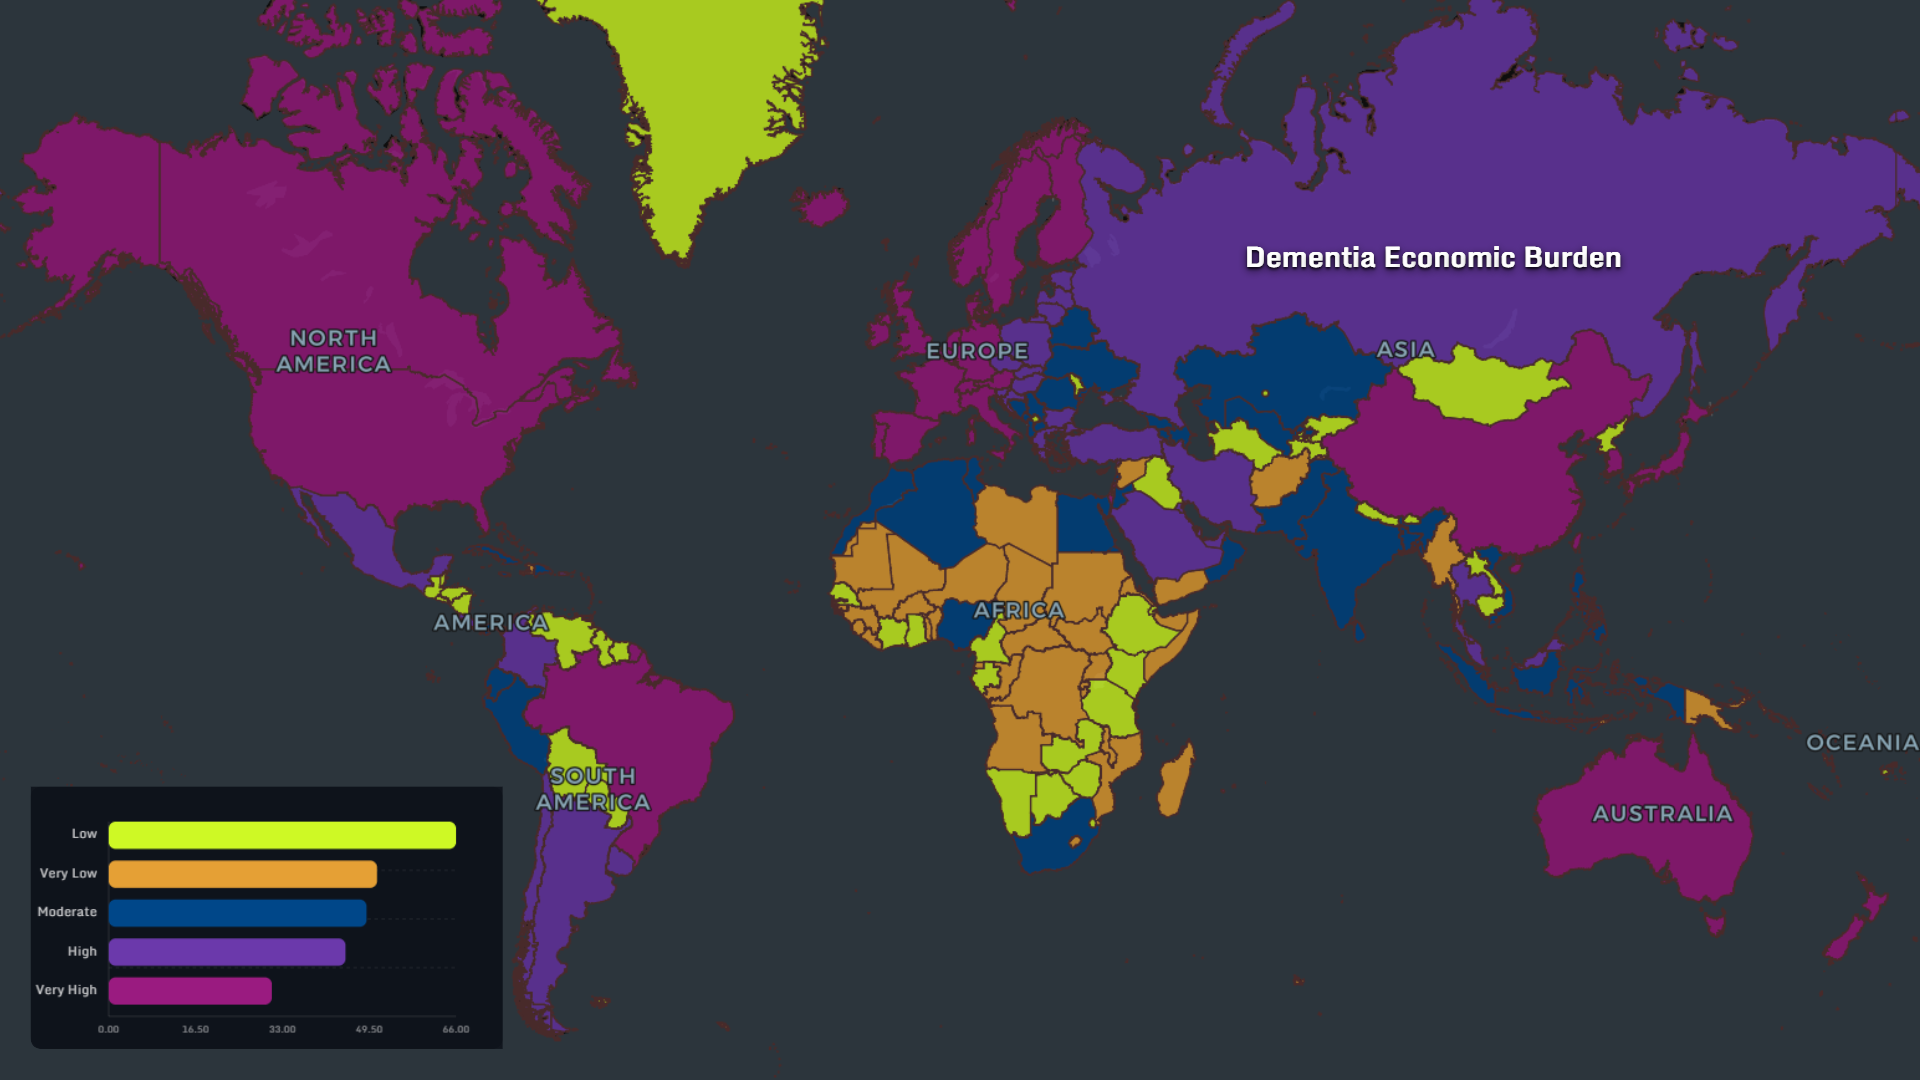
The dementia economic burden map 2026 highlights a clear global gradient:
- Very high burden: USA, Canada, Western Europe, Australia
- Rapidly growing costs: Eastern Europe, China
- Underestimated burden: Africa and parts of South Asia
👉 In 2026, dementia is both a medical condition and a multi-trillion-dollar economic force.
👂 Hearing Loss in the 65+ Population
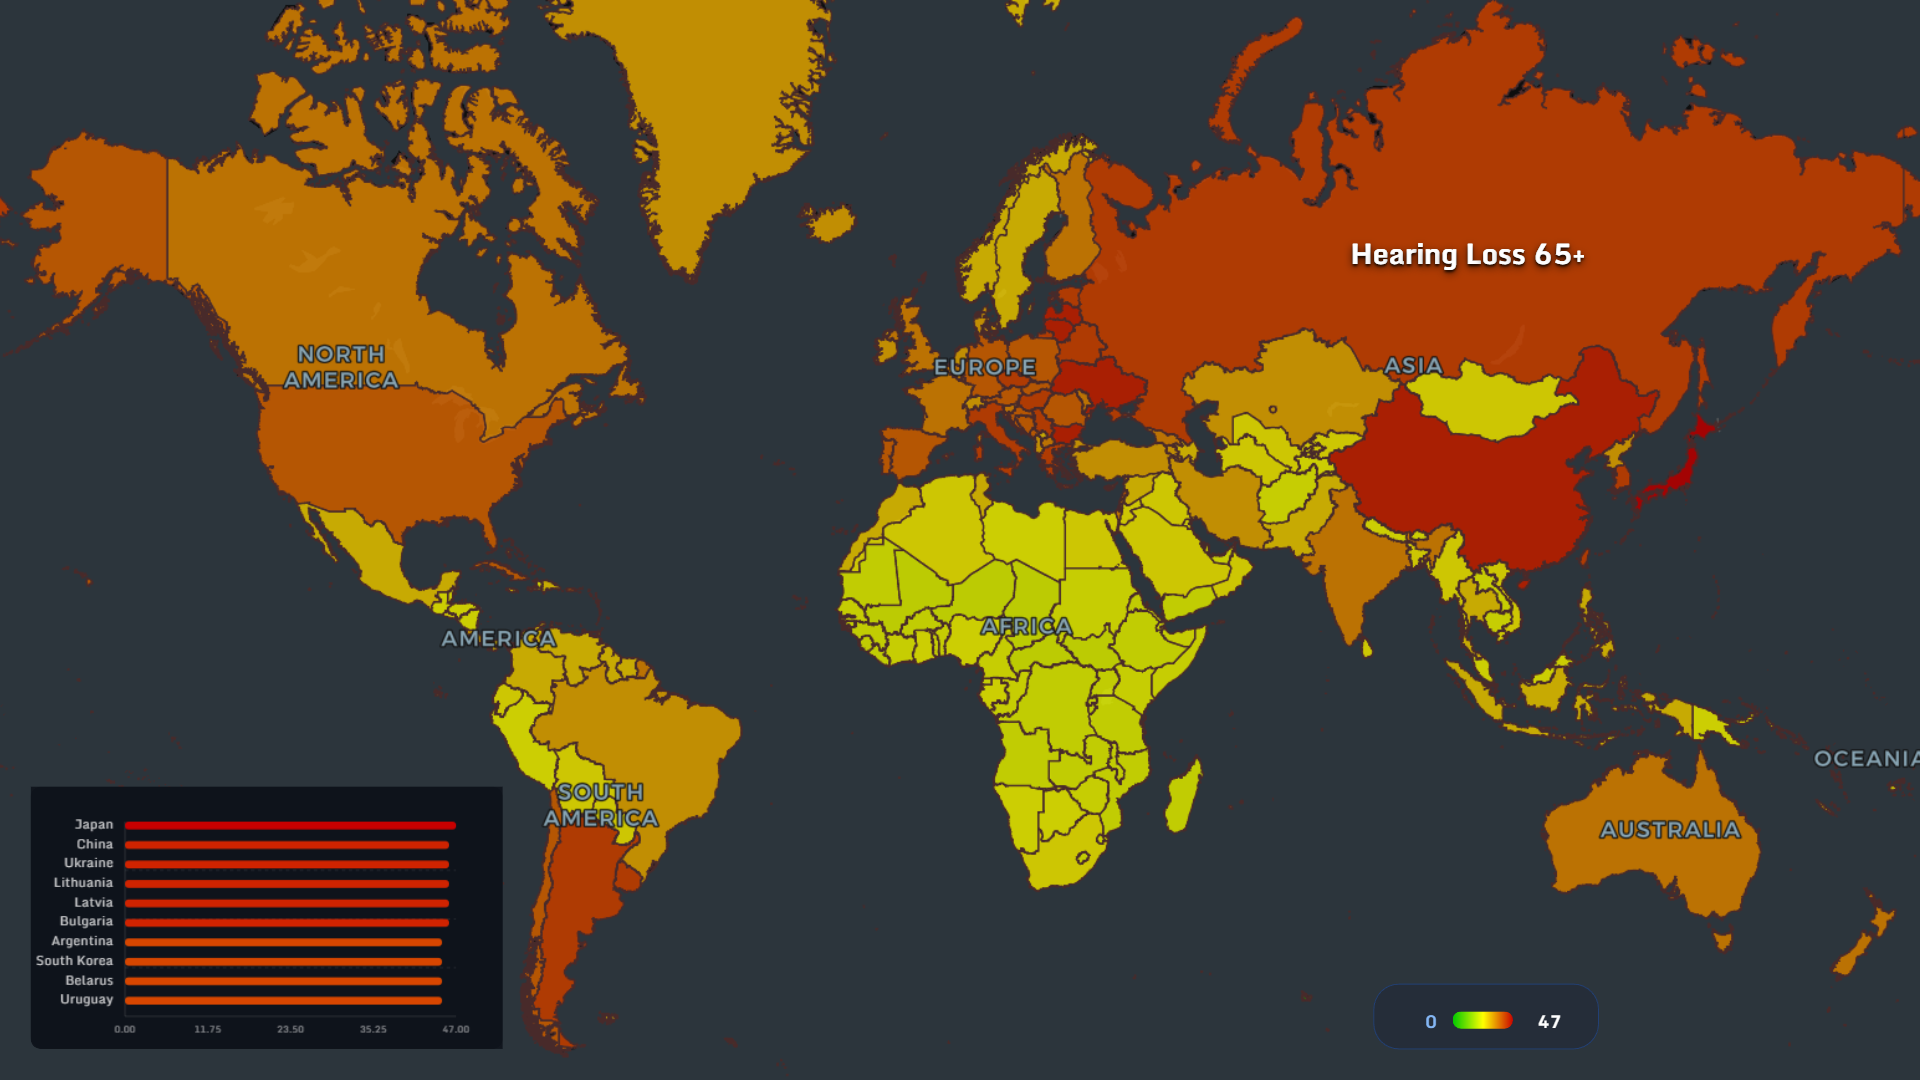
The hearing loss prevalence map 2026 reveals:
- High rates in Japan, China, Eastern Europe
- Moderate in Western countries
- Lower reported levels in Africa
- Longer life expectancy
- Urban noise exposure
- Industrial history
👵 Population Aged 80+ (Longevity Map 2026)
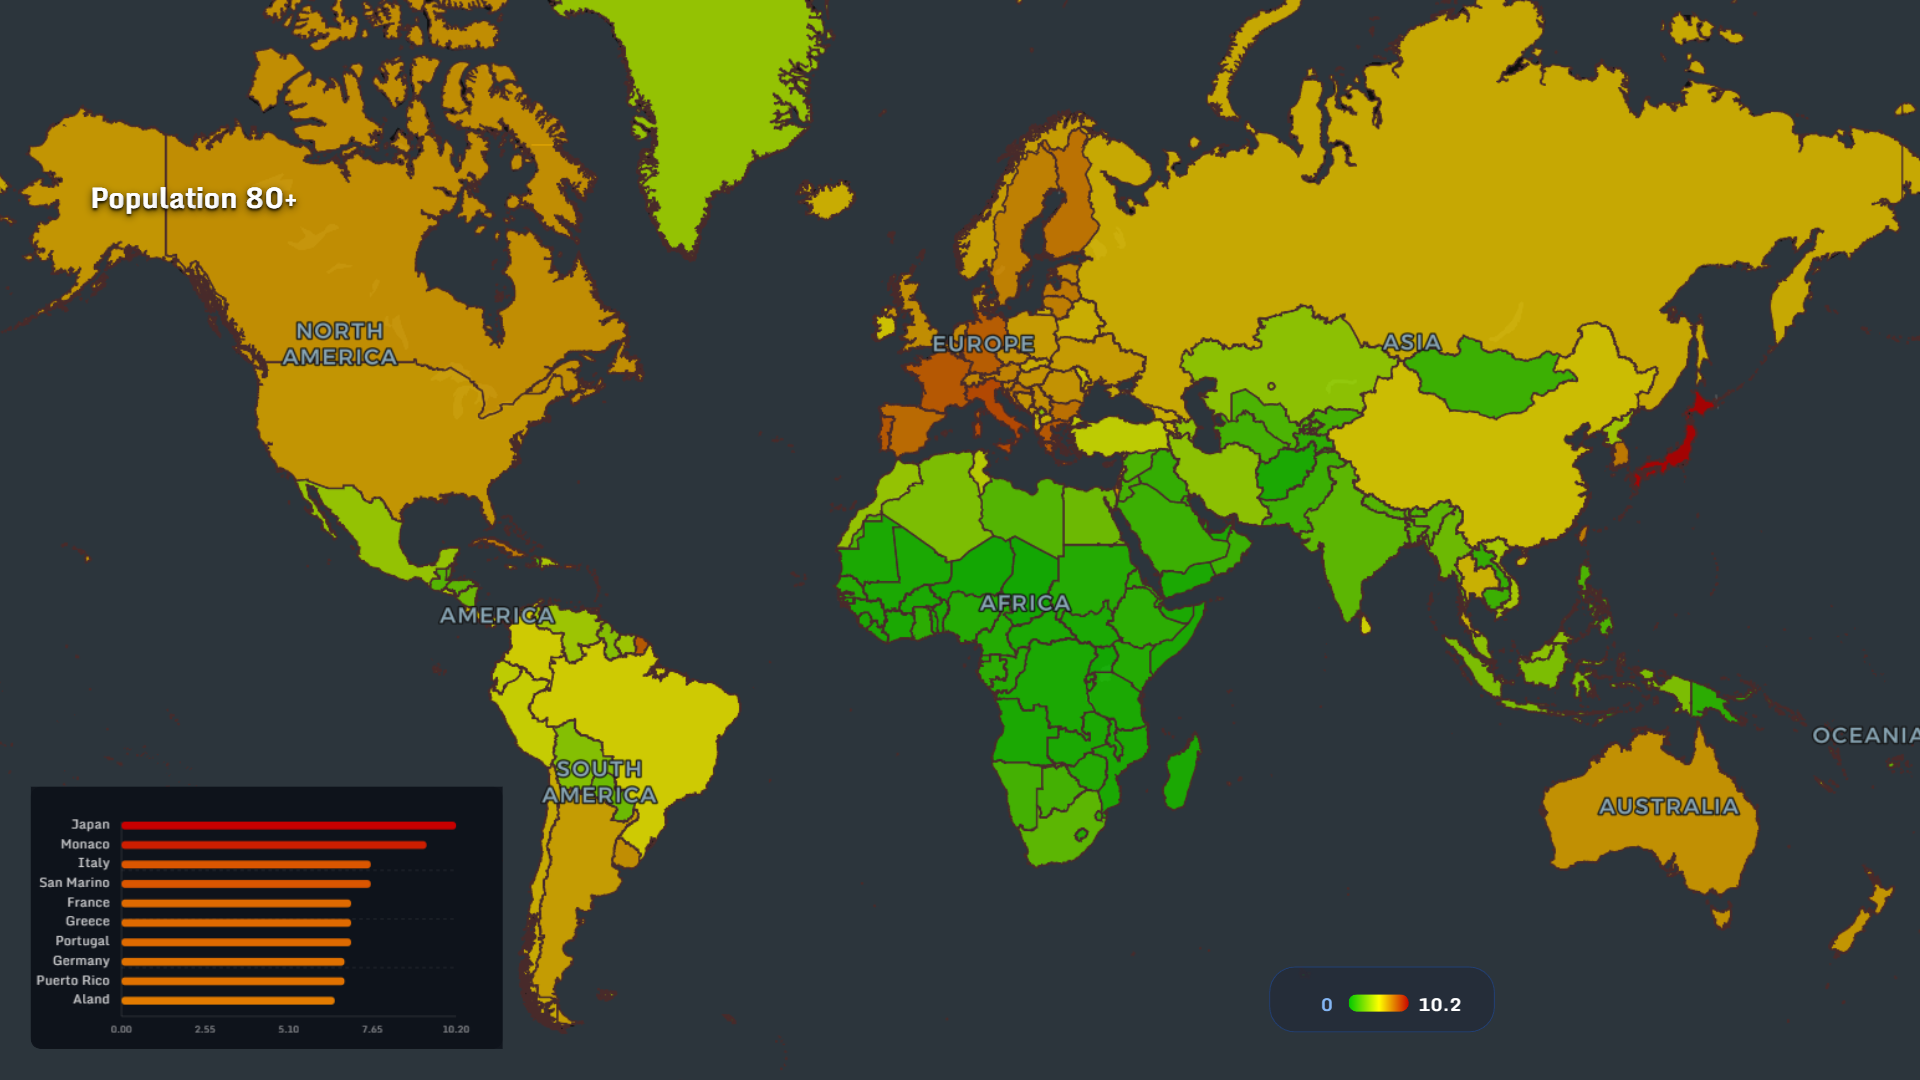
The longevity map 2026 shows where people live longest:
- Japan, Italy, France remain global leaders
- Europe forms the densest aging cluster
- Africa remains the youngest region
⚖️ Obesity in Older Adults
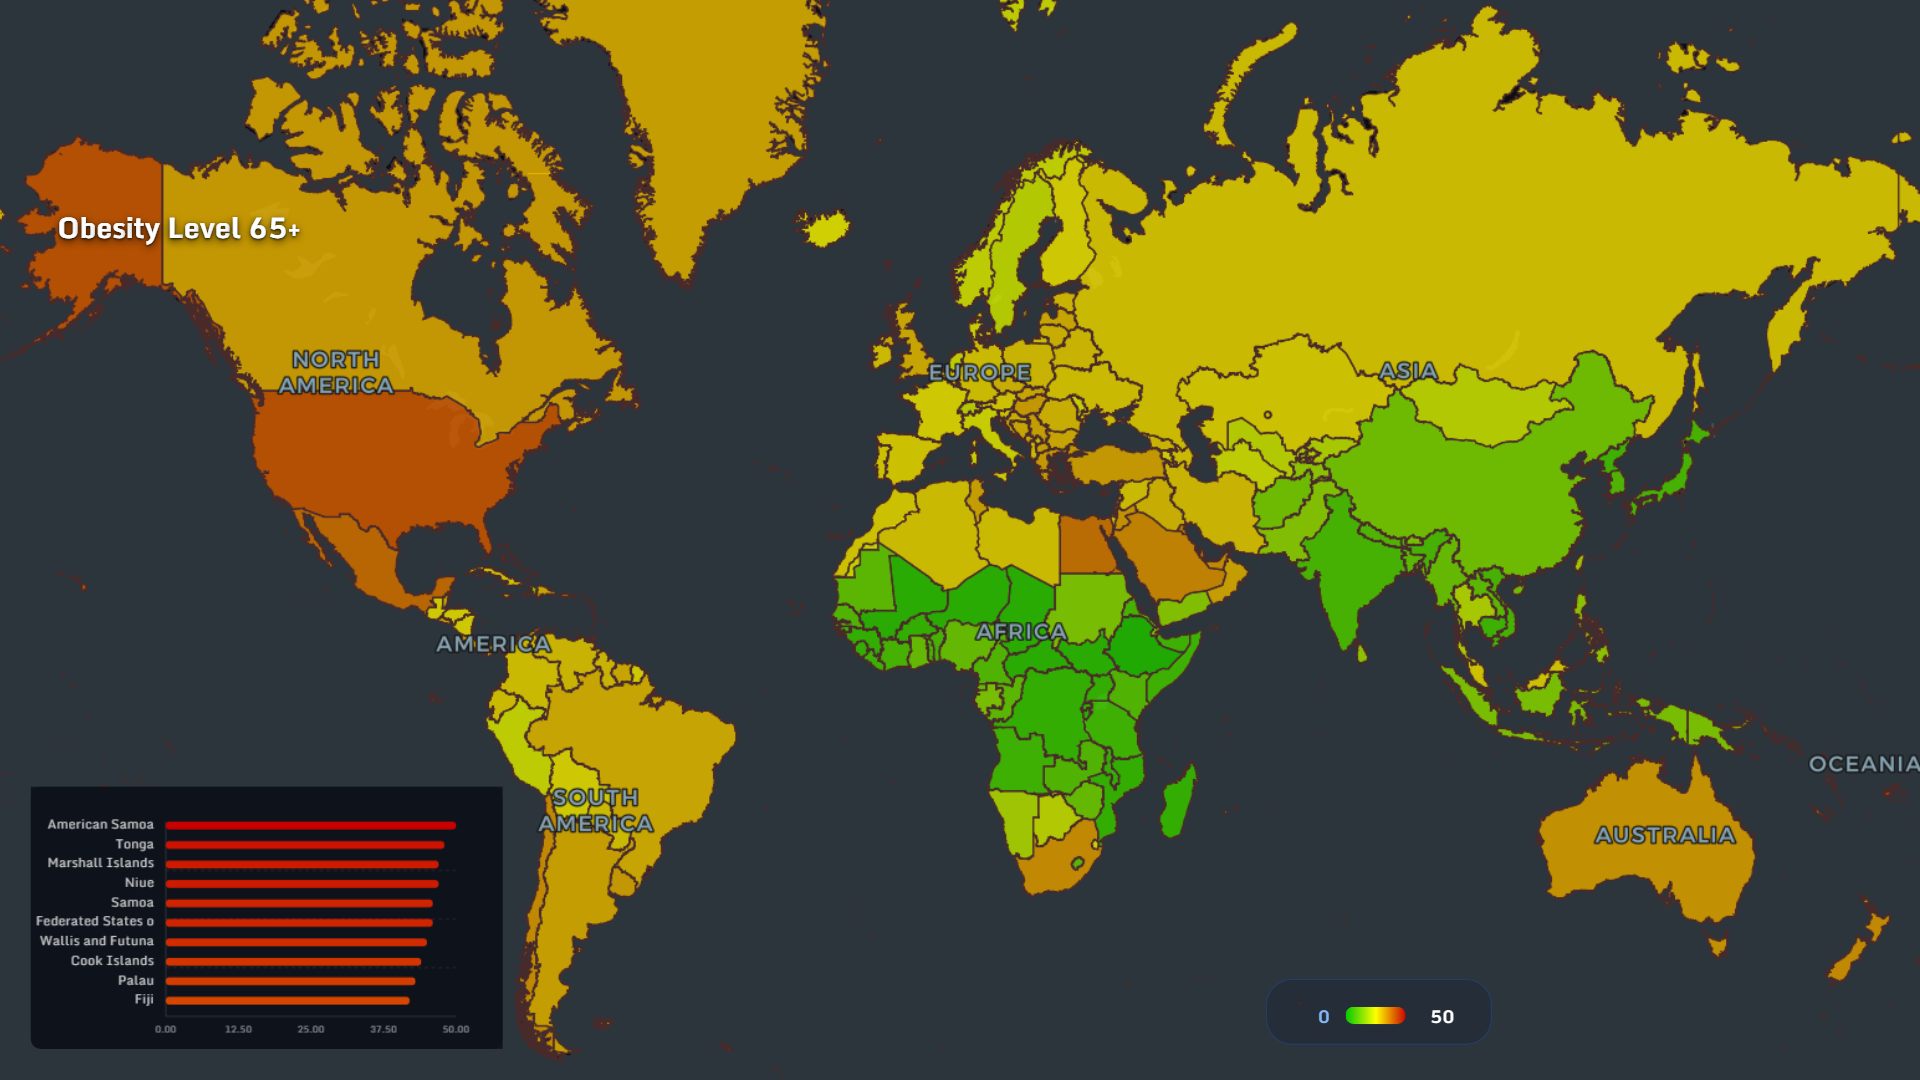
The obesity map 2026 highlights a paradox:
- High obesity: USA, Middle East, Pacific islands
- Lower obesity: Asia, Africa
🎓 Education Levels in the Elderly Population
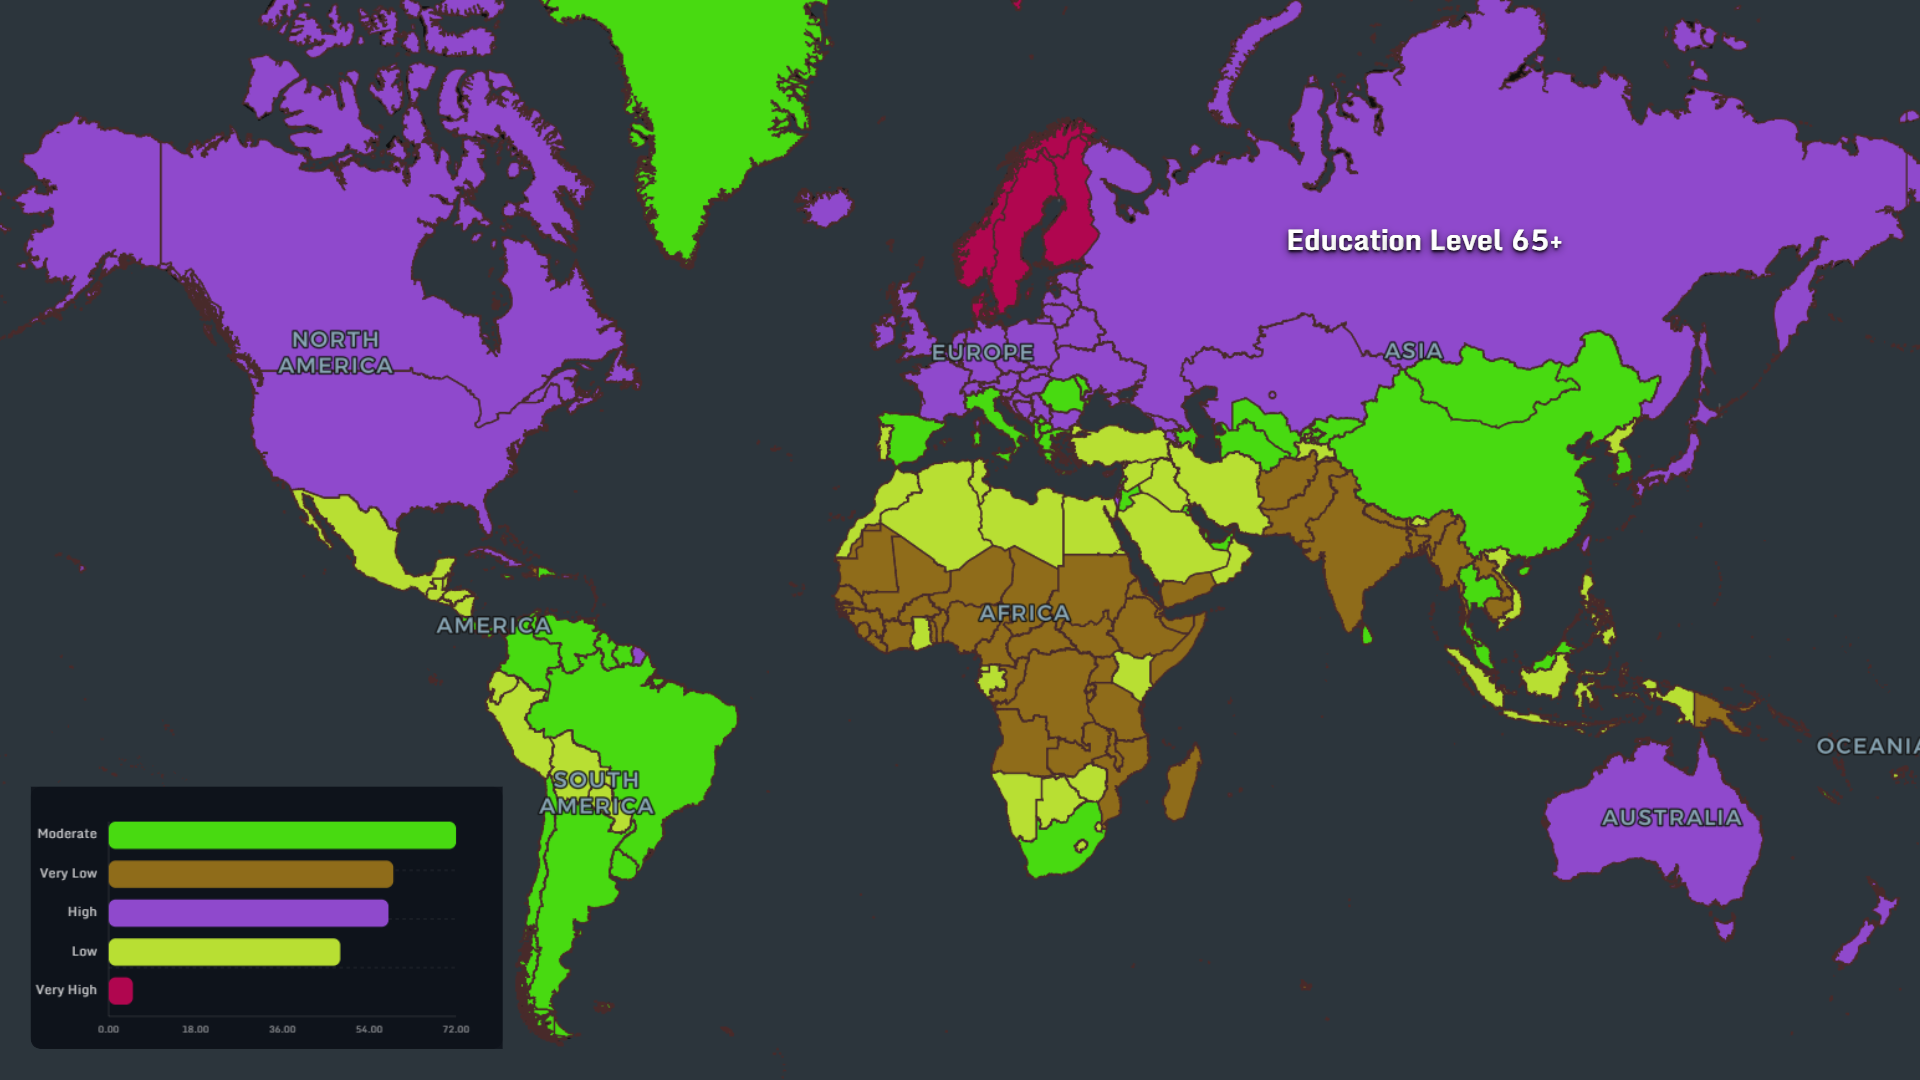
Education is one of the most predictive variables in aging:
- High education: Europe, North America, Russia
- Low education: much of Africa
- Higher education → better cognitive resilience
- Strong correlation with lower dementia progression rates
🧓 Age of Dementia Diagnosis
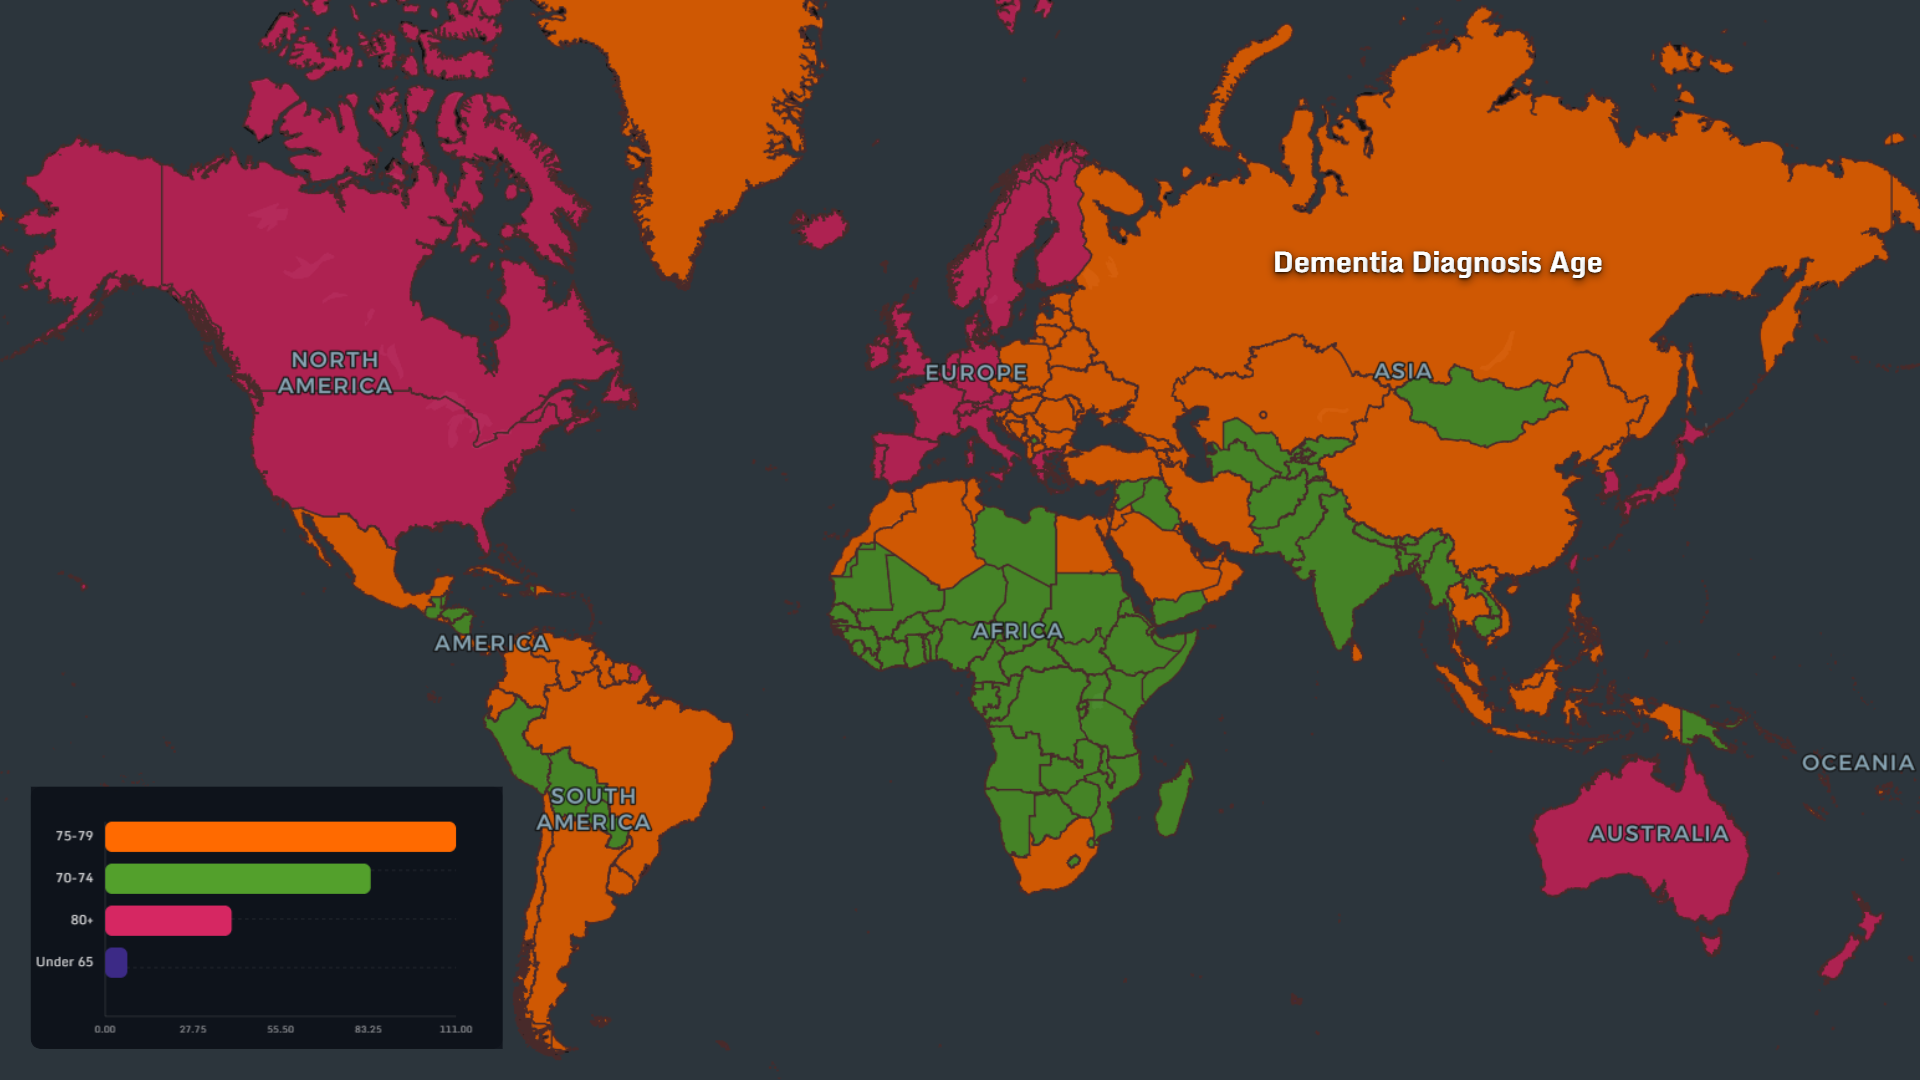
The average dementia diagnosis age map 2026 shows:
- Global average: 75–79 years
- Earlier detection in developed countries
- Delayed or missing diagnoses in developing regions
🏥 Access to Dementia Specialist Care
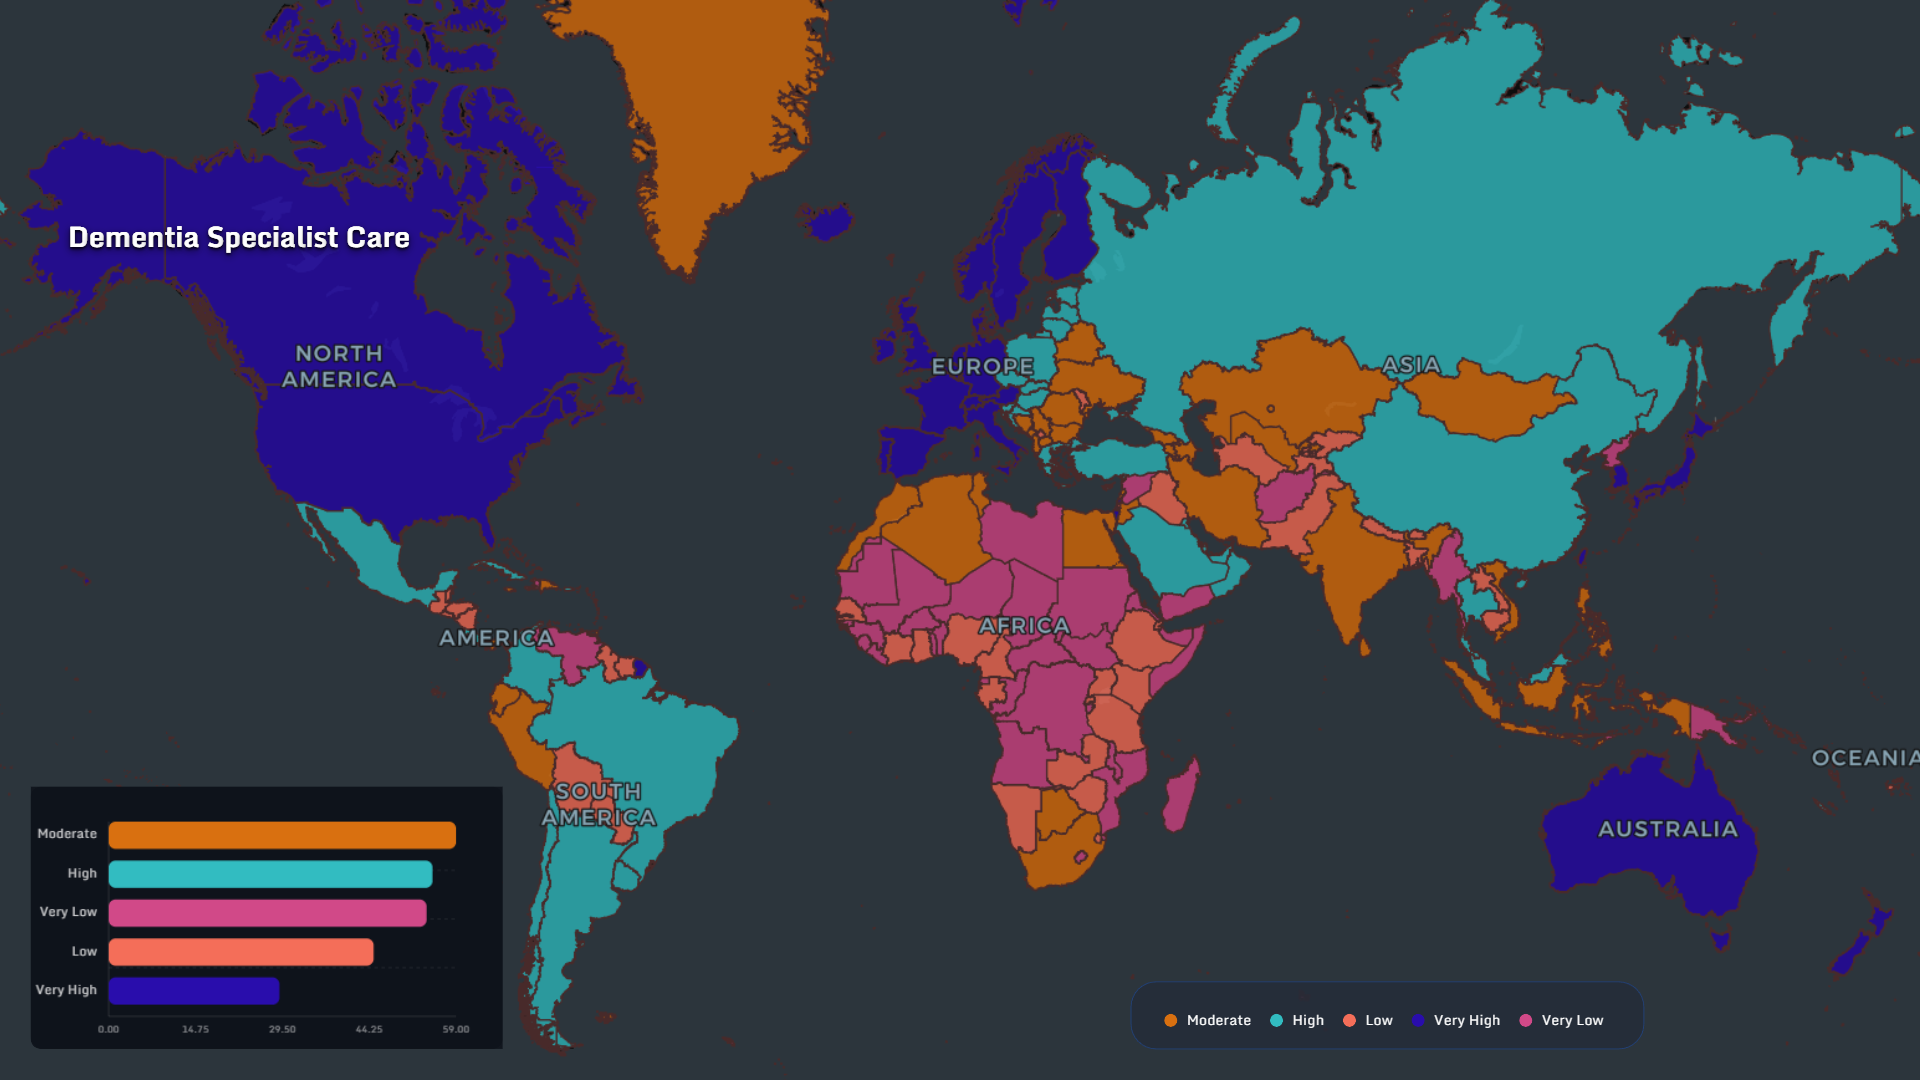
One of the most unequal distributions:
- High access: Western Europe, USA, Canada
- Limited access: Africa, South Asia
🧘 Activity Levels Among Older Adults
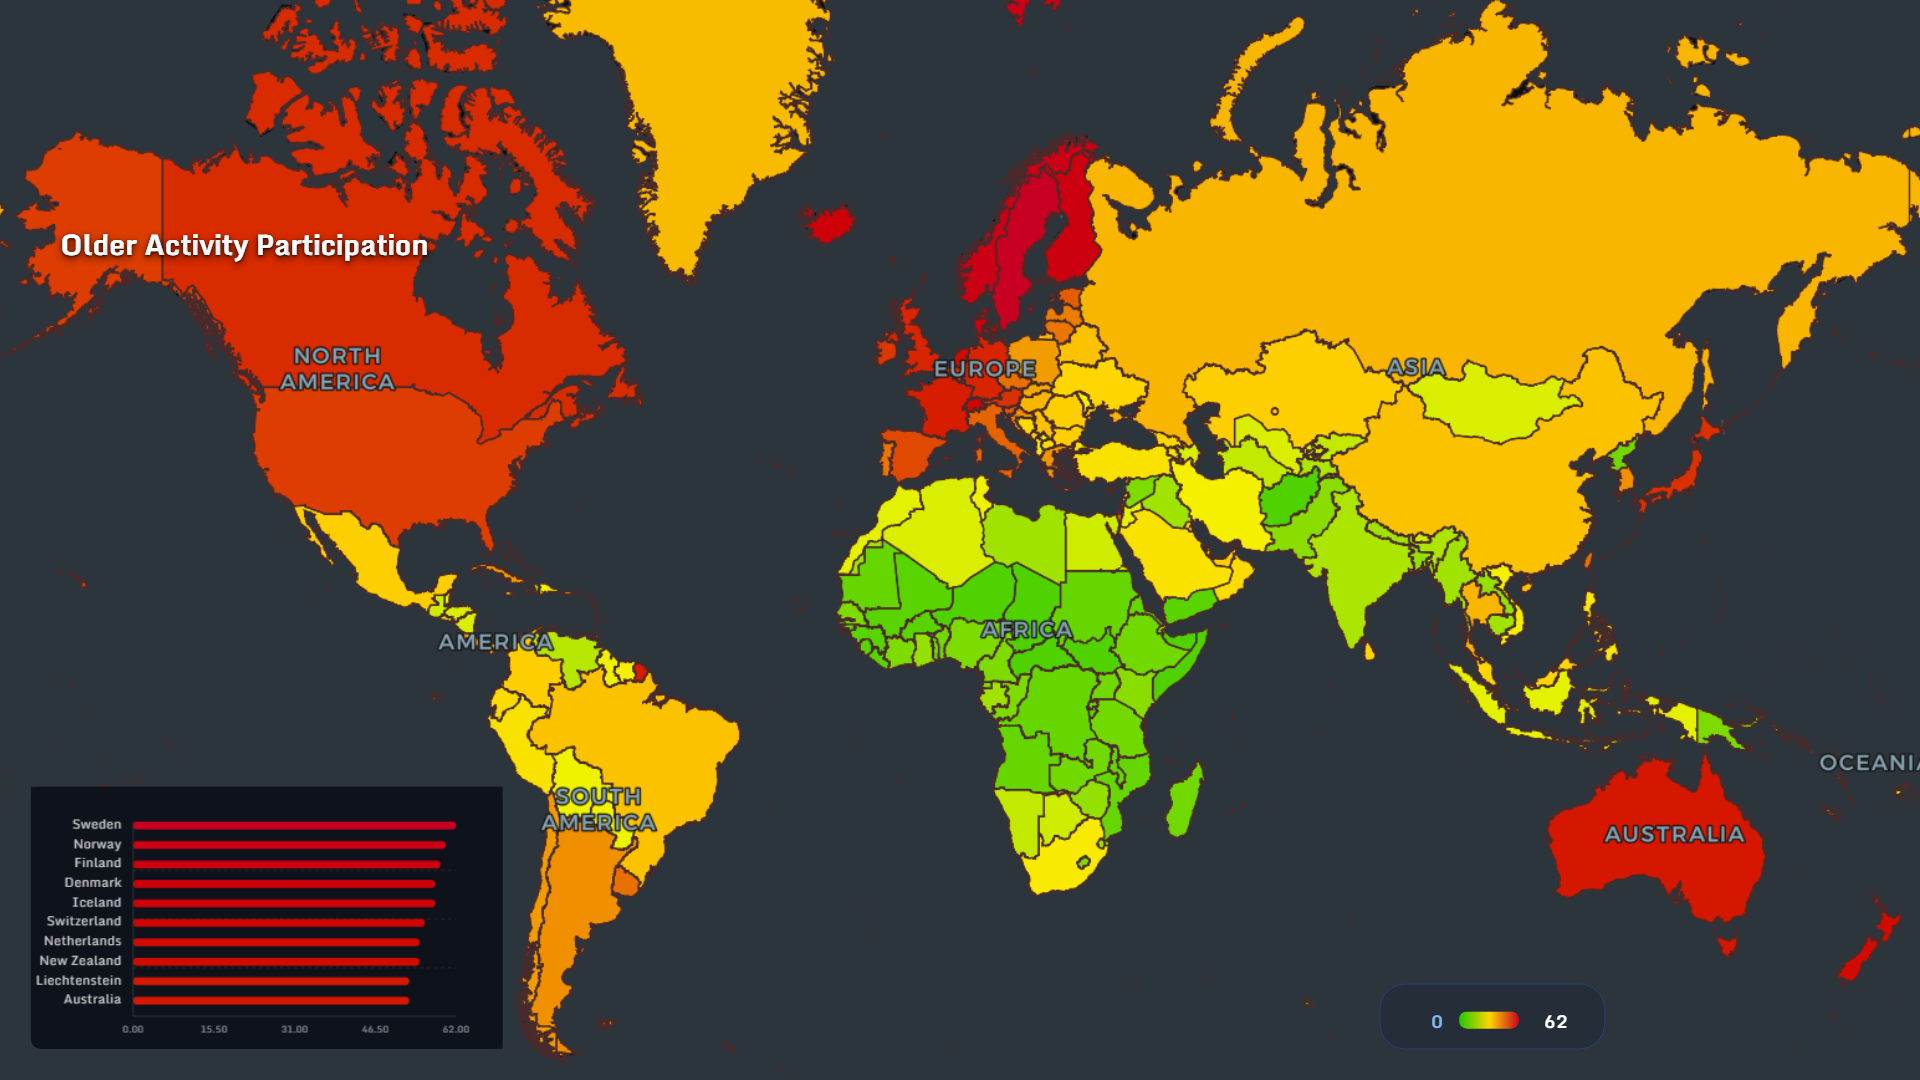
The active aging map 2026 shows:
- Nordic countries and Europe leading
- Lower participation in developing regions
- Lower dementia risk
- Higher life satisfaction
- Increased lifespan quality
🚬 Smoking and Physical Inactivity
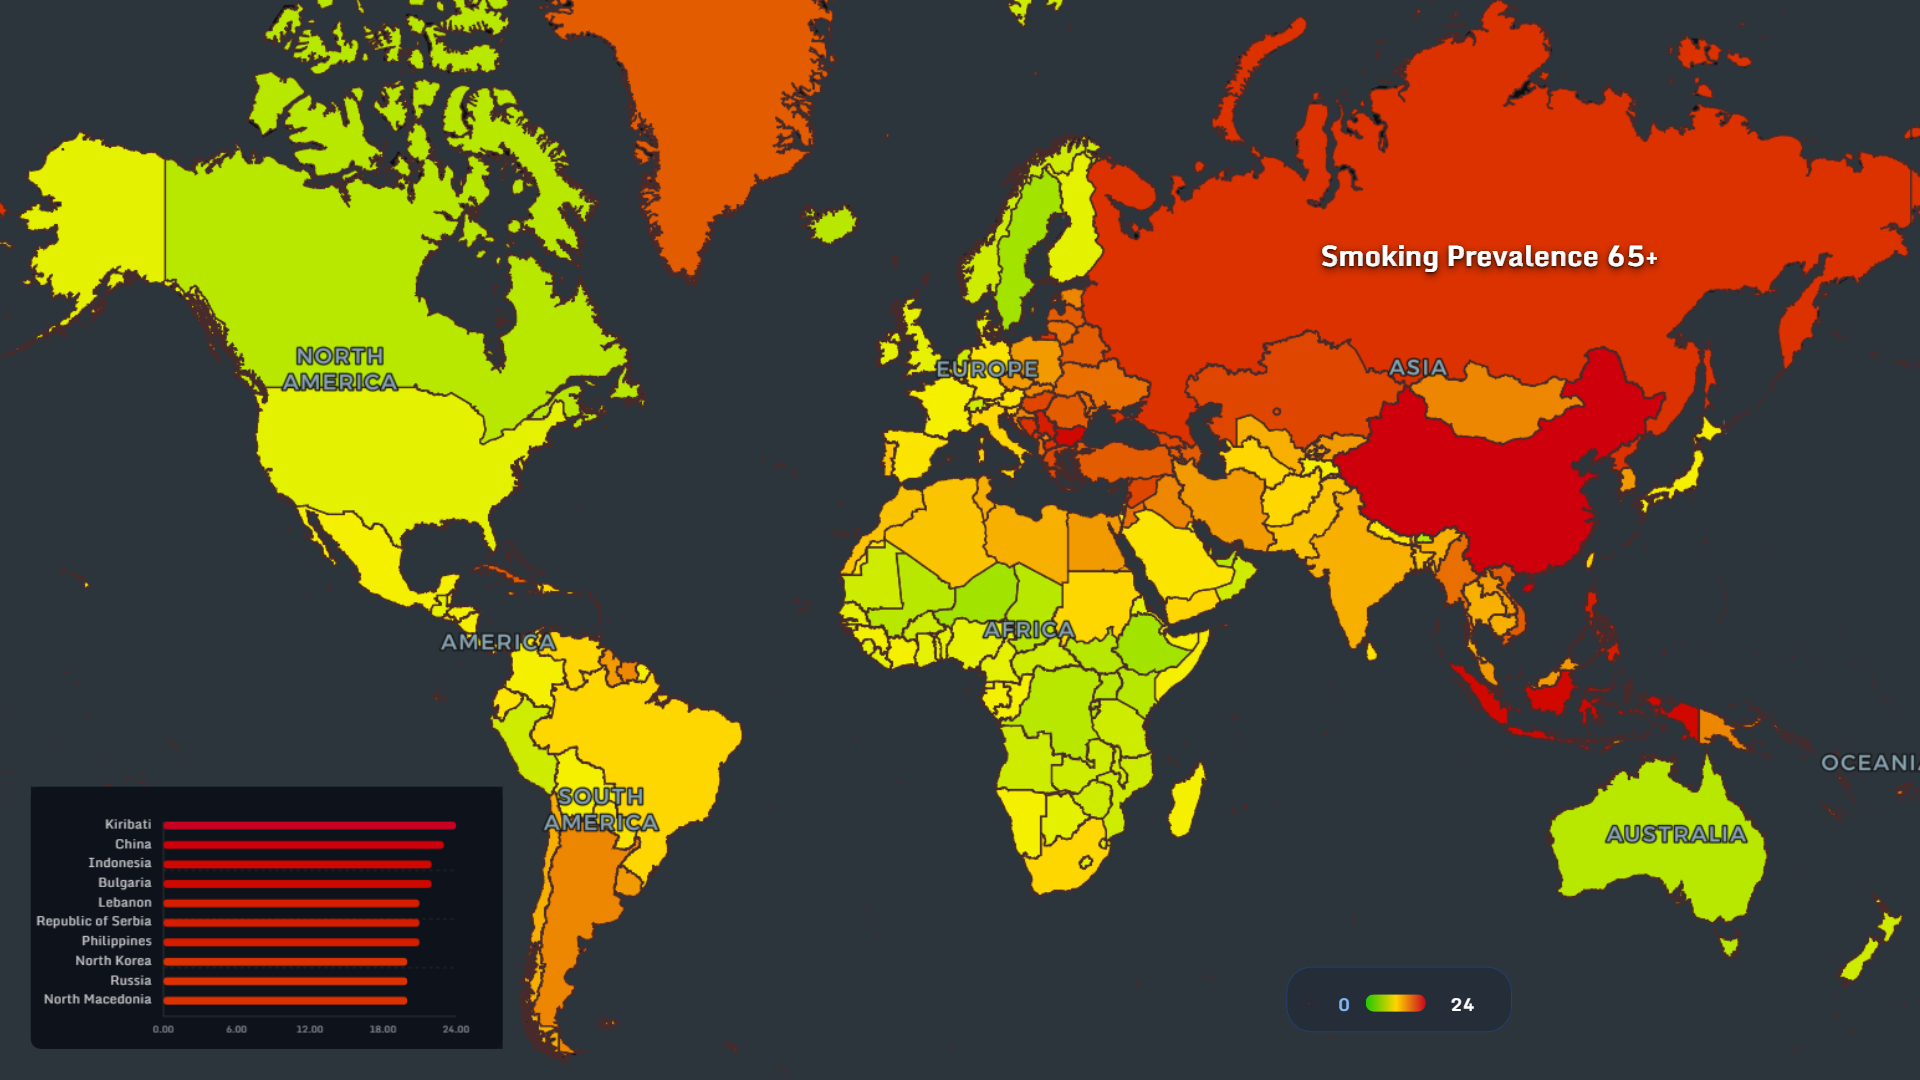
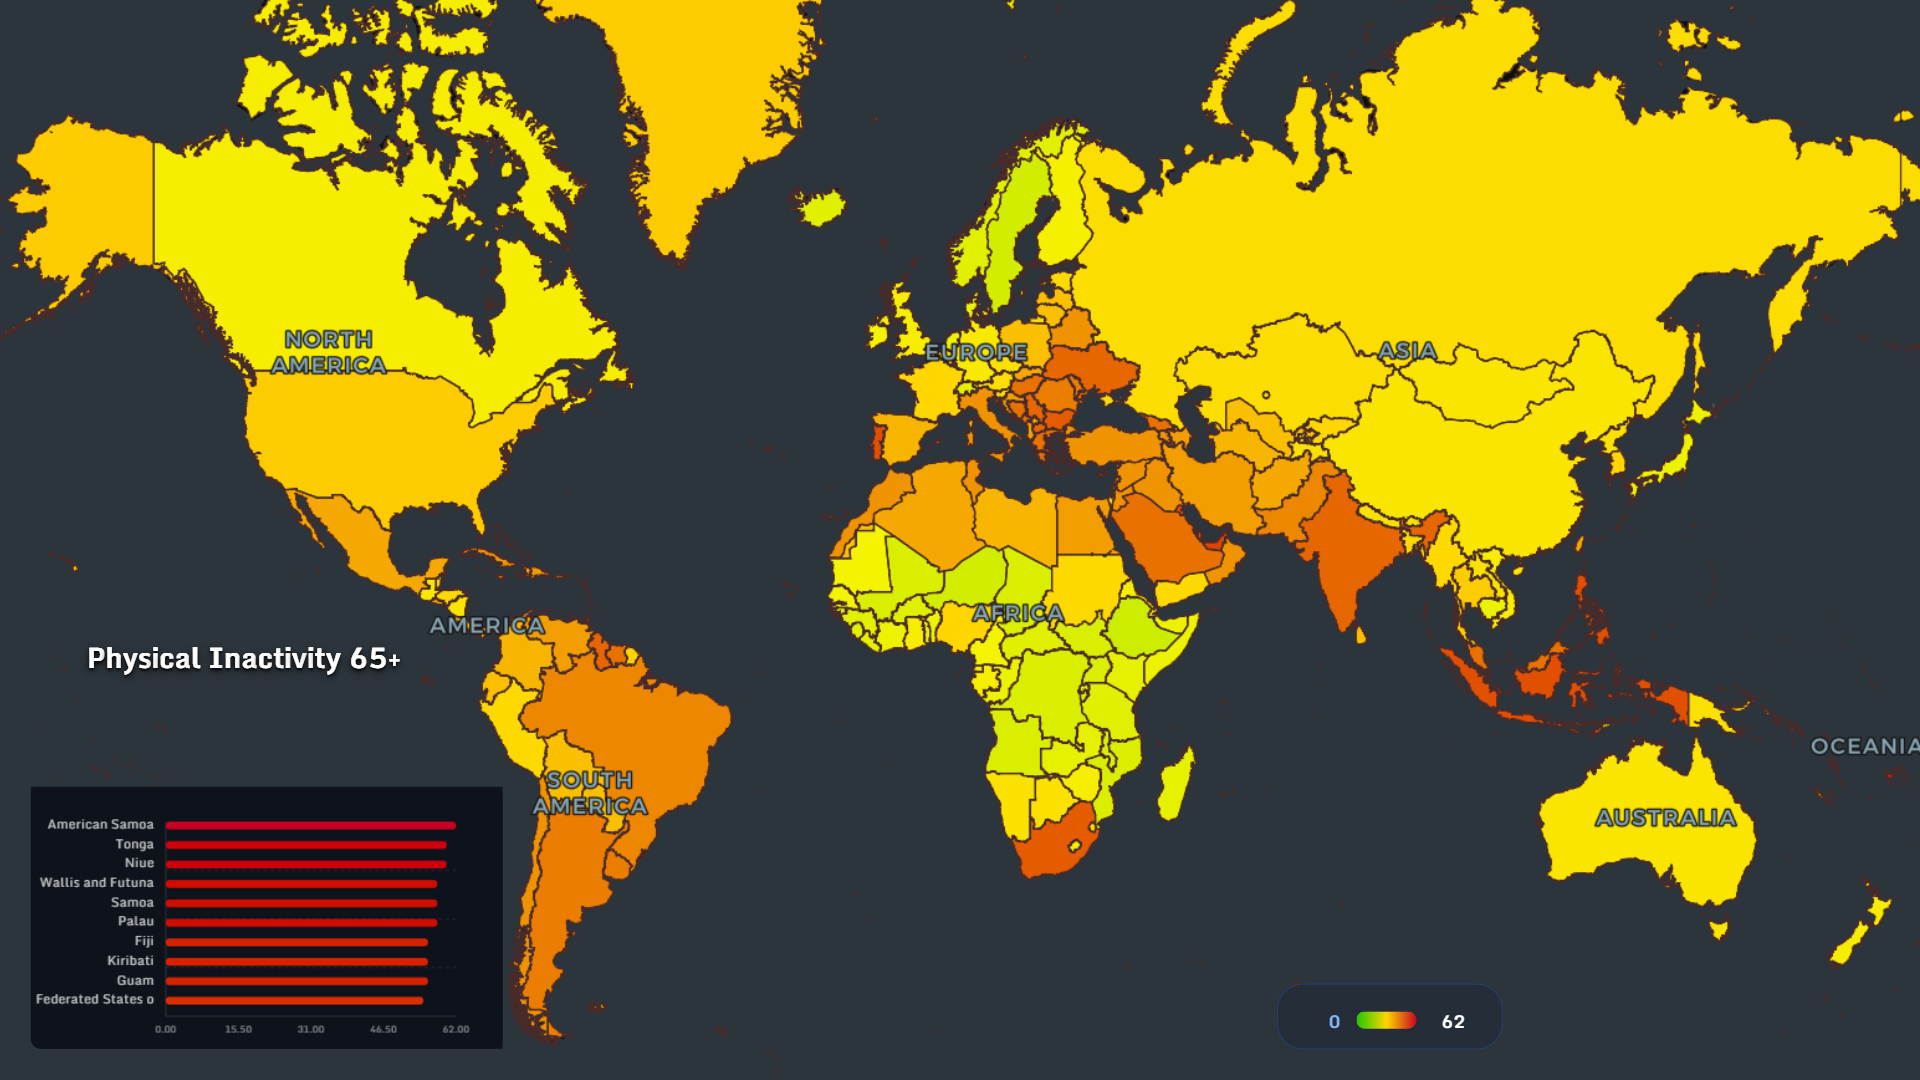
Two major behavioral risk factors:
- Smoking concentrated in Asia and Eastern Europe
- Inactivity higher in wealthy economies
🧬 Alzheimer’s and Dementia Prevalence
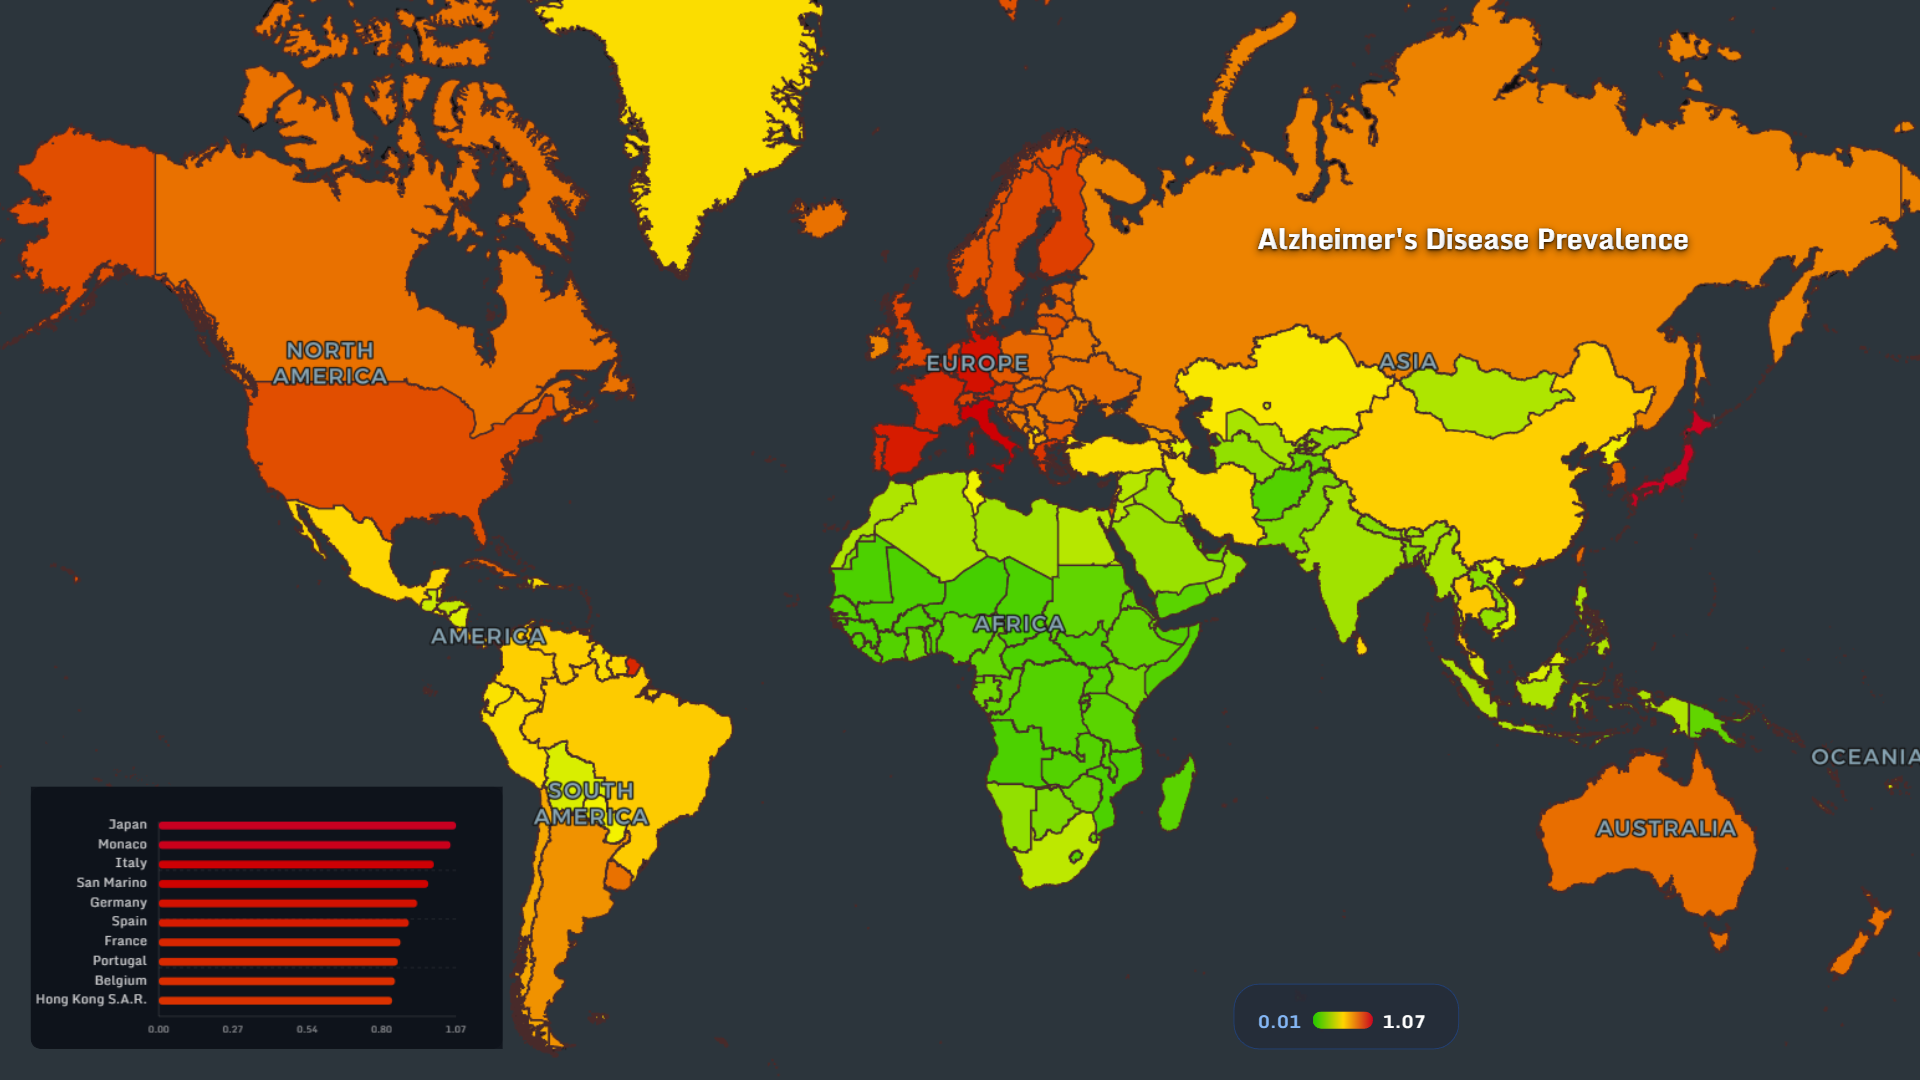
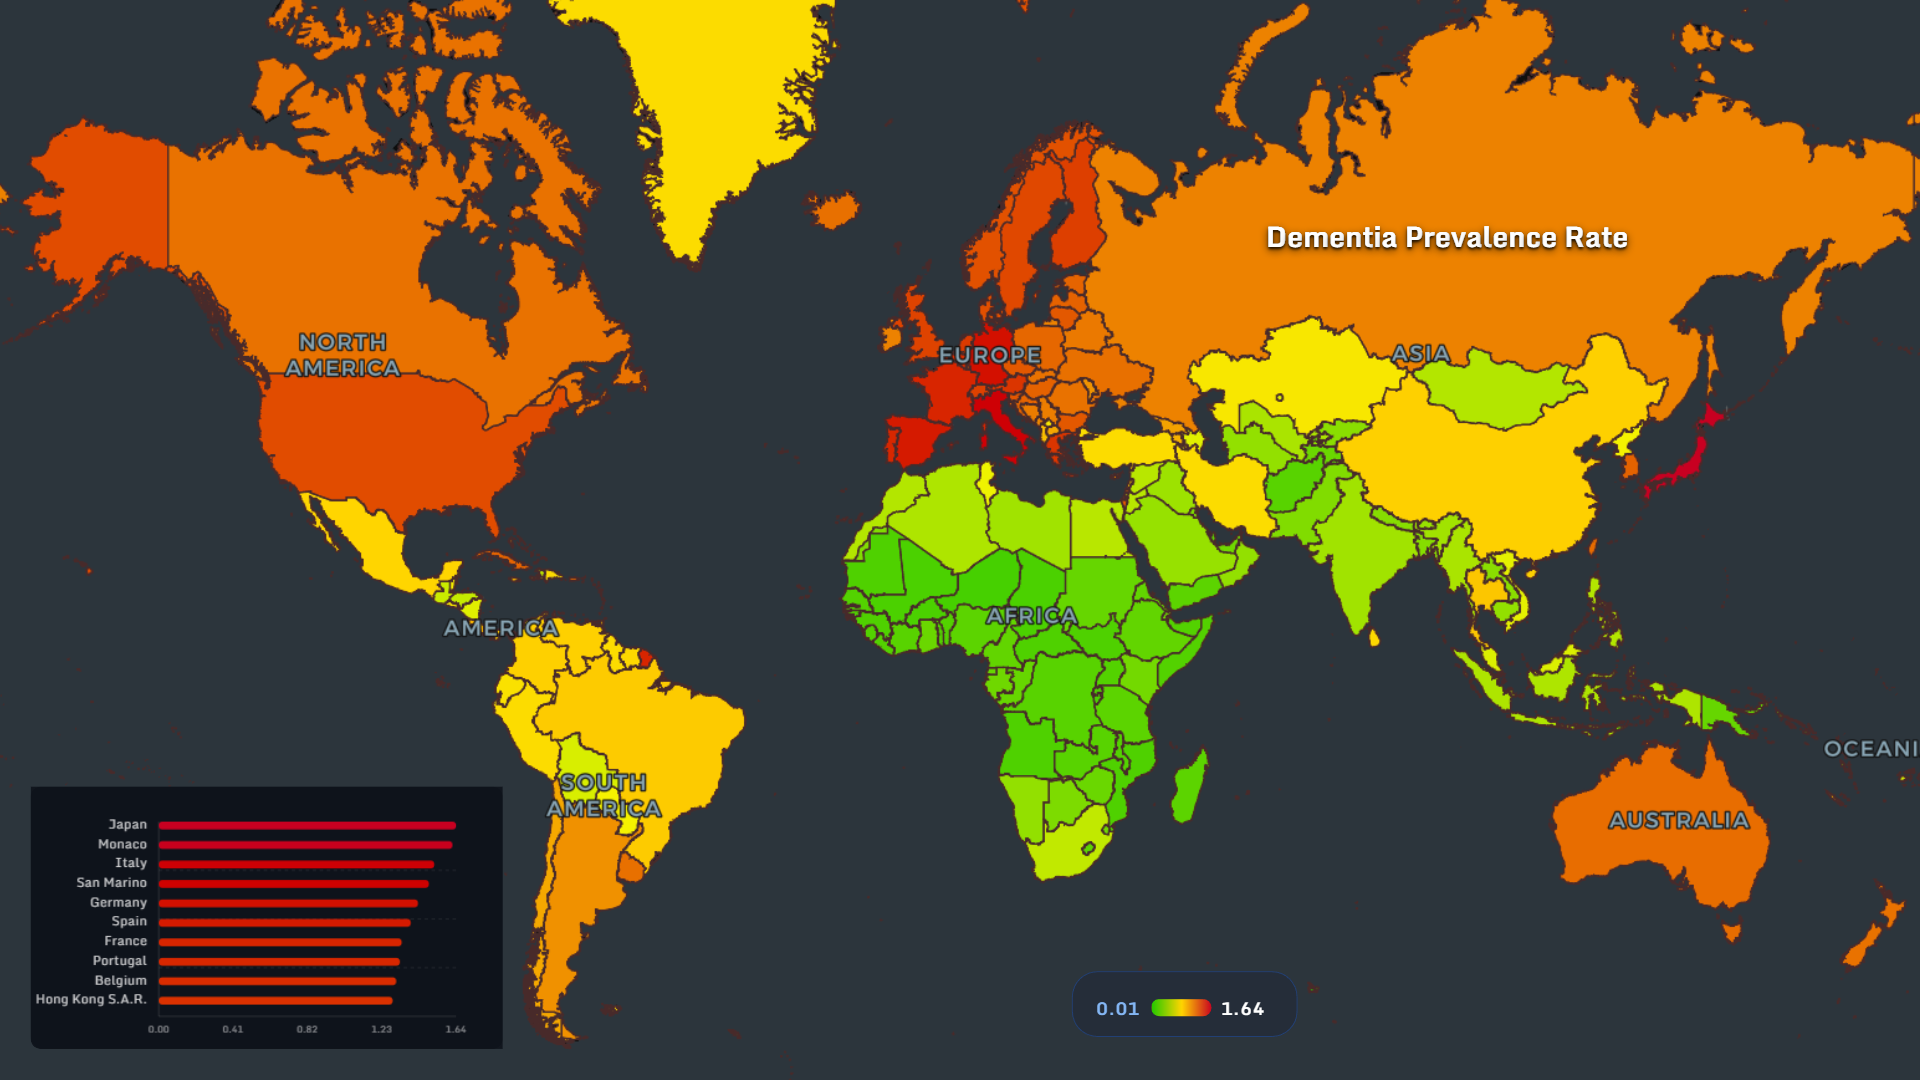
The dementia prevalence map 2026 shows:
- Highest rates in Europe and Japan
- Lower reported rates in Africa (likely underdiagnosed)
🩺 Diabetes and Hypertension Risk
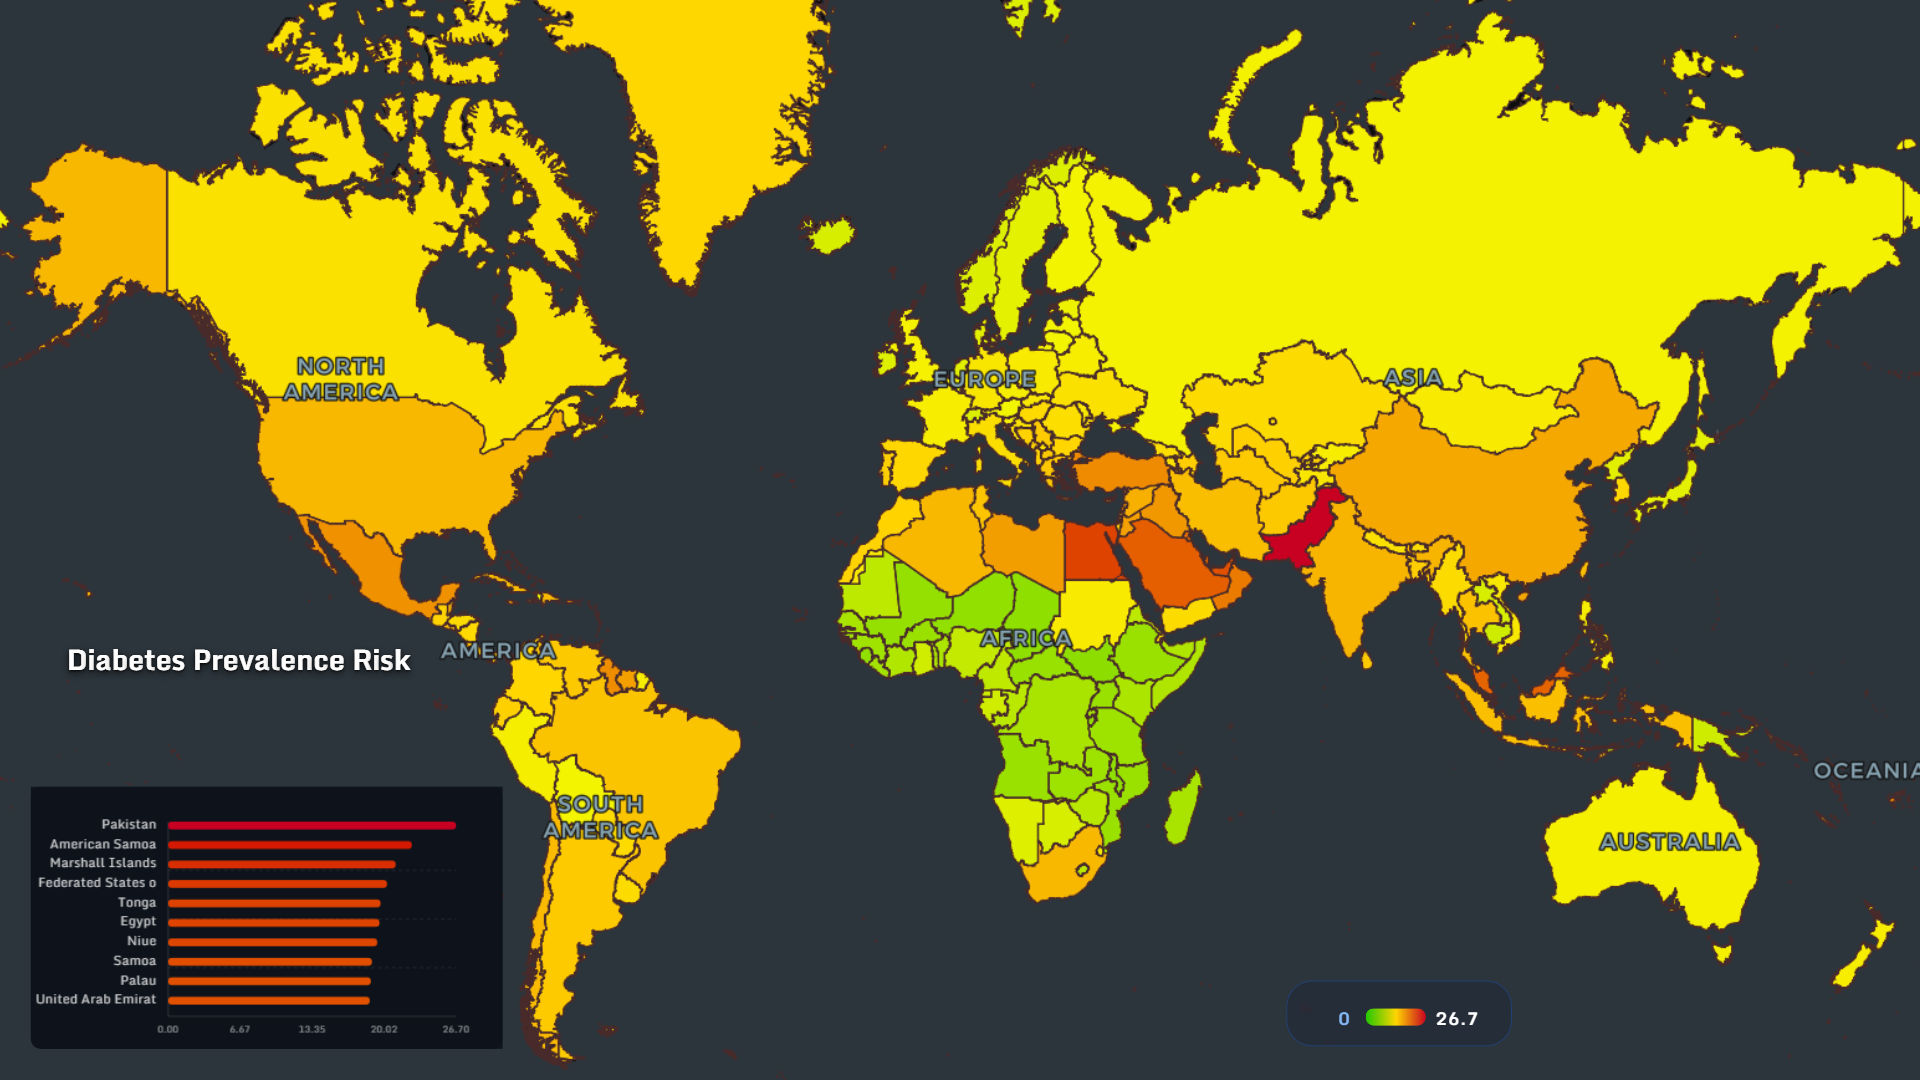
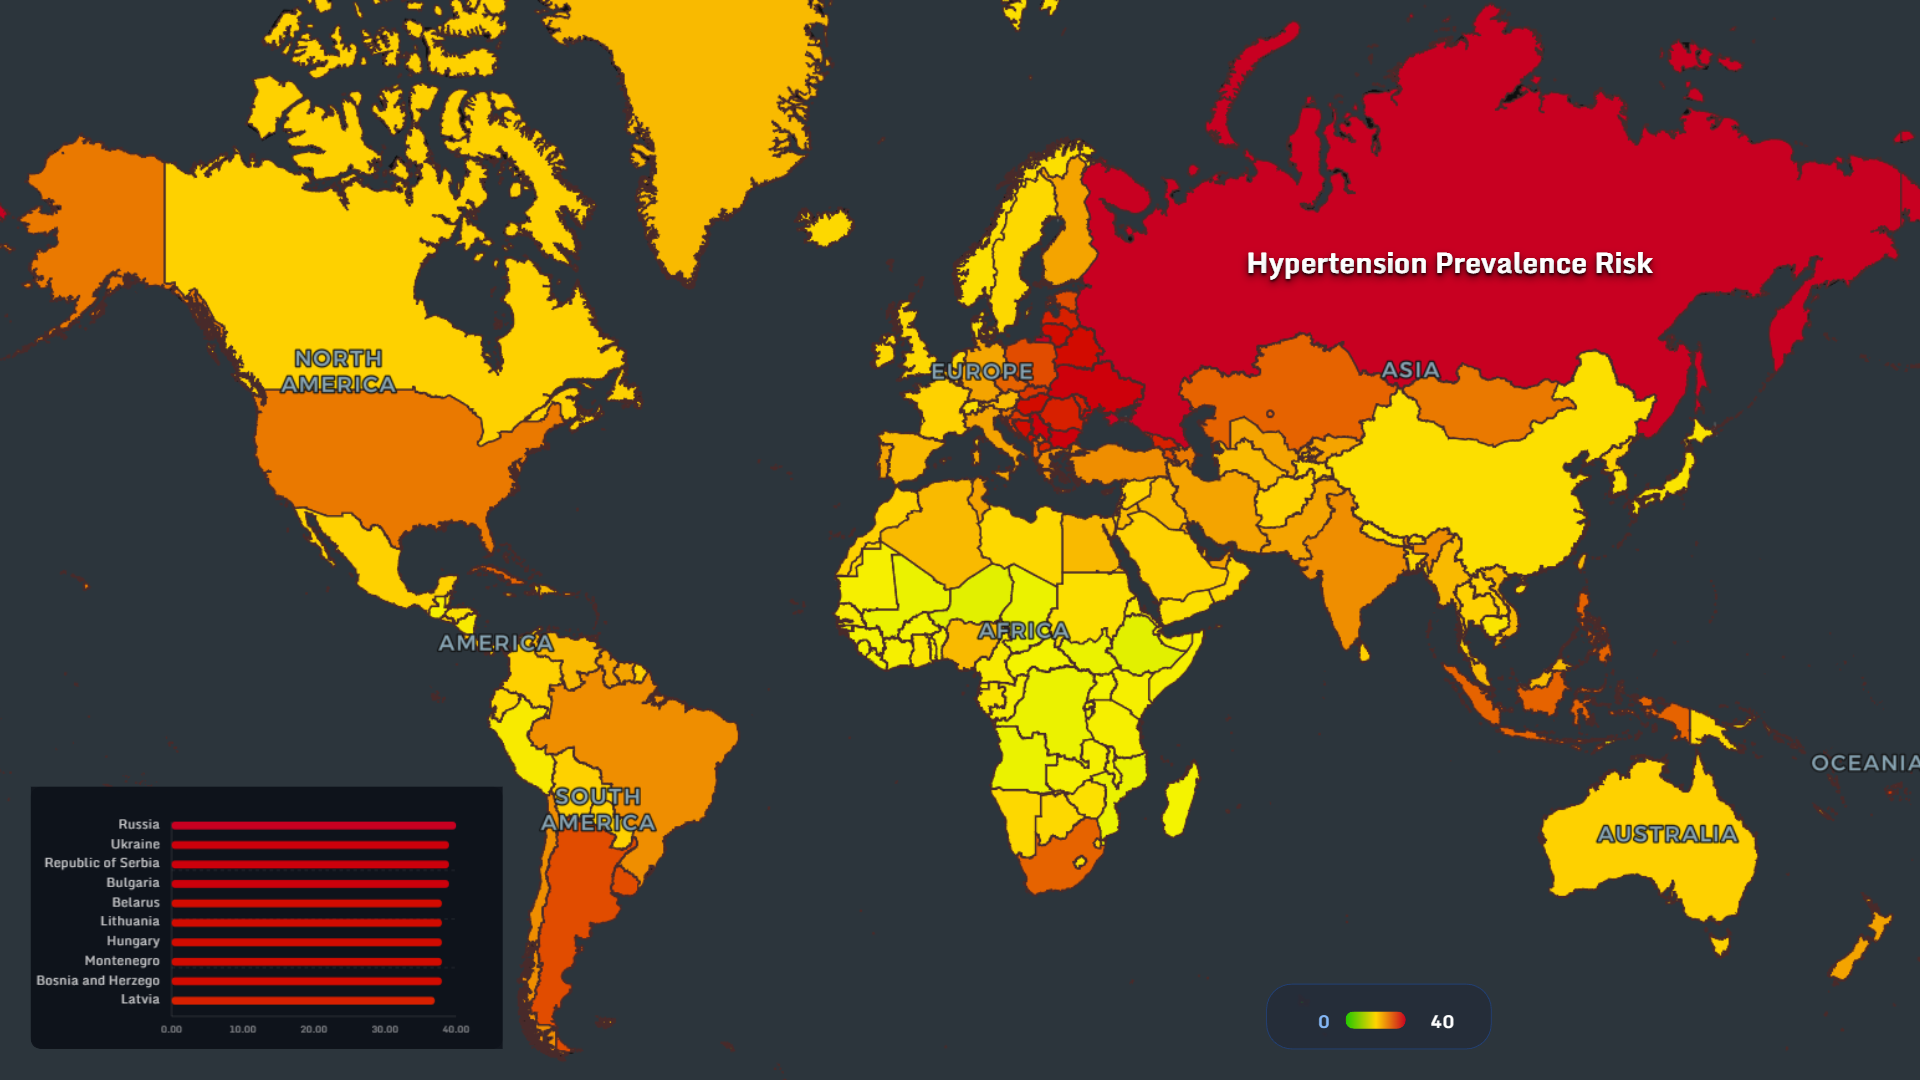
Chronic diseases cluster geographically:
- Diabetes hotspots: Middle East, Pacific islands
- Hypertension: Eastern Europe
⚰️ Dementia Mortality Rate
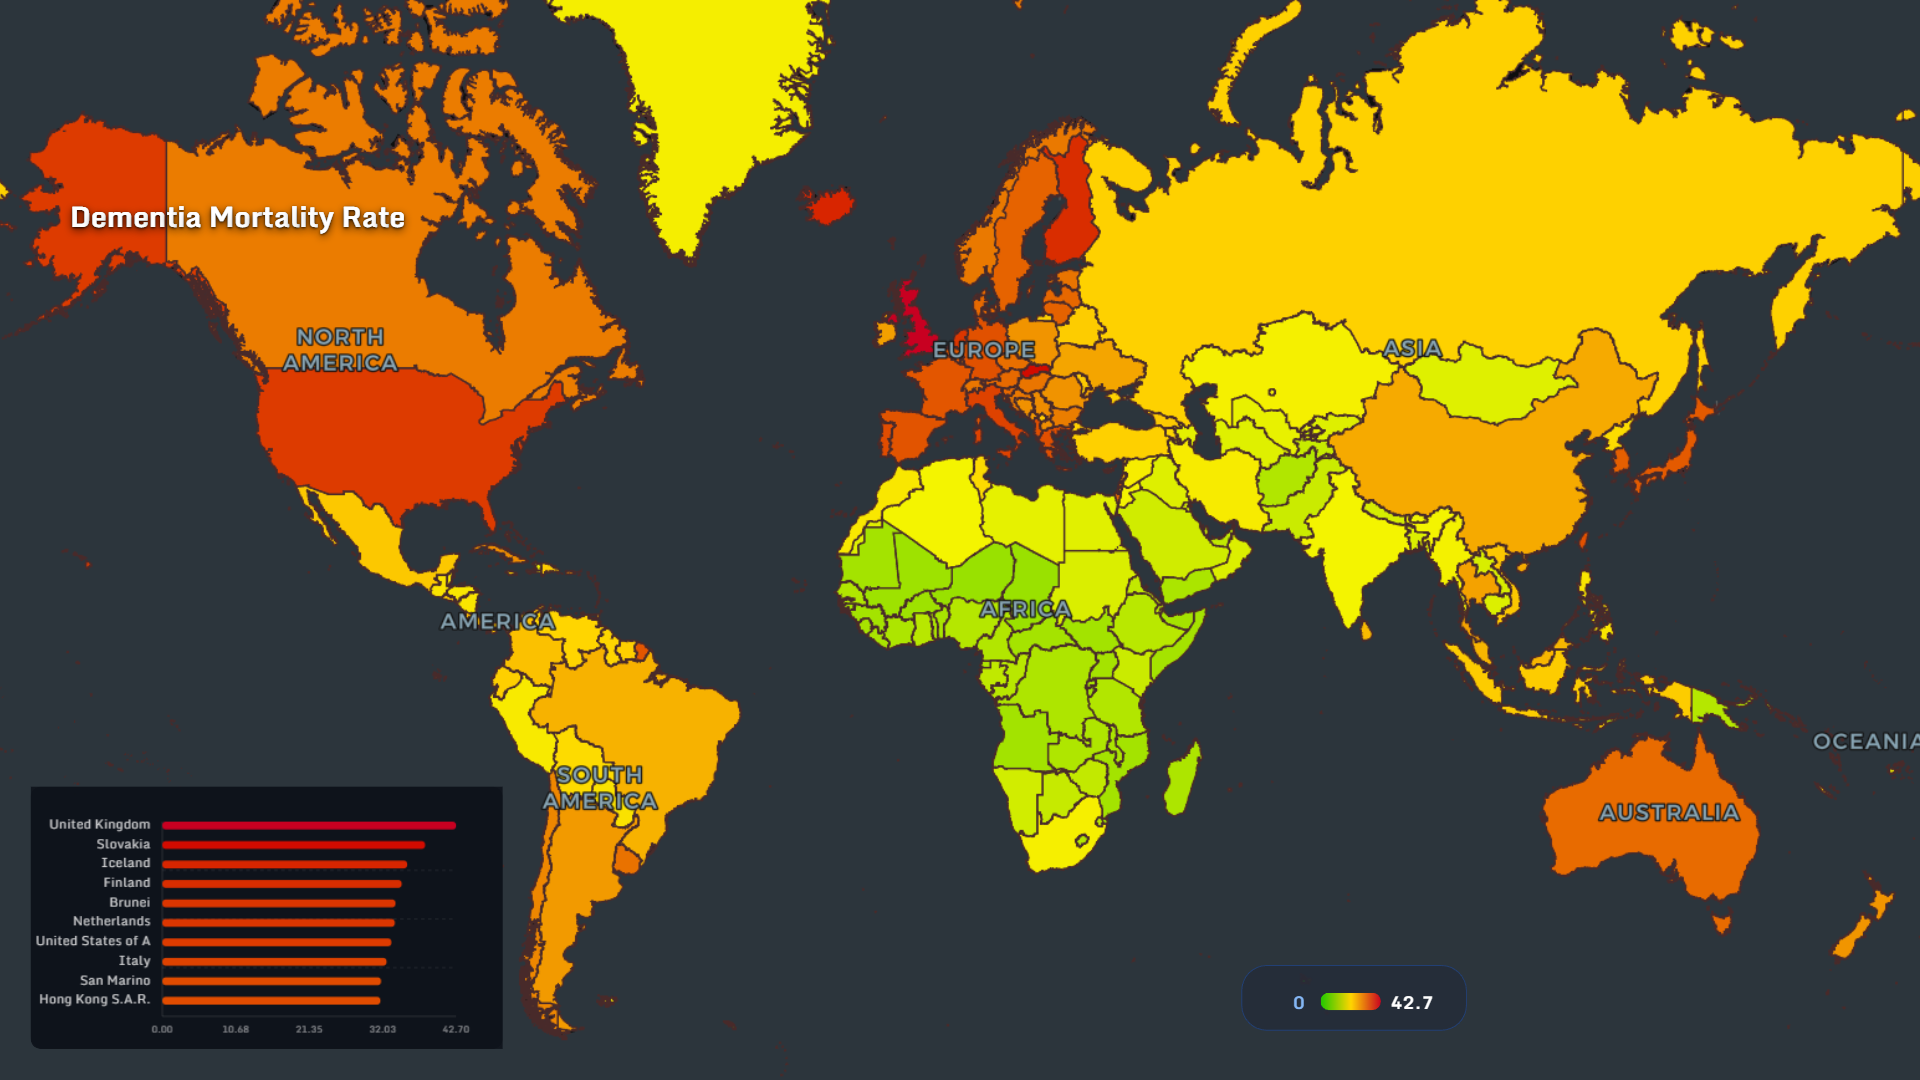
The dementia mortality map 2026 shows:
- High mortality in Europe and North America
- Lower reported mortality in developing regions
🌐 Population Aged 65+
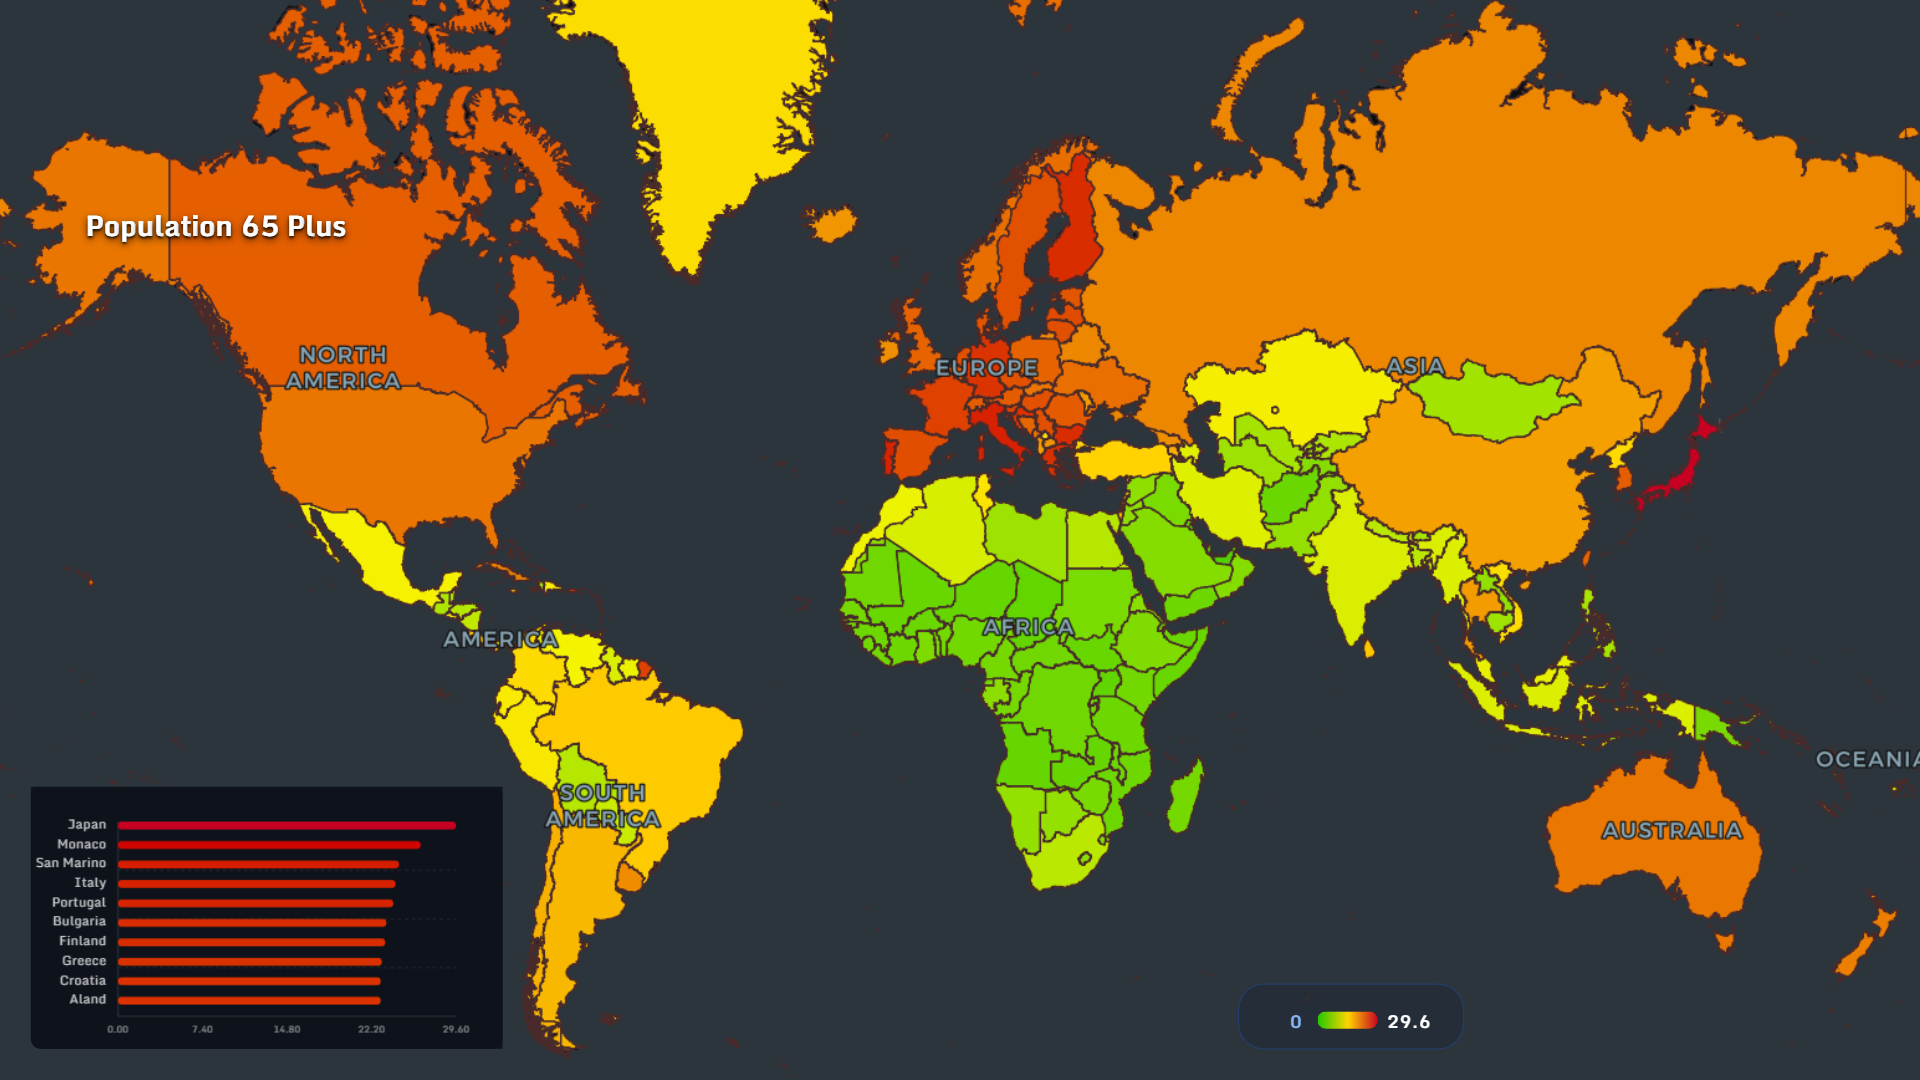
The global aging population map 2026 confirms:
- Europe, Japan, North America → fully aged societies
- Africa → still young, but transitioning
🧩 The Real Story Behind the Data
This global health data visualization 2026 reveals a multilayered truth:
- Aging is accelerating everywhere
- Health inequality shapes outcomes
- Lifestyle defines long-term risks
- Education and activity delay decline
🚀 Why This Matters for Data Analysts and Researchers
Using MAPTHOS, these insights emerge instantly:
- Compare datasets across countries
- Overlay risk factors (diabetes + dementia)
- Build custom health maps in minutes
🌍 Final Thought
In 2026, the map of aging is no longer about age — it is about inequality, systems, and choices.
Some countries are learning how to age well. Others are only beginning to face the consequences.
👉 Explore more at app.mapthos.org
See the world. Map better. Dream big. 🌍✨