
🌍 Europe Under Pressure: The Hidden Crisis of 2026
At first glance, Europe in 2026 looks stable — developed economies, strong institutions, modern infrastructure.
But beneath the surface, the data tells a different story.
A continent quietly balancing between prosperity and pressure: rising housing costs, shrinking populations, aging societies, and growing social isolation.
This is not one crisis. It’s a system of interconnected trends shaping Europe’s future.
🏠 Housing Affordability Crisis (2026)
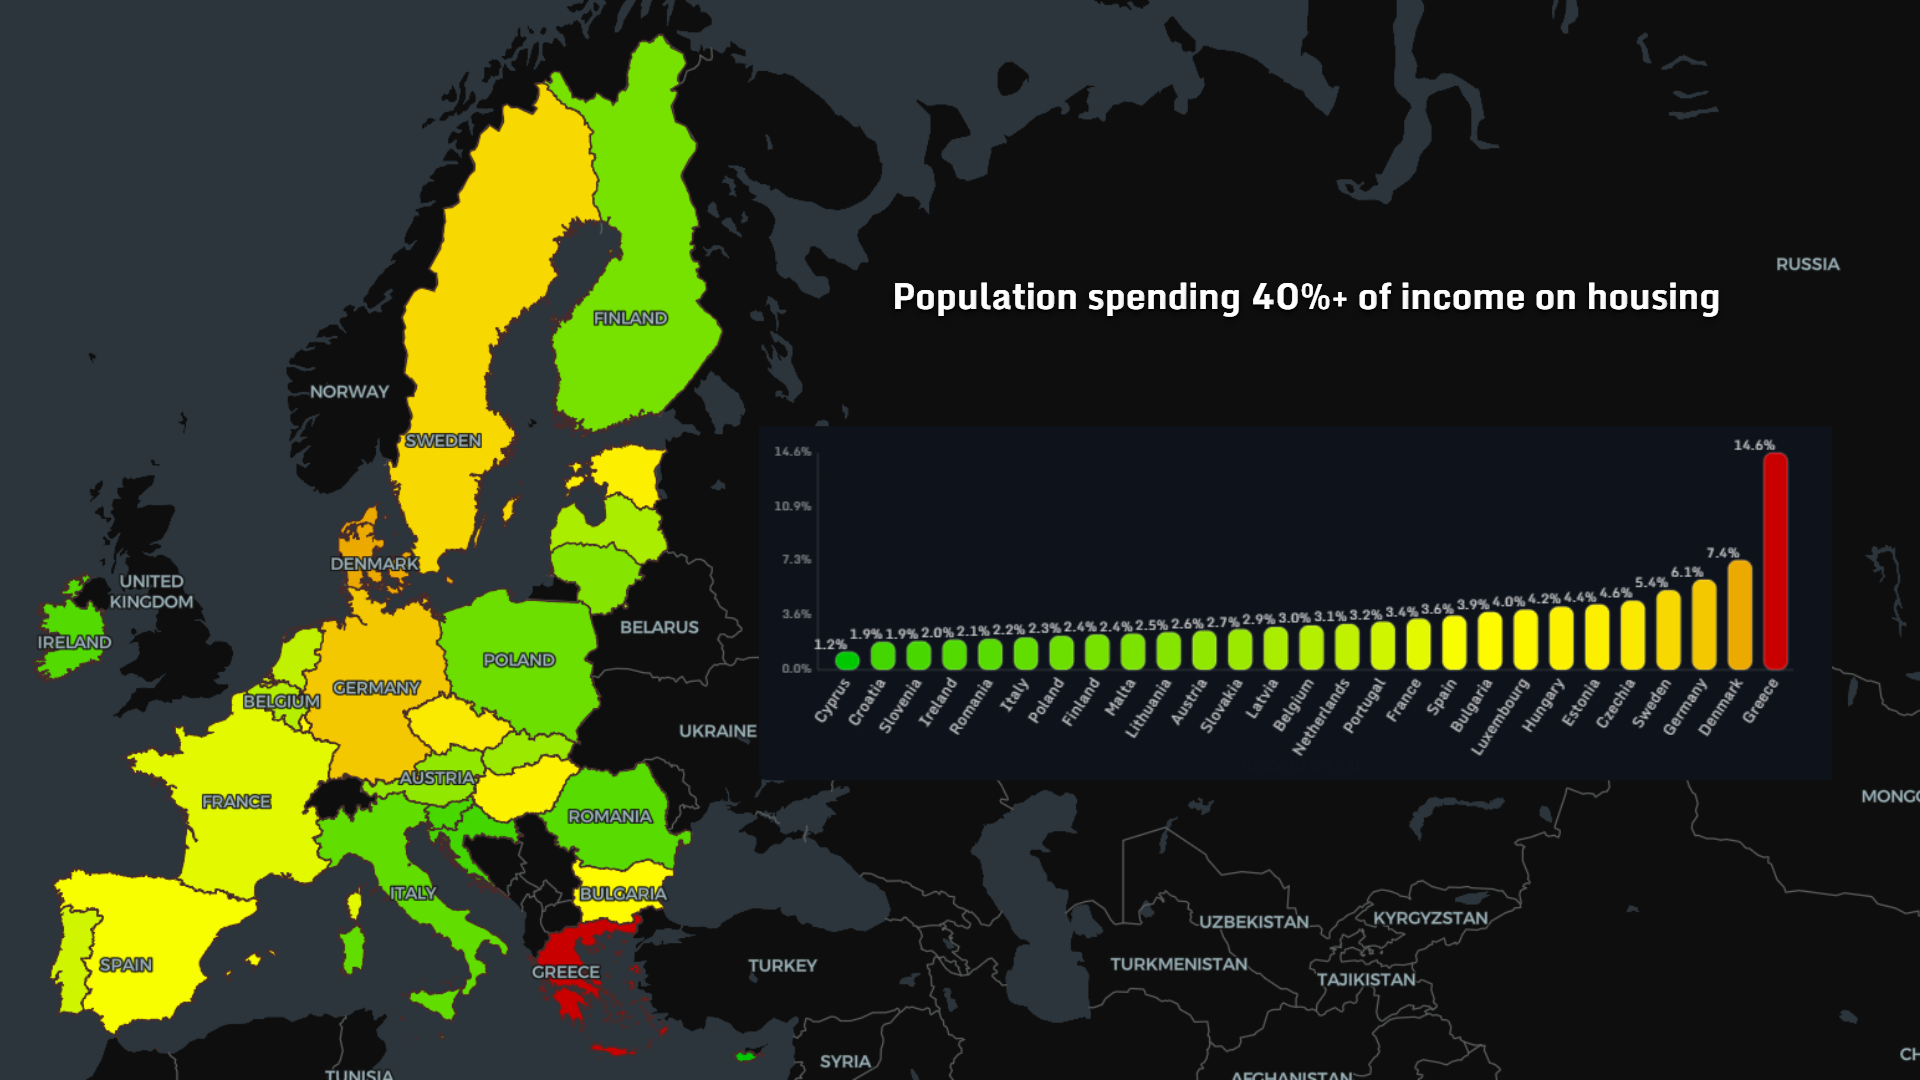
The Europe housing affordability map 2026 reveals a clear imbalance:
- Greece stands out with ~14.6% of people spending 40%+ income on housing
- Denmark and Germany follow, though significantly lower
- Central and Eastern Europe remain relatively less burdened
🏥 Access to Medical Care
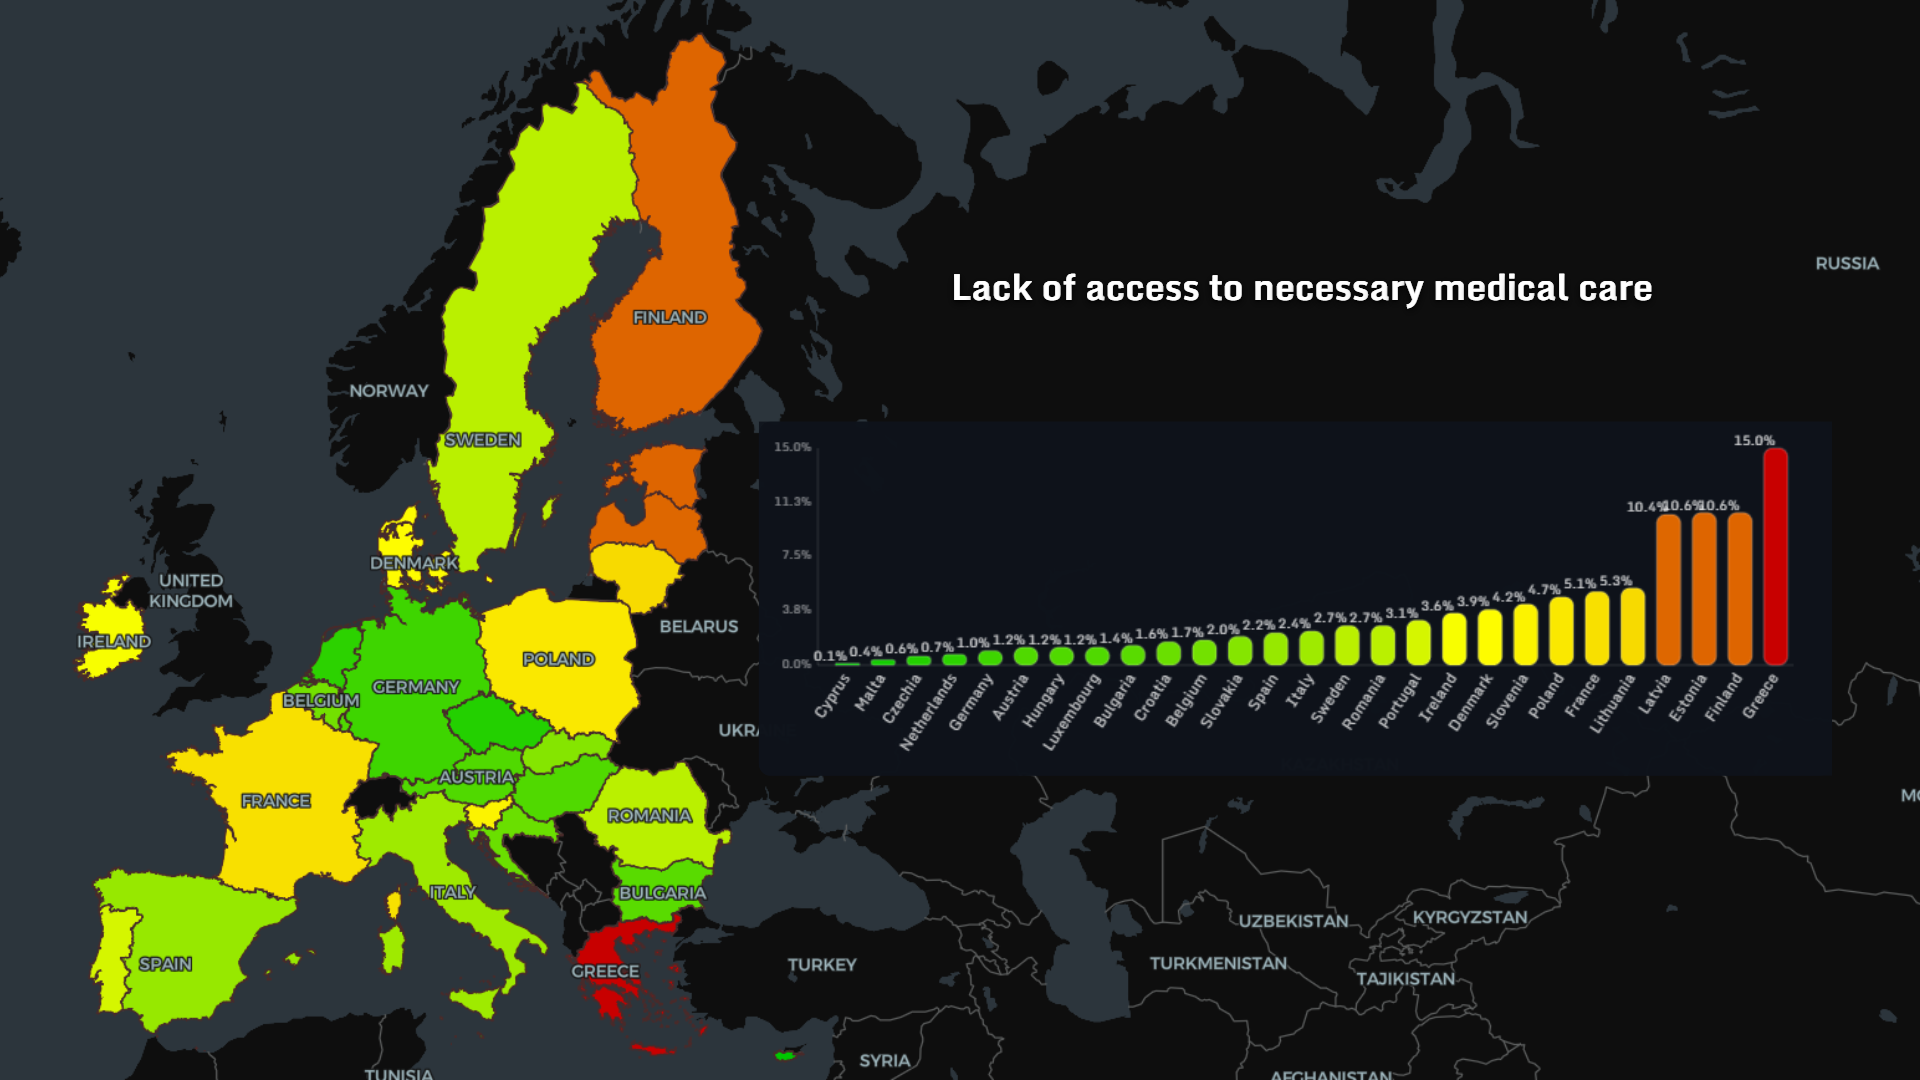
Healthcare inequality is widening:
- Greece again leads in lack of access (~15%)
- Baltic states and Eastern Europe show elevated levels
- Western Europe remains relatively stable
😔 Loneliness Across Europe
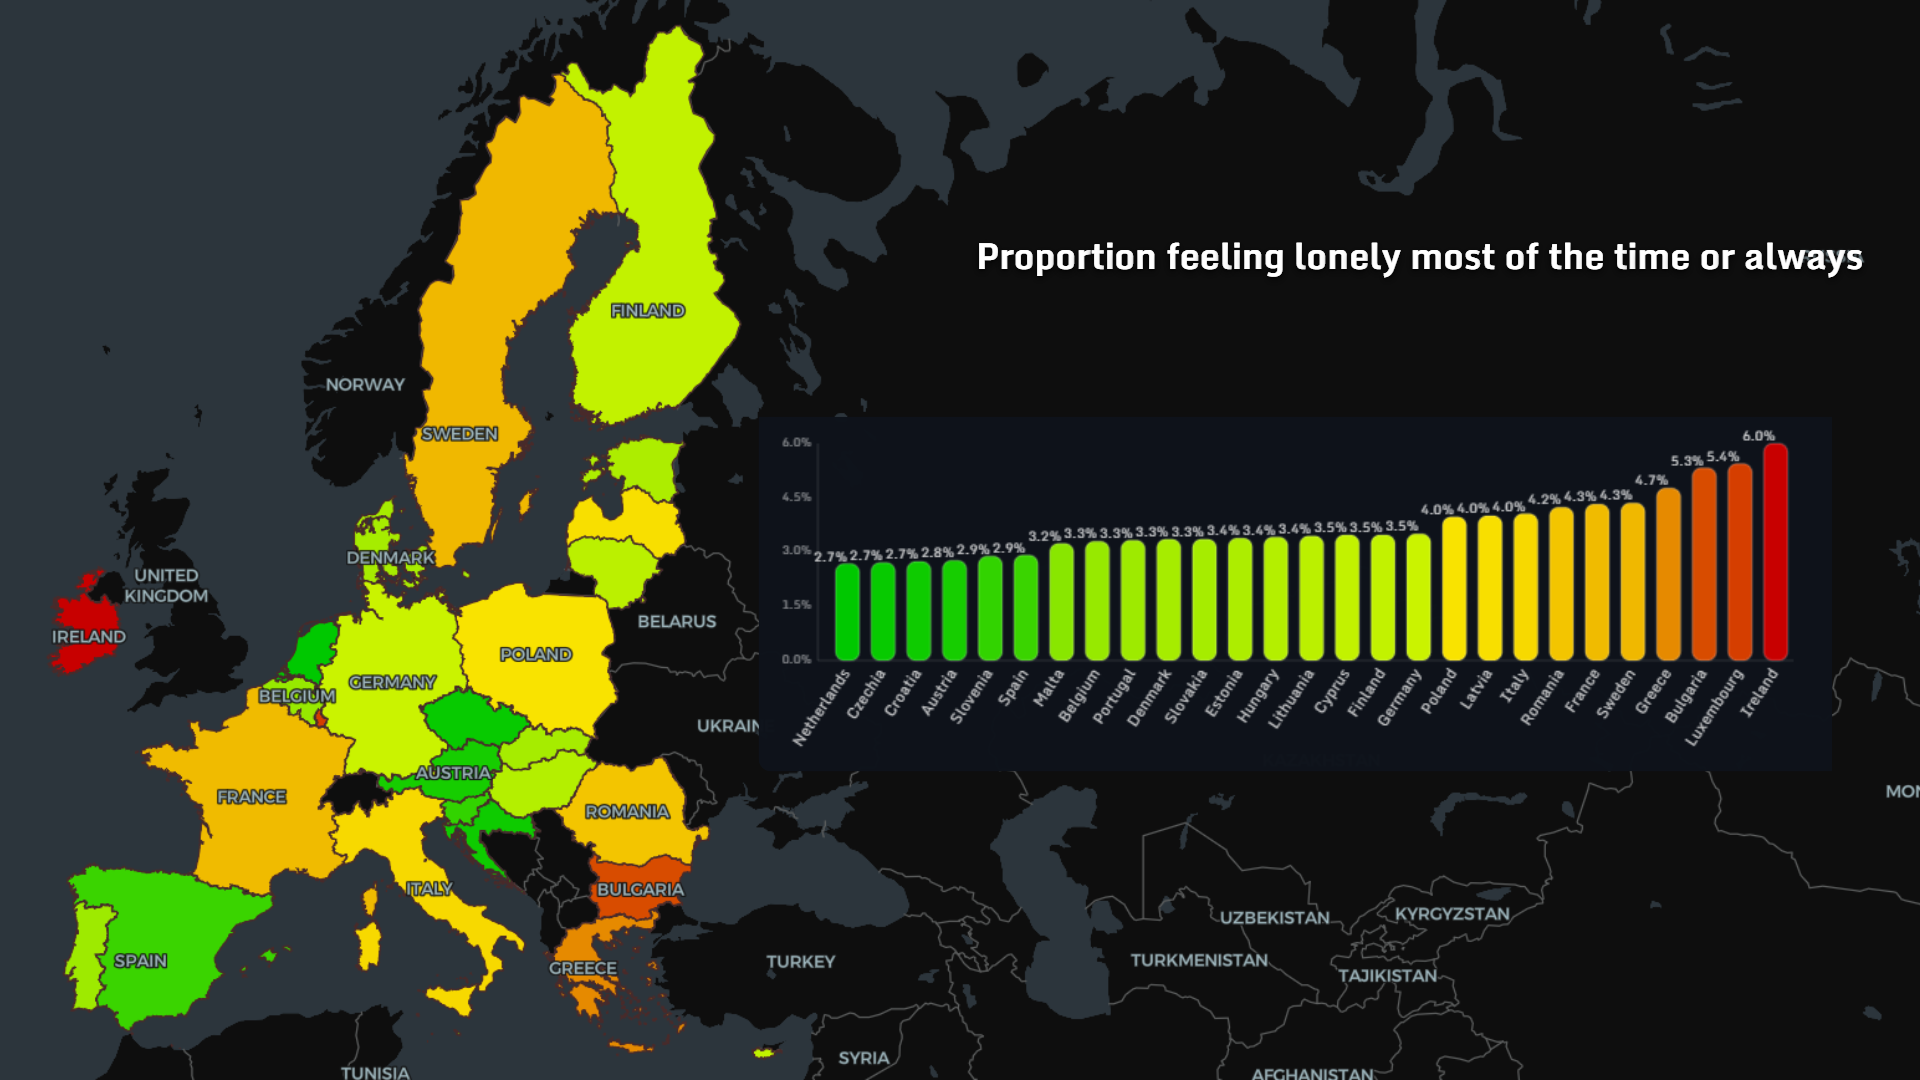
The loneliness map Europe 2026 highlights something less visible:
- Ireland shows the highest share (~6%)
- Southern and Eastern Europe trend higher
- Central Europe remains more balanced
⚠️ Social Vulnerability
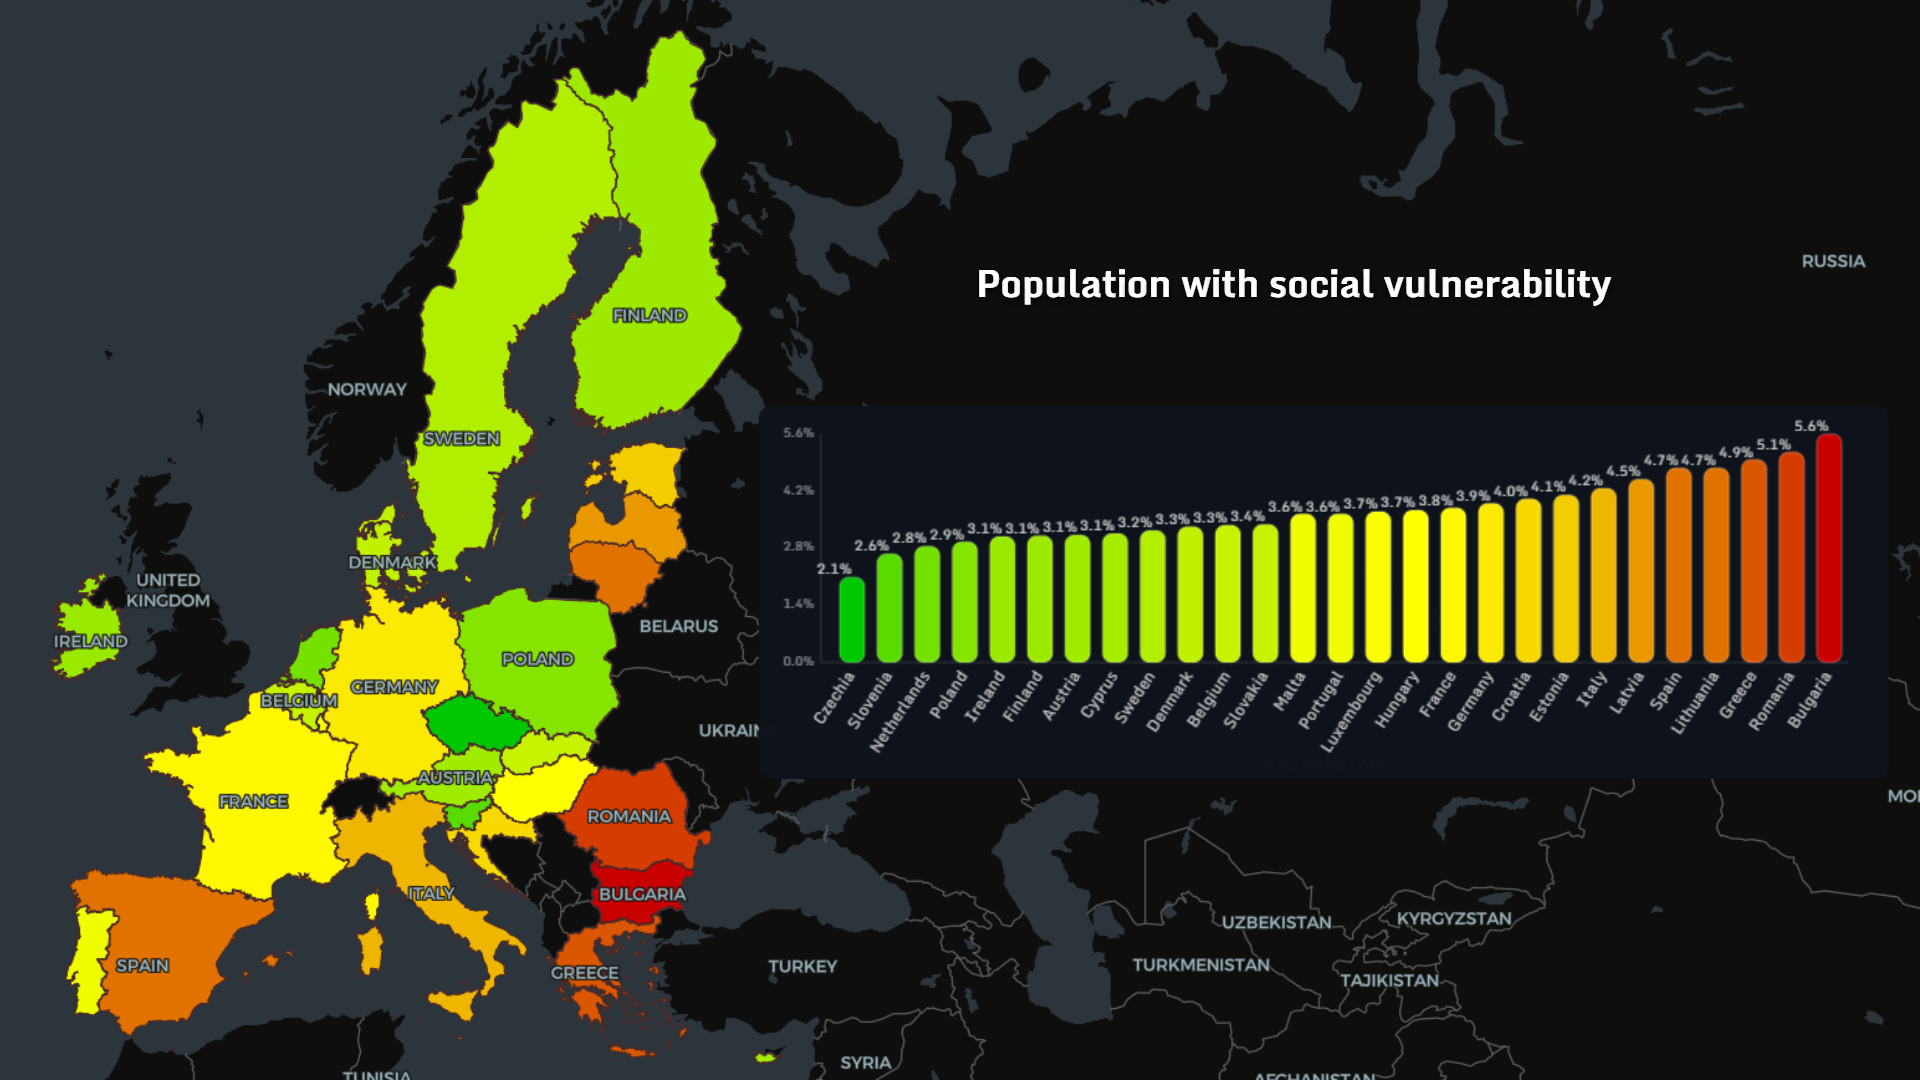
The social vulnerability map 2026 shows:
- Bulgaria, Romania, Greece at the highest levels
- Western Europe maintains lower exposure
- income inequality
- employment stability
- access to services
💸 Material Deprivation
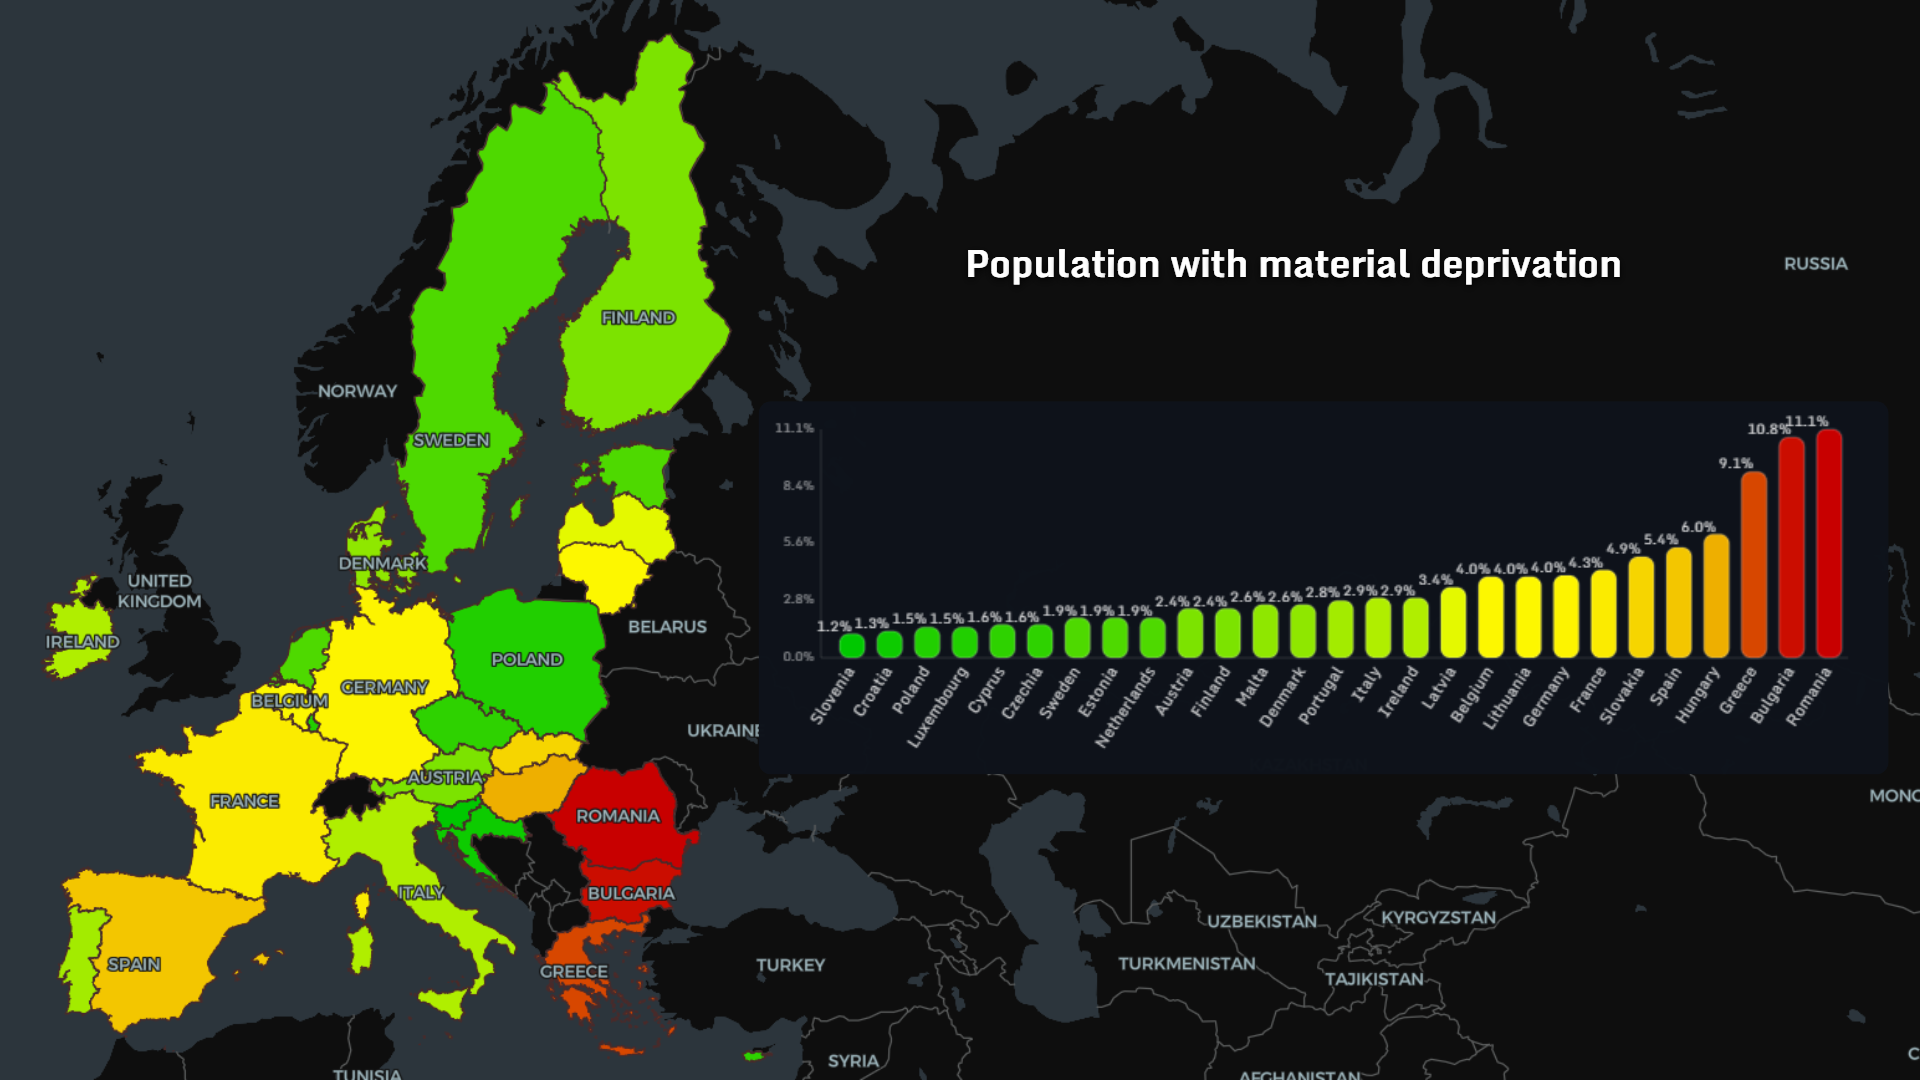
Material deprivation reveals deeper economic stress:
- Romania and Bulgaria lead (~11%)
- Greece also elevated
- Northern Europe shows minimal deprivation
🏫 Education System Stress (2000–2026)
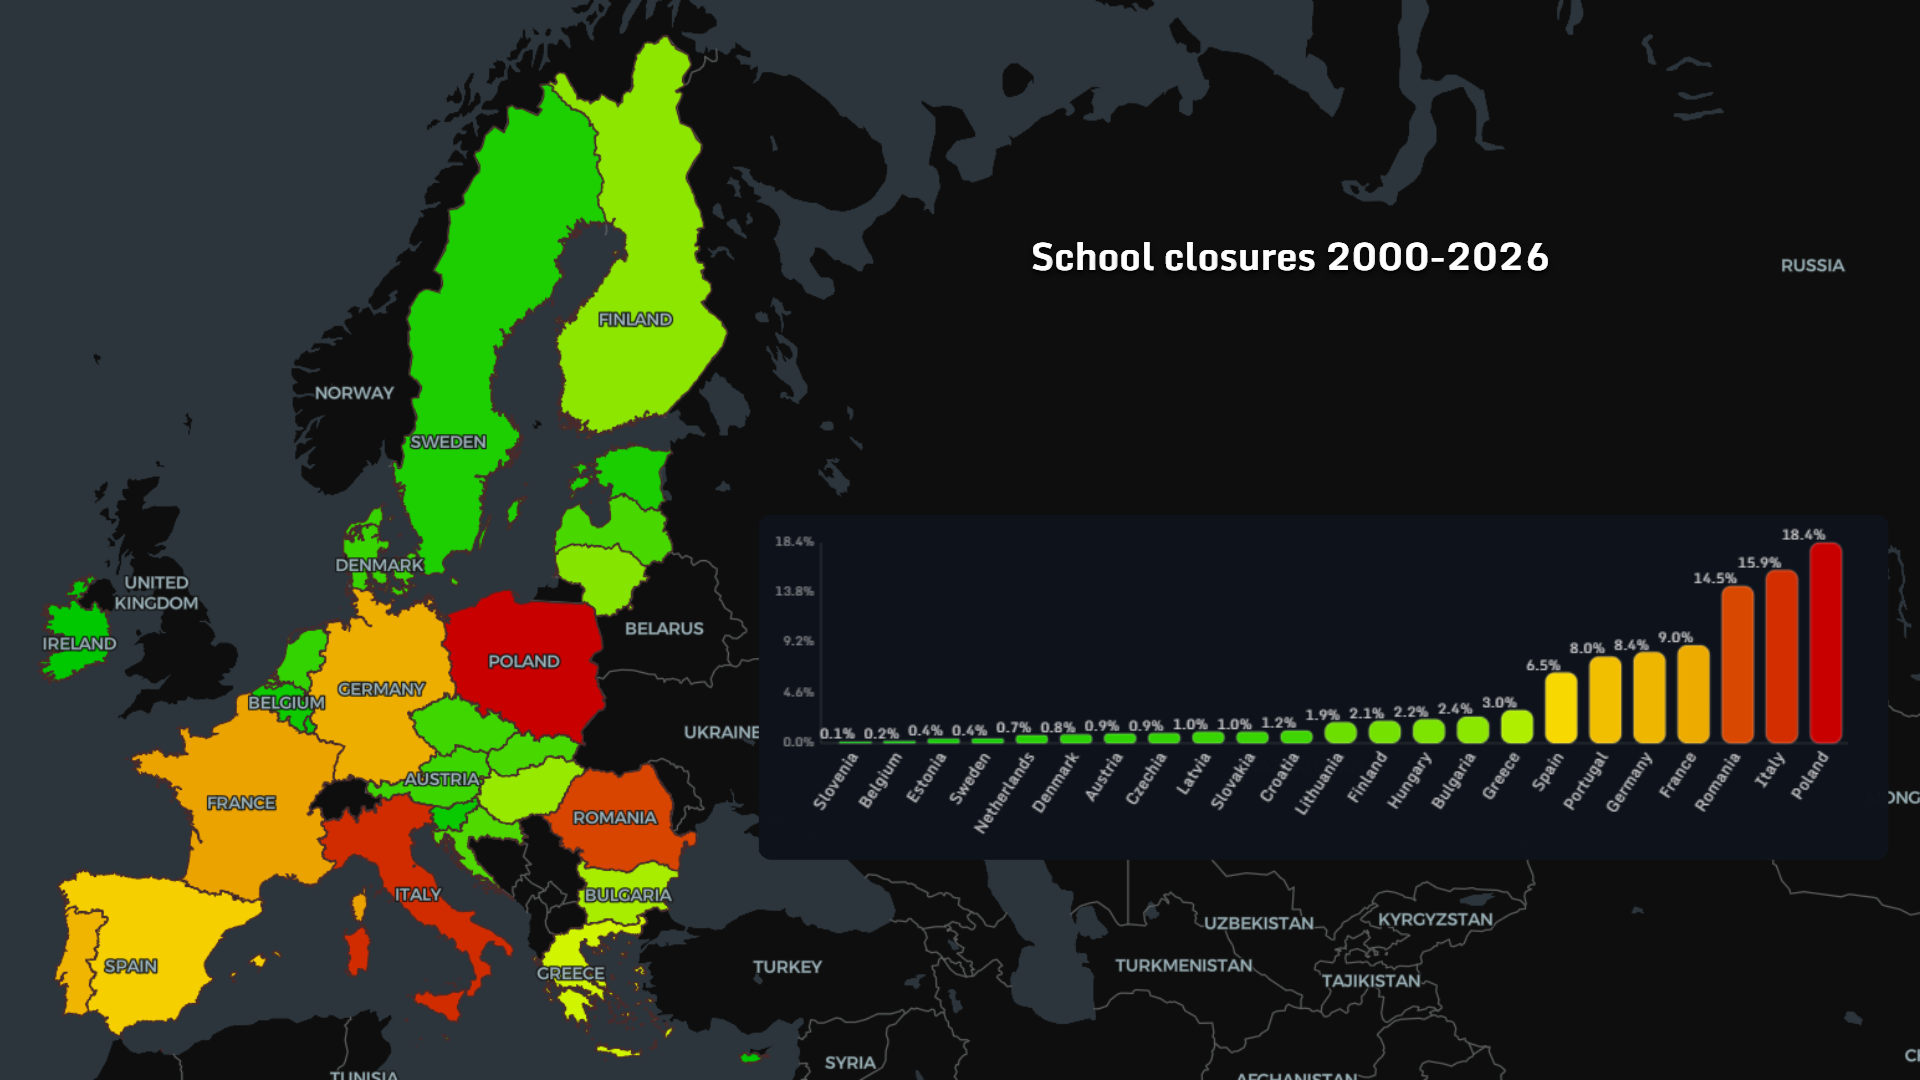
School closures reflect demographic shifts:
- Poland, Italy, Romania show the largest declines
- Western Europe remains relatively stable
🏥 Decline in Hospitals
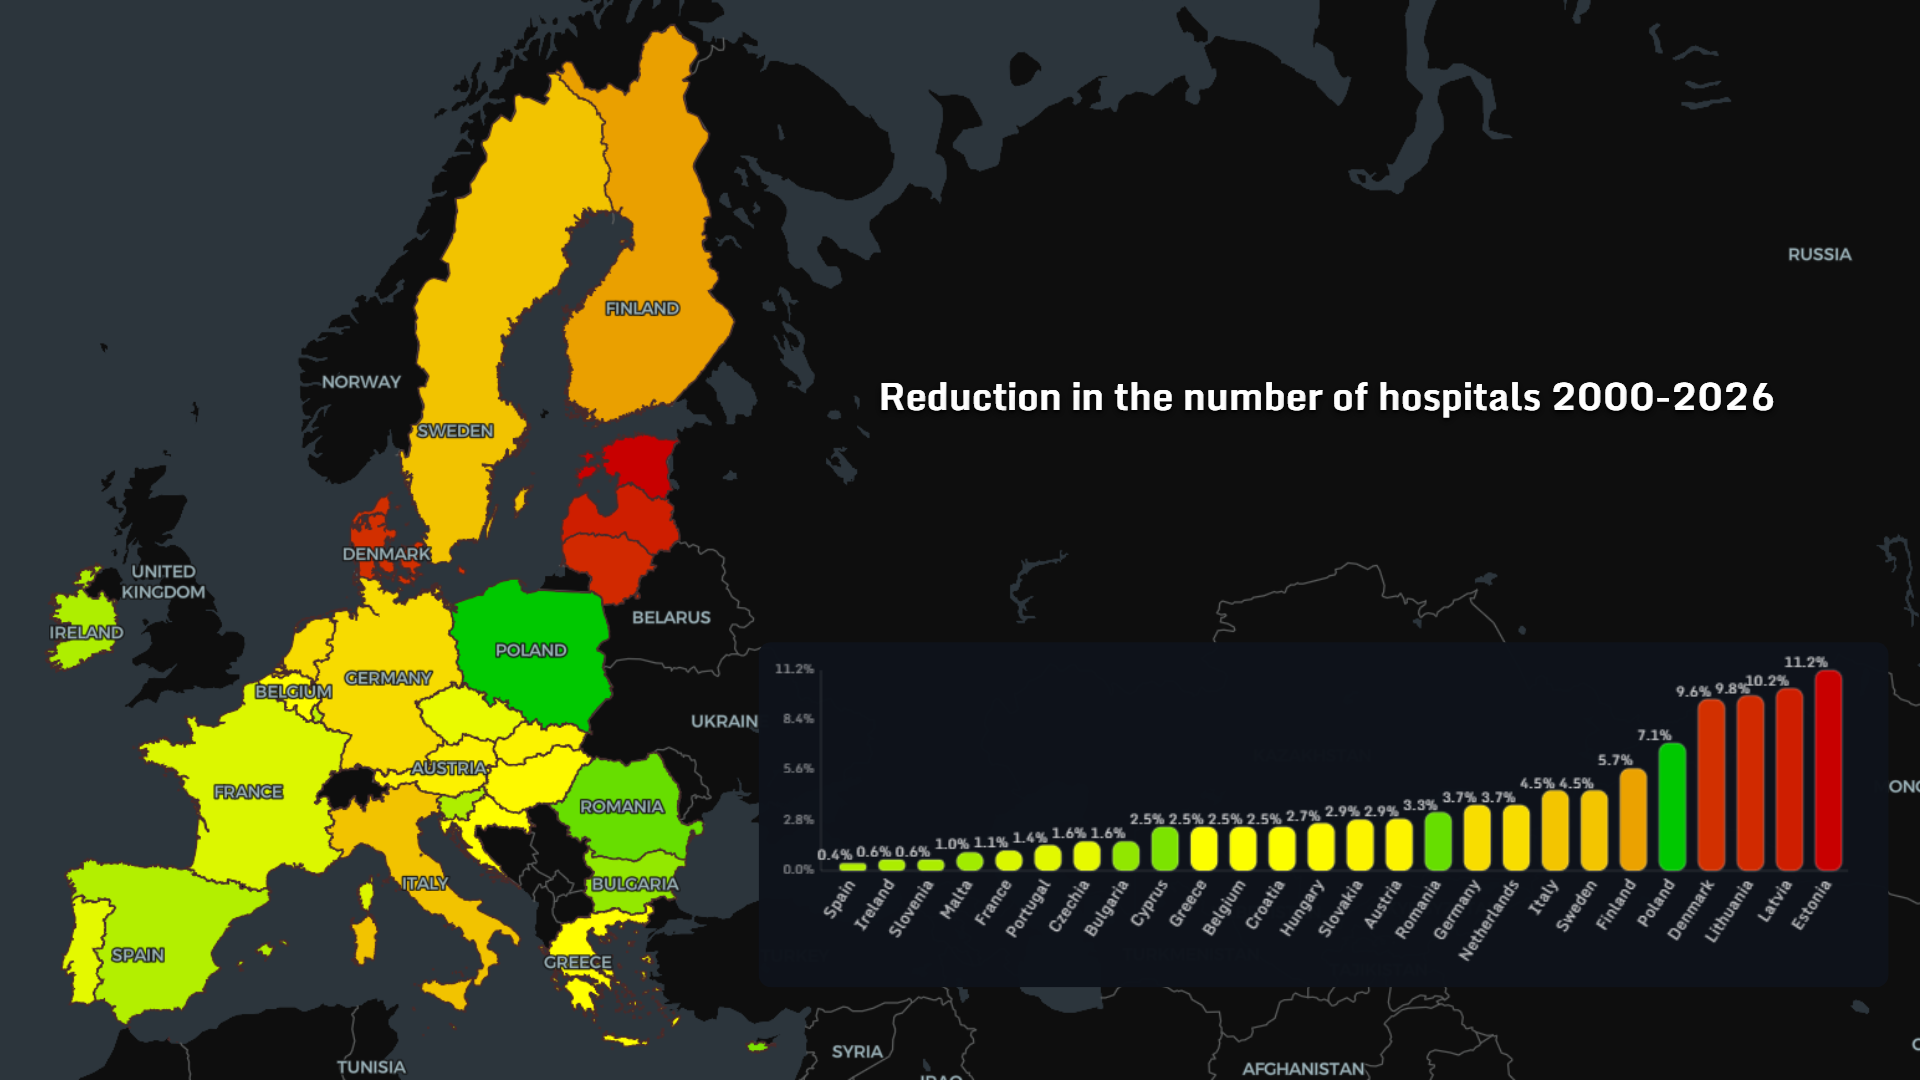
The health infrastructure map shows:
- Baltic states and Eastern Europe experiencing major reductions
- Western Europe seeing moderate decline
🌾 Shrinking Agricultural Capacity
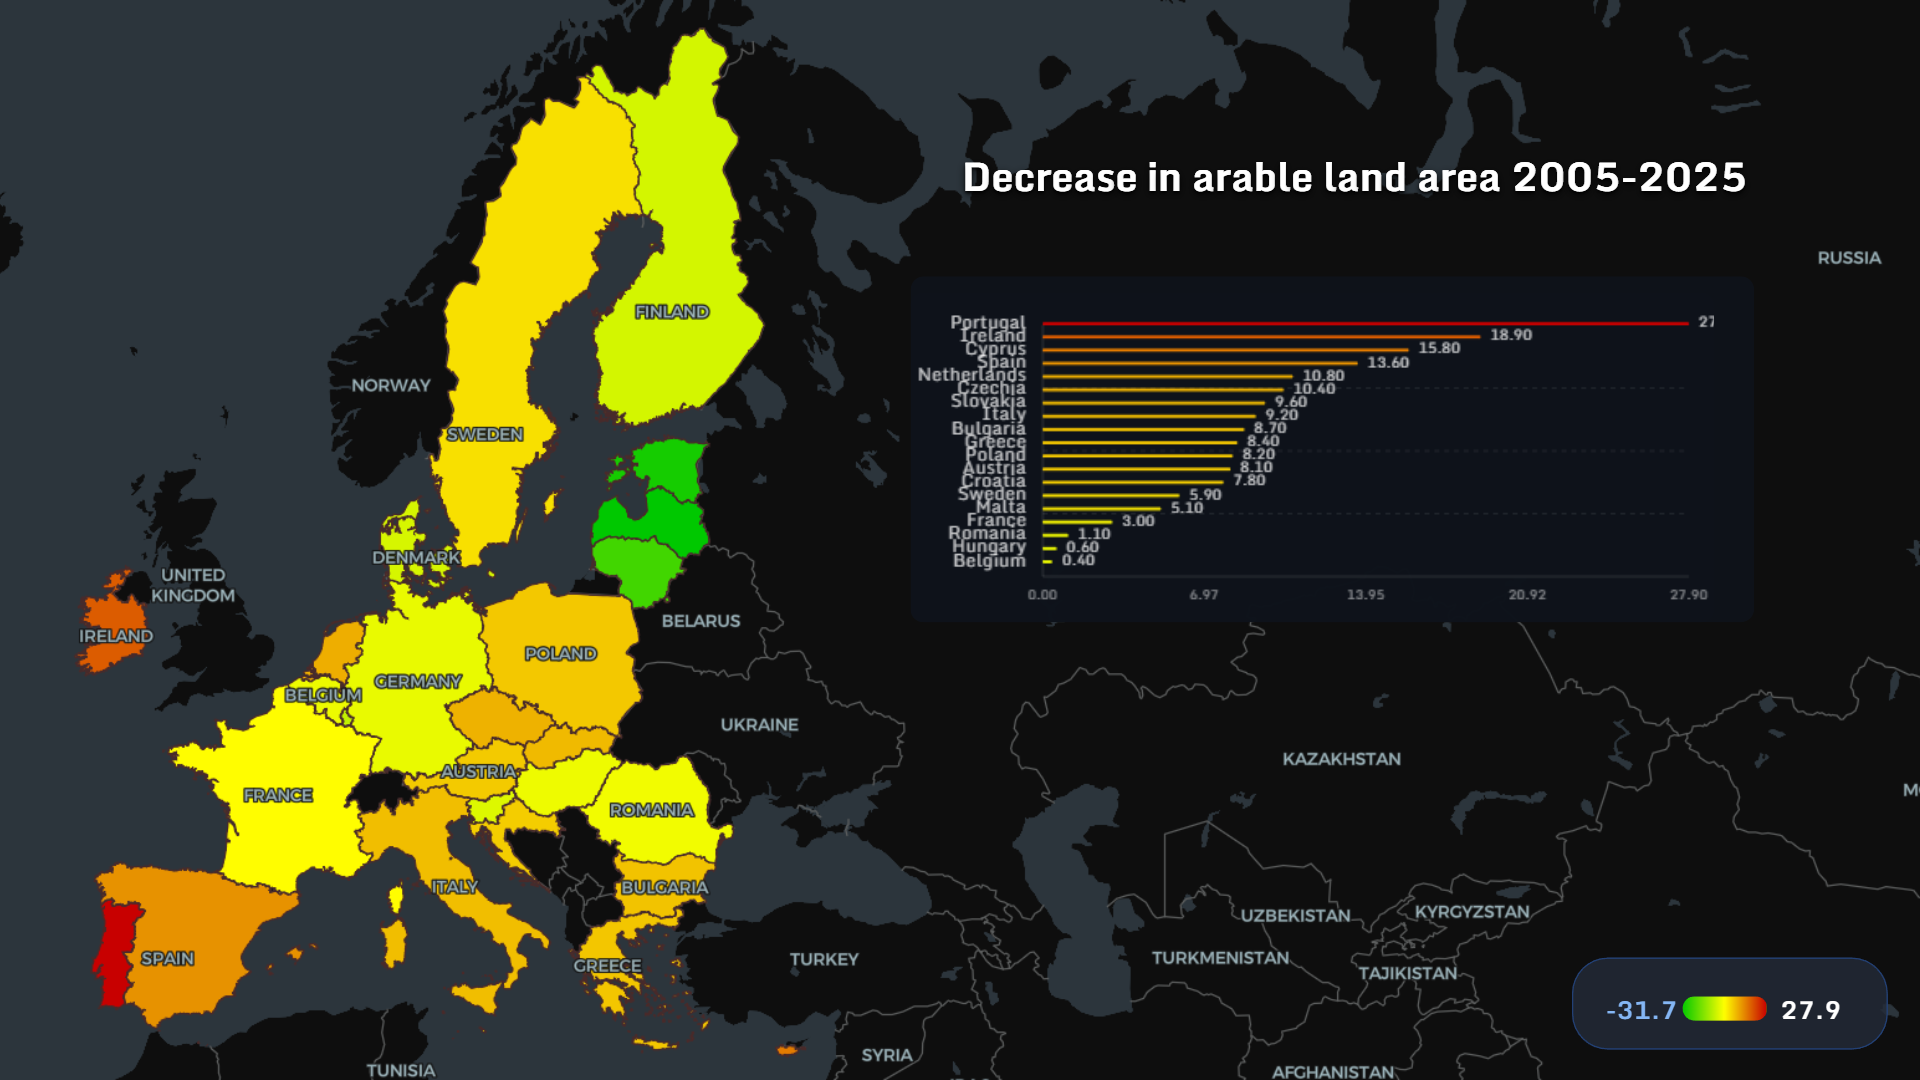
The arable land decline map Europe shows:
- Portugal, Ireland, Cyprus leading losses
- General downward trend across Europe
🚜 Collapse in Farm Numbers
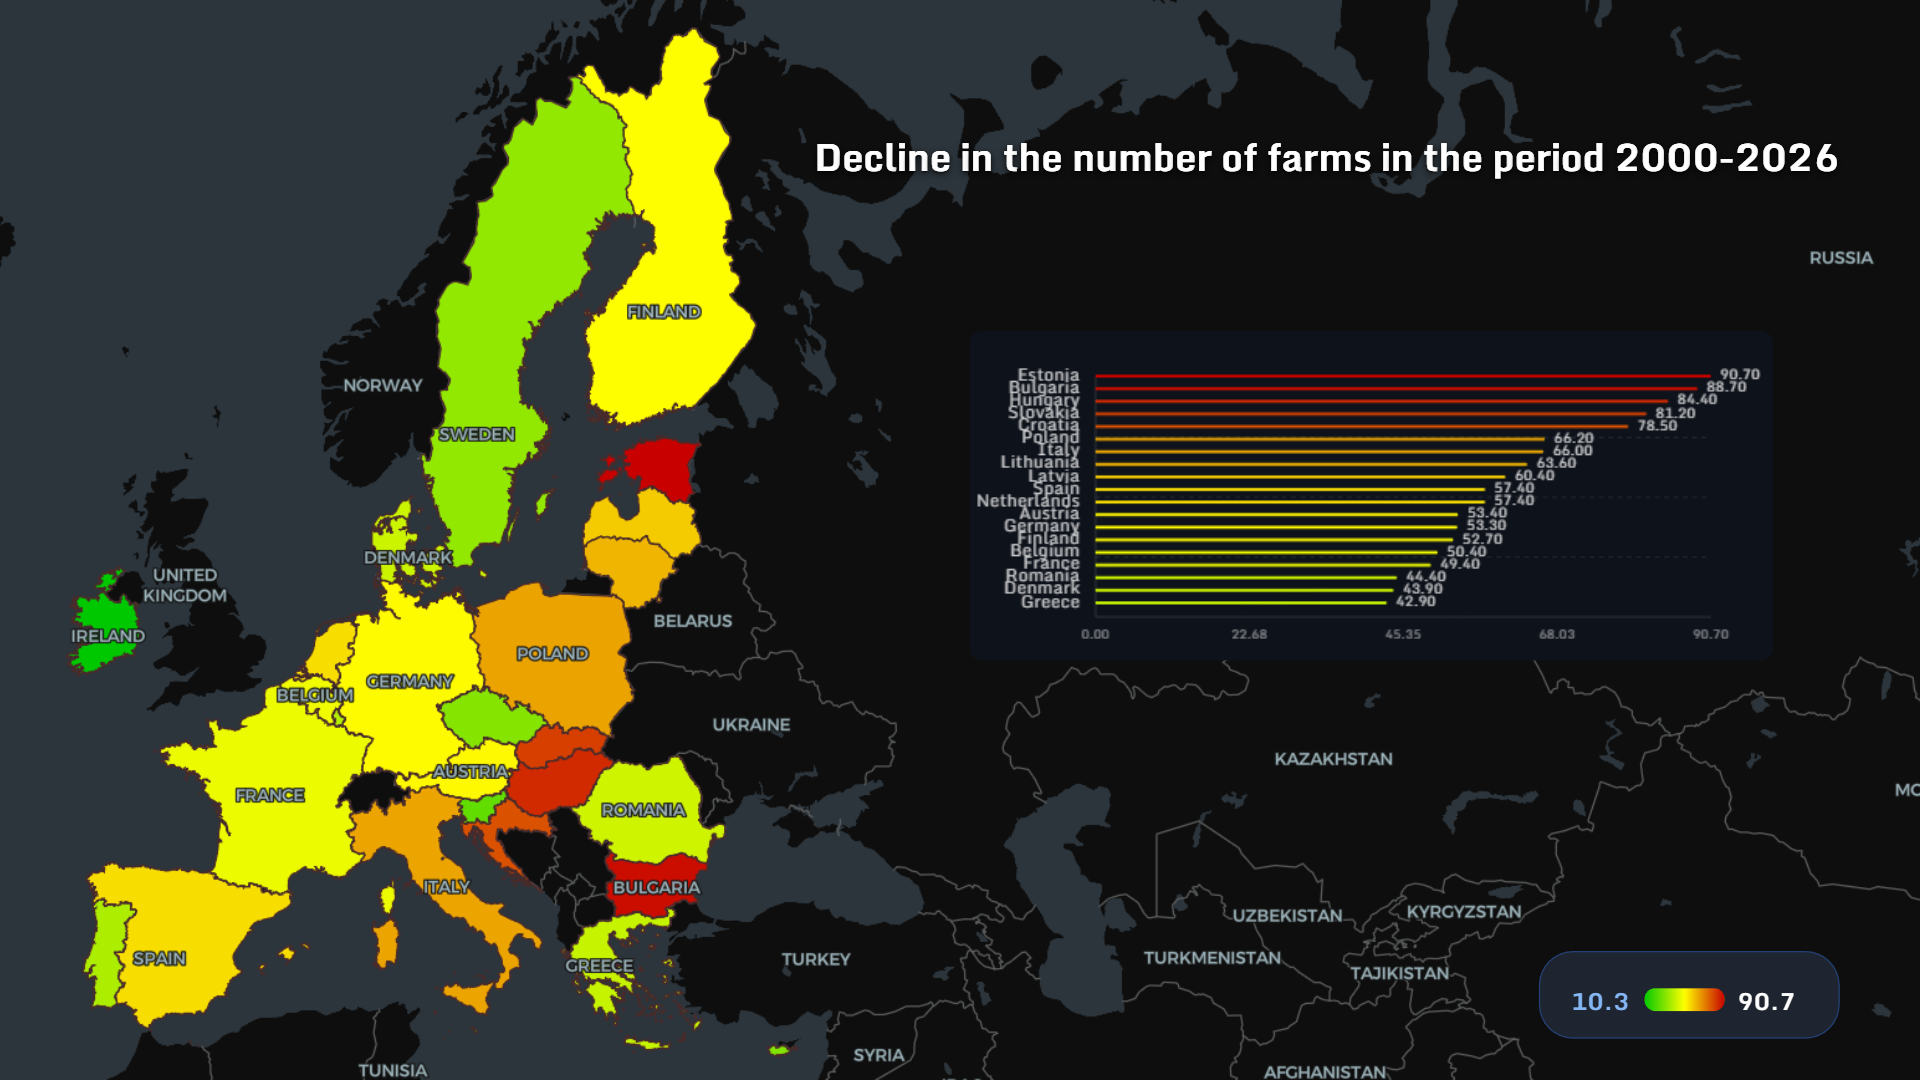
The farm decline map 2026 highlights:
- Estonia, Bulgaria, Hungary seeing extreme drops
- Structural shift toward industrial agriculture
👴 Aging Europe
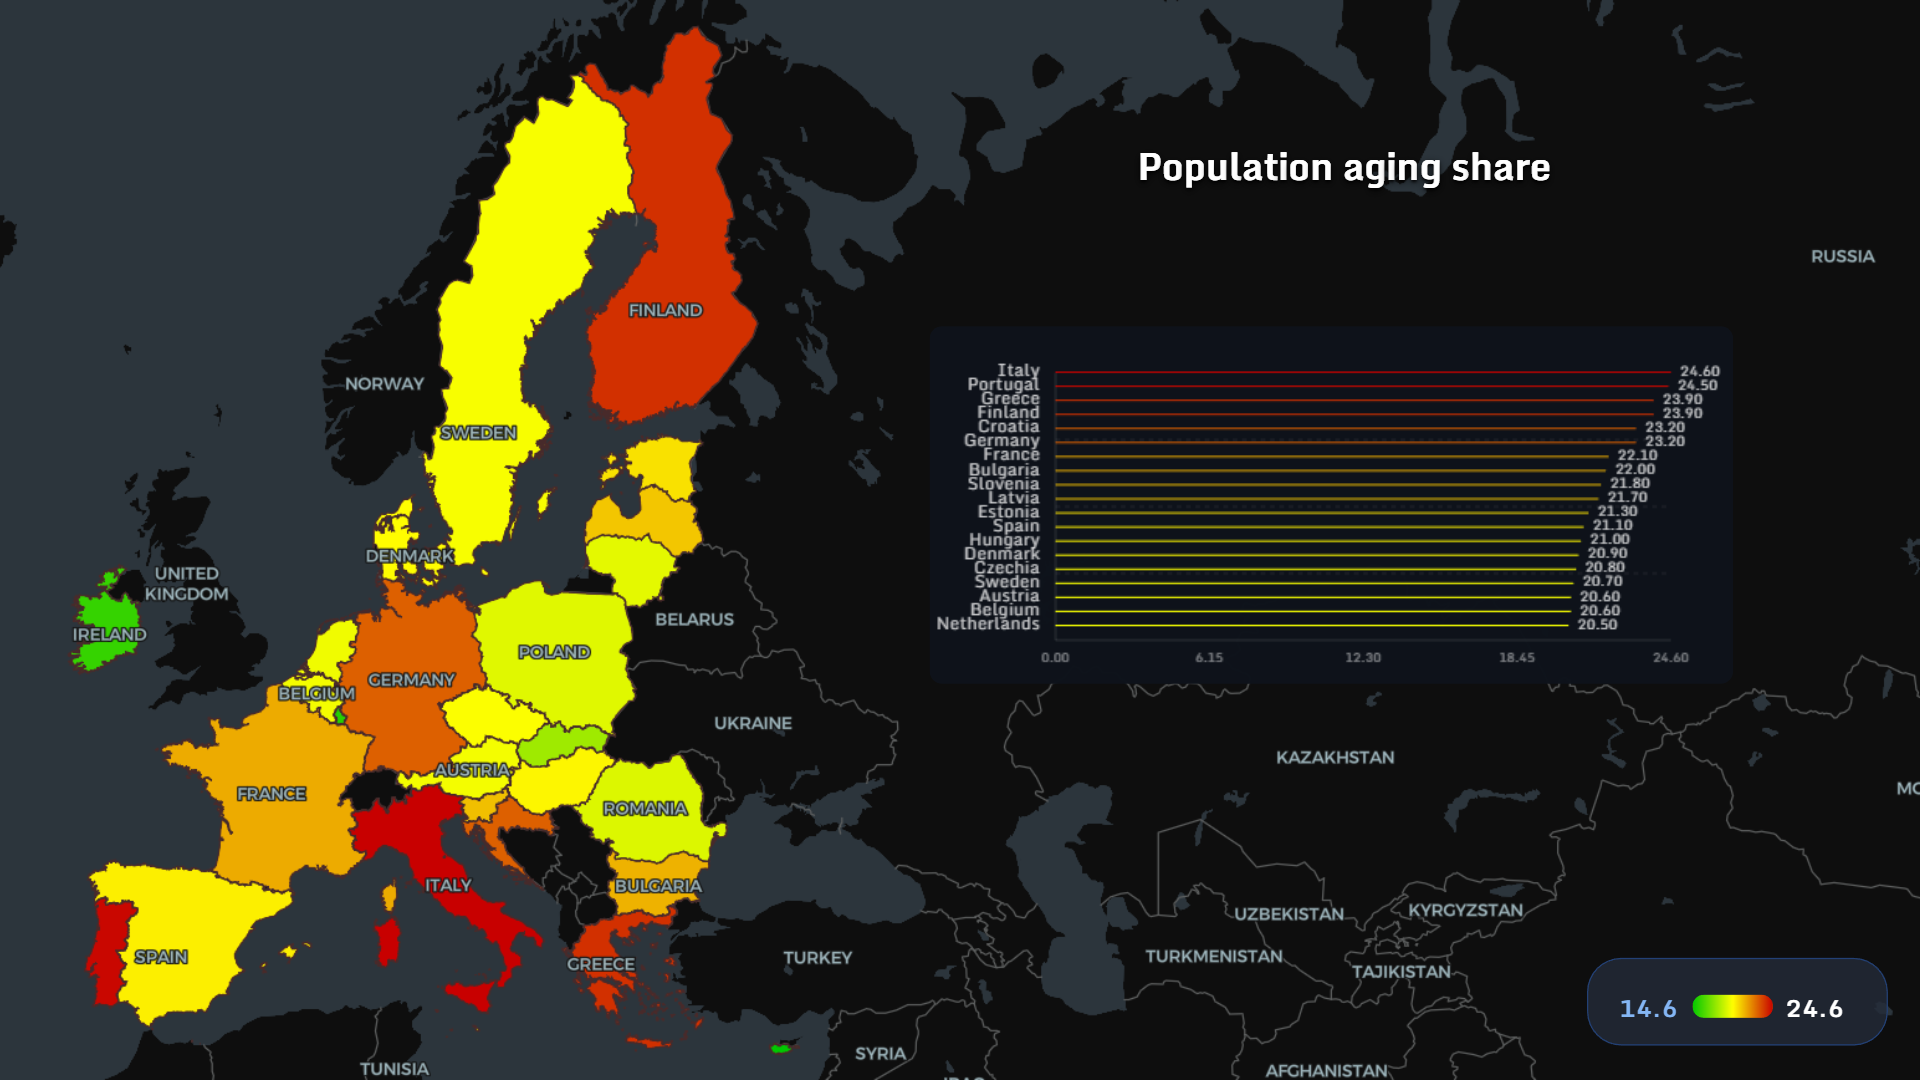
The aging population map Europe 2026:
- Italy (~24.6%), Portugal, Greece leading
- Entire continent trending upward
🌍 Migration as a Counterbalance
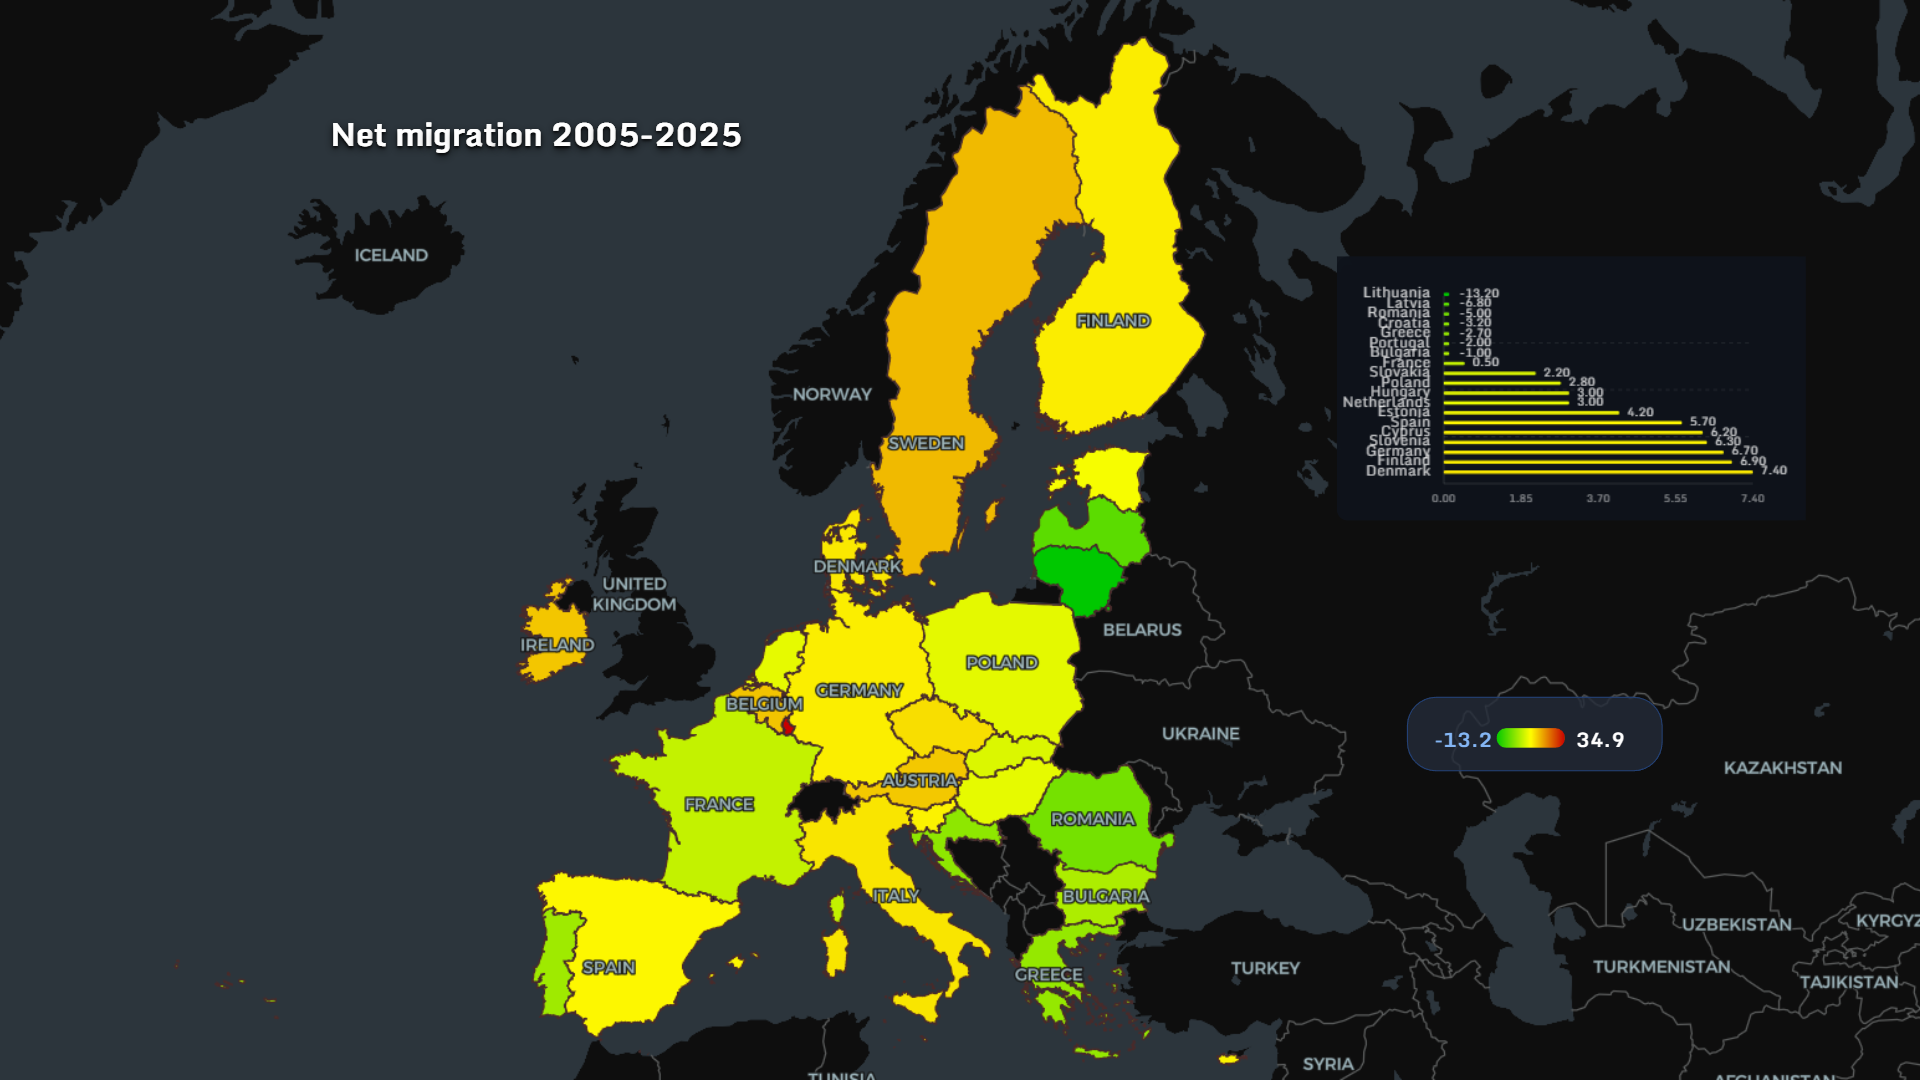
Migration partially offsets decline:
- Germany, Spain, UK see strong inflows
- Eastern Europe experiences outflows
📉 Natural Population Decline
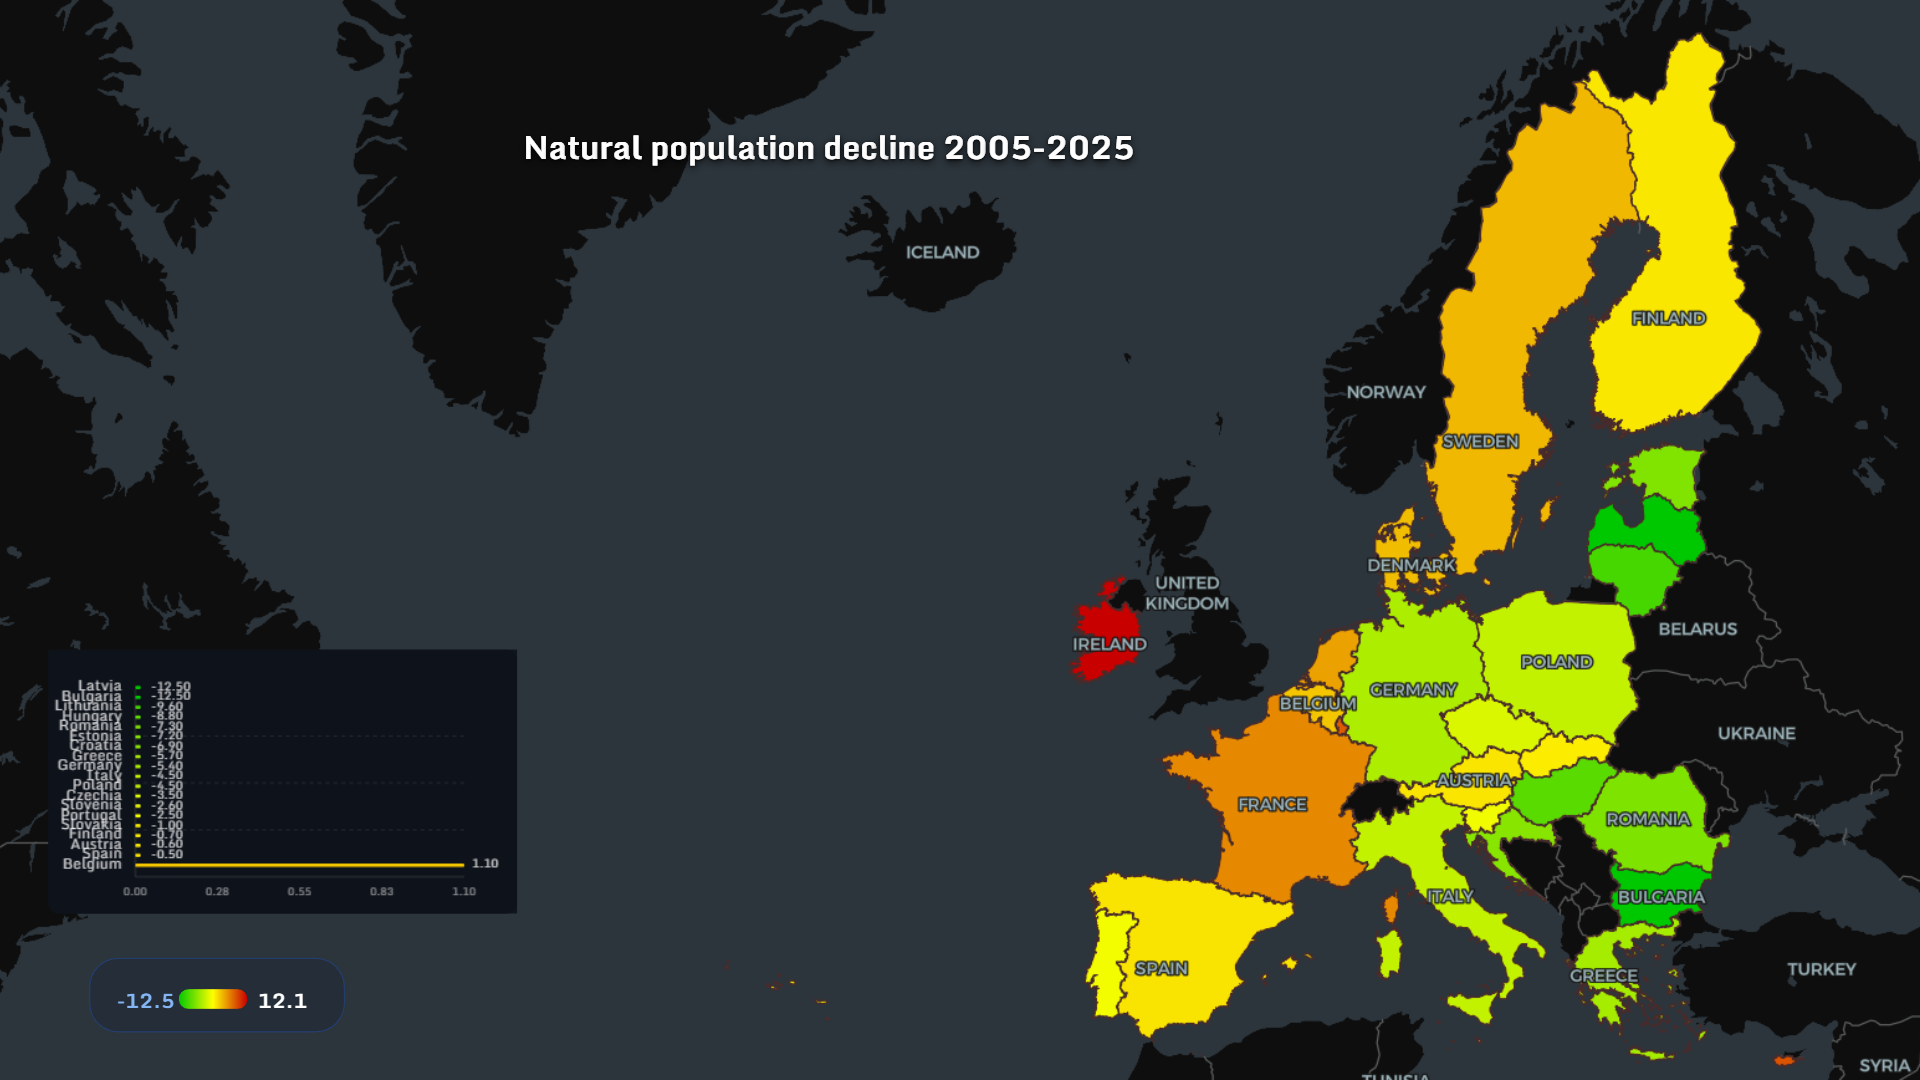
The natural decline map Europe shows:
- Baltic states, Bulgaria, Romania leading declines
- Western Europe less affected
📊 Total Population Change (2005–2025)
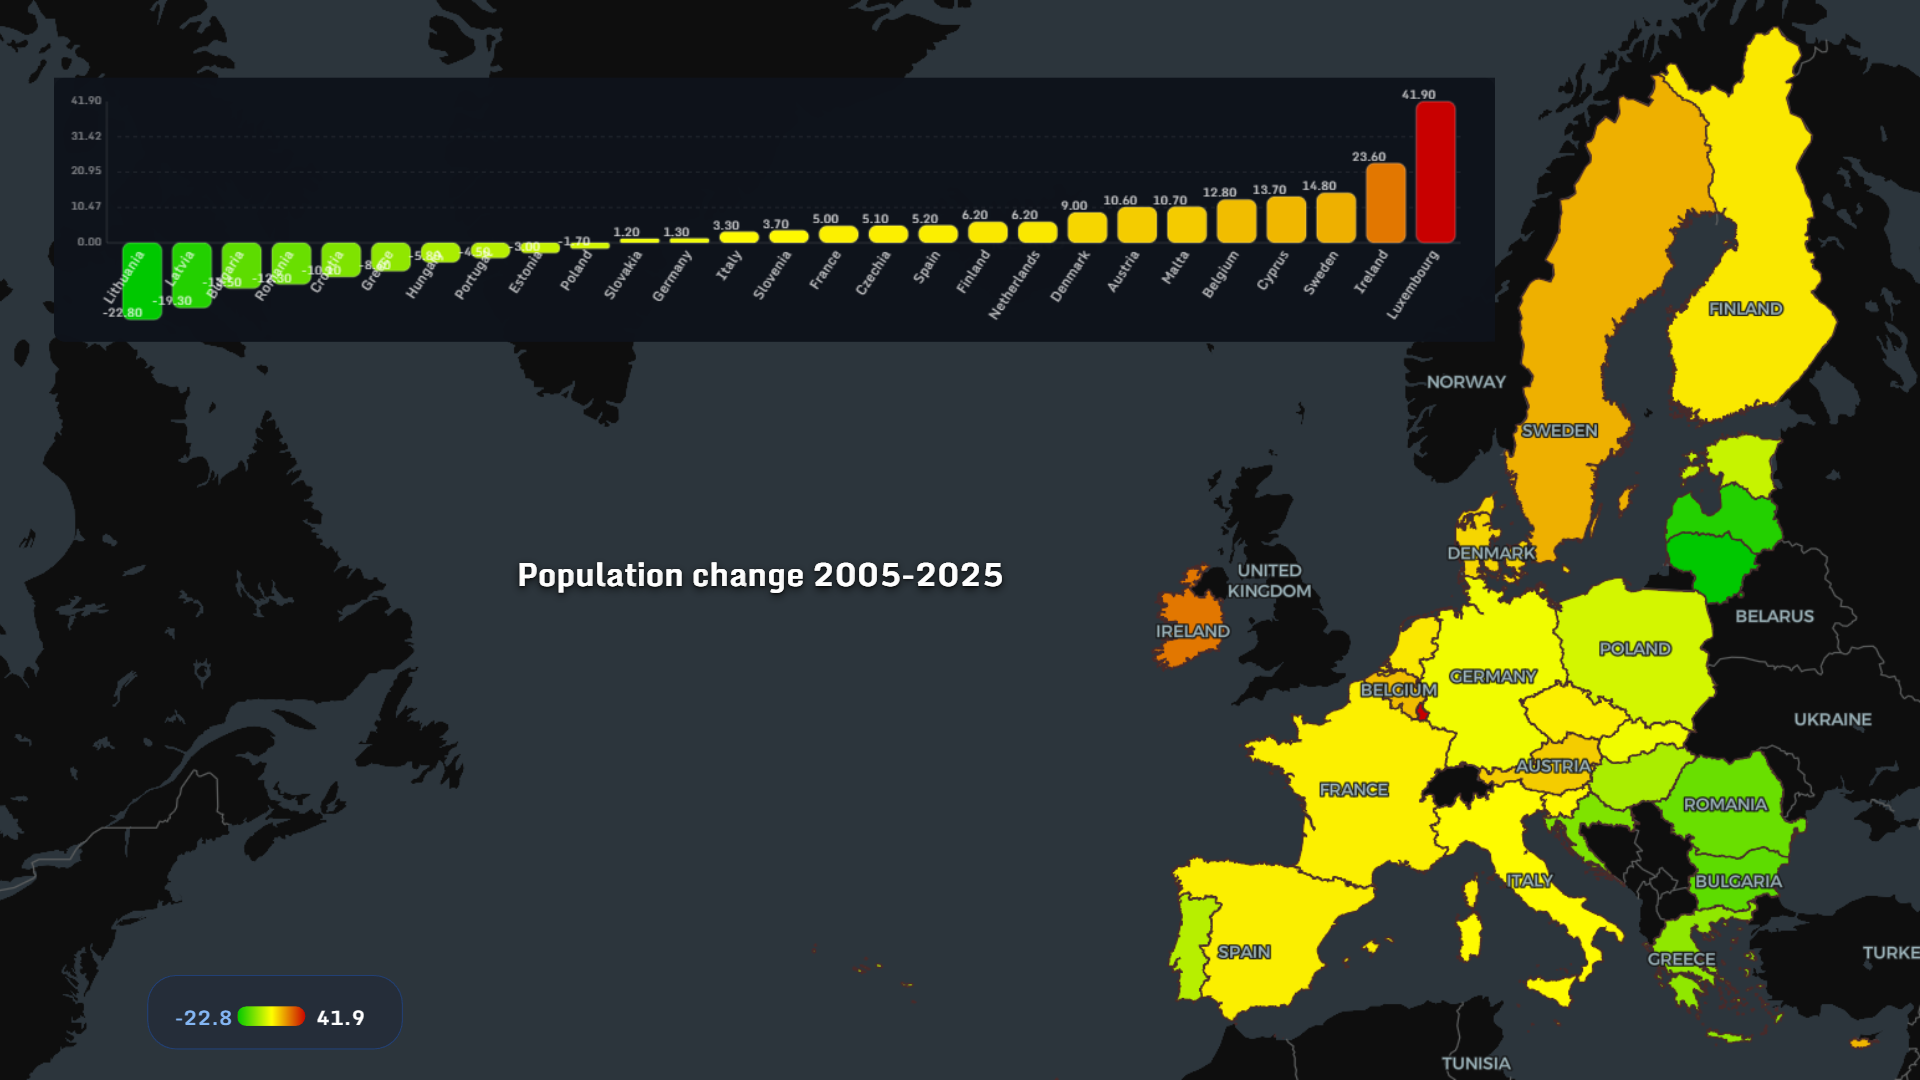
Final layer:
- Luxembourg and Ireland growing strongly
- Eastern Europe shrinking rapidly
🧩 The Bigger Picture
Across all maps, one pattern emerges:
- Economic pressure
- Demographic decline
- Social fragmentation
- Infrastructure contraction
They reinforce each other.
> Europe’s challenge in 2026 is not growth — > it is sustainability of its own systems.
🚀 Why This Matters
With MAPTHOS, you can:
- Layer housing + aging + migration in seconds
- Detect hidden correlations across countries
- Build your own Europe data visualization narratives
🌍 Final Thought
Europe is not collapsing. But it is transforming under pressure.
And the question is no longer: “Is there a crisis?”
It’s: 👉 How many of these trends can coexist before systems start to break?
👉 Explore more at app.mapthos.org
See the world. Map better. Dream big. 🌍✨