
🌍 Crypto Adoption by Country in 2026: Where Digital Money Became Real
Crypto was supposed to be a financial revolution. But in 2026, the map tells a quieter story: it became most meaningful where the old system felt least reliable.
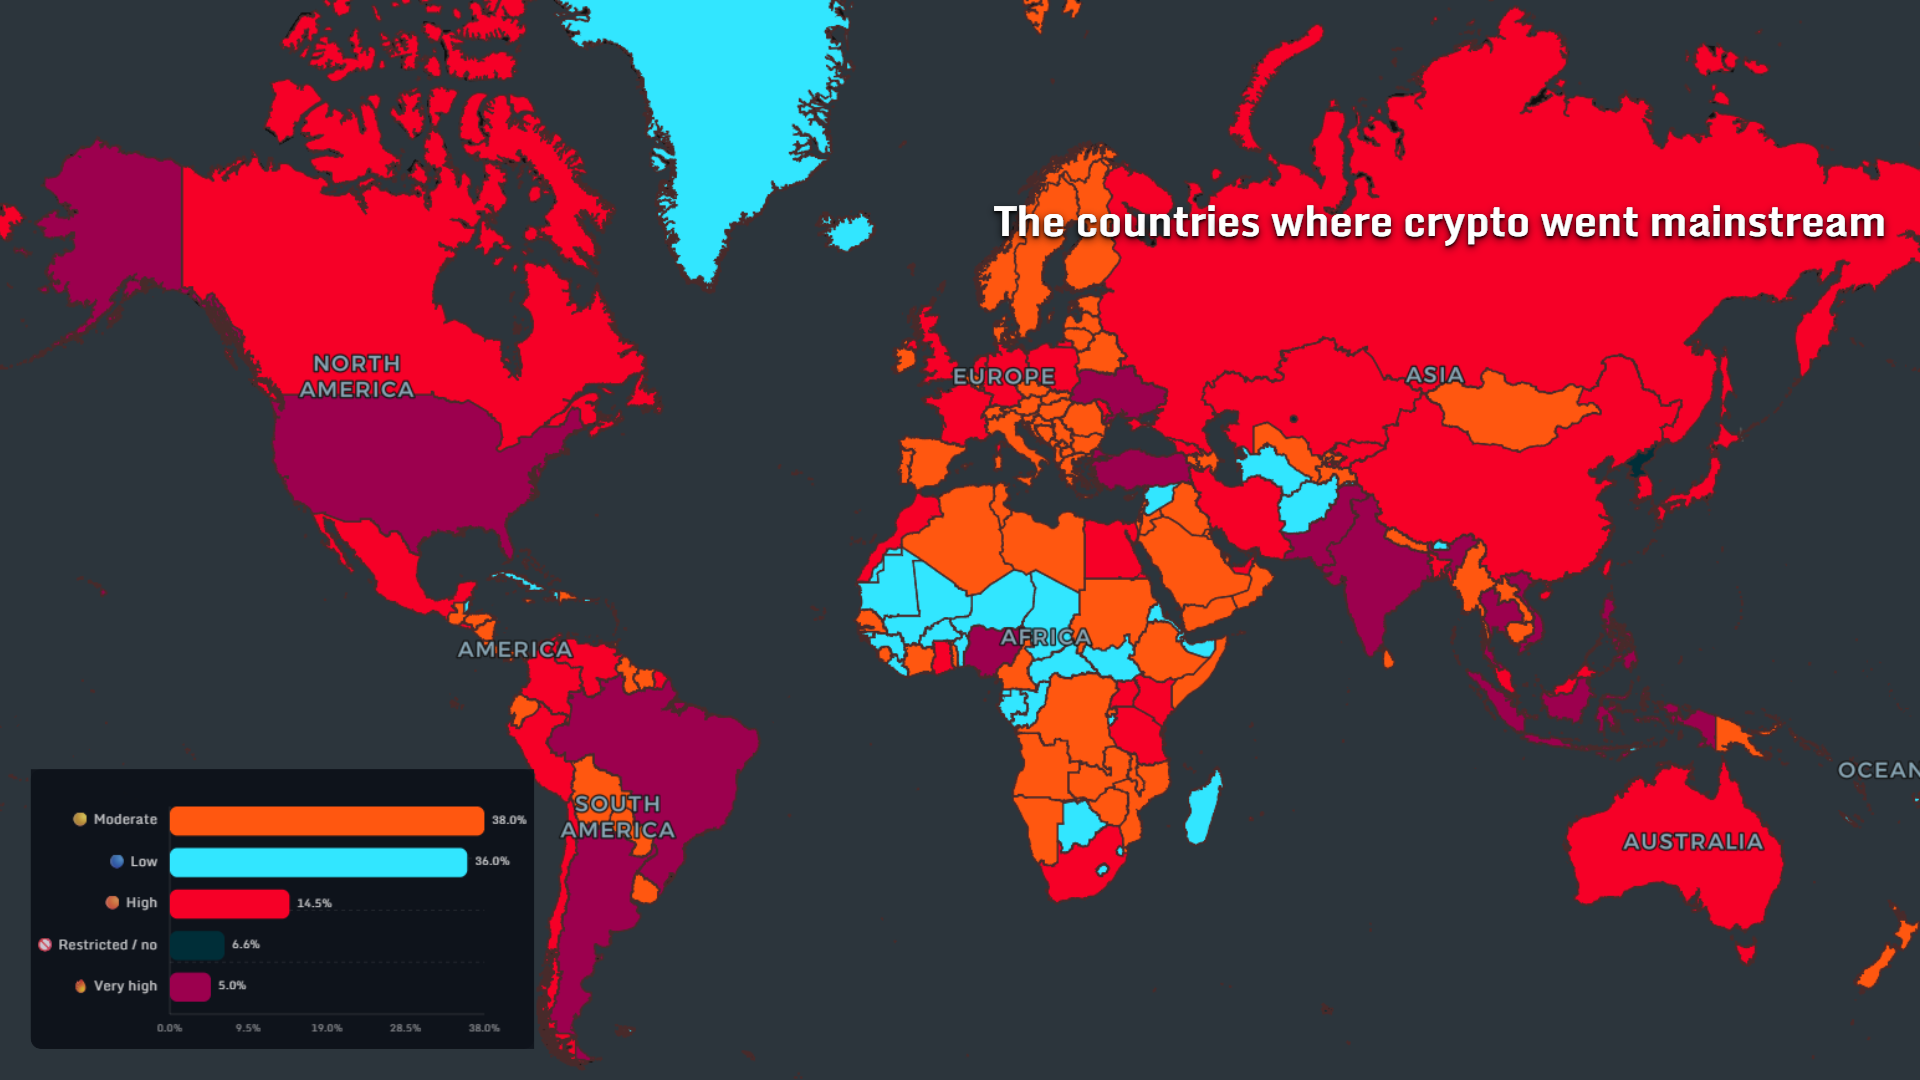
The countries where crypto went mainstream in 2026
The first map shows a broad split: crypto is no longer only a speculative layer for wealthy markets. Moderate adoption covers 38.0% of mapped countries, while low adoption still represents 36.0%. High and very high adoption together form a smaller but highly visible layer across parts of Asia, Latin America, Eastern Europe, and Africa.
The interesting part is not just where crypto is popular. It is where it became socially normal.
Where weak banks made crypto stronger
In countries with limited banking access or unstable financial infrastructure, crypto often looks less like a casino and more like a workaround. This map highlights that pattern: 38.8% of countries are mostly banked, but 26.4% still sit in a limited low-bank category.
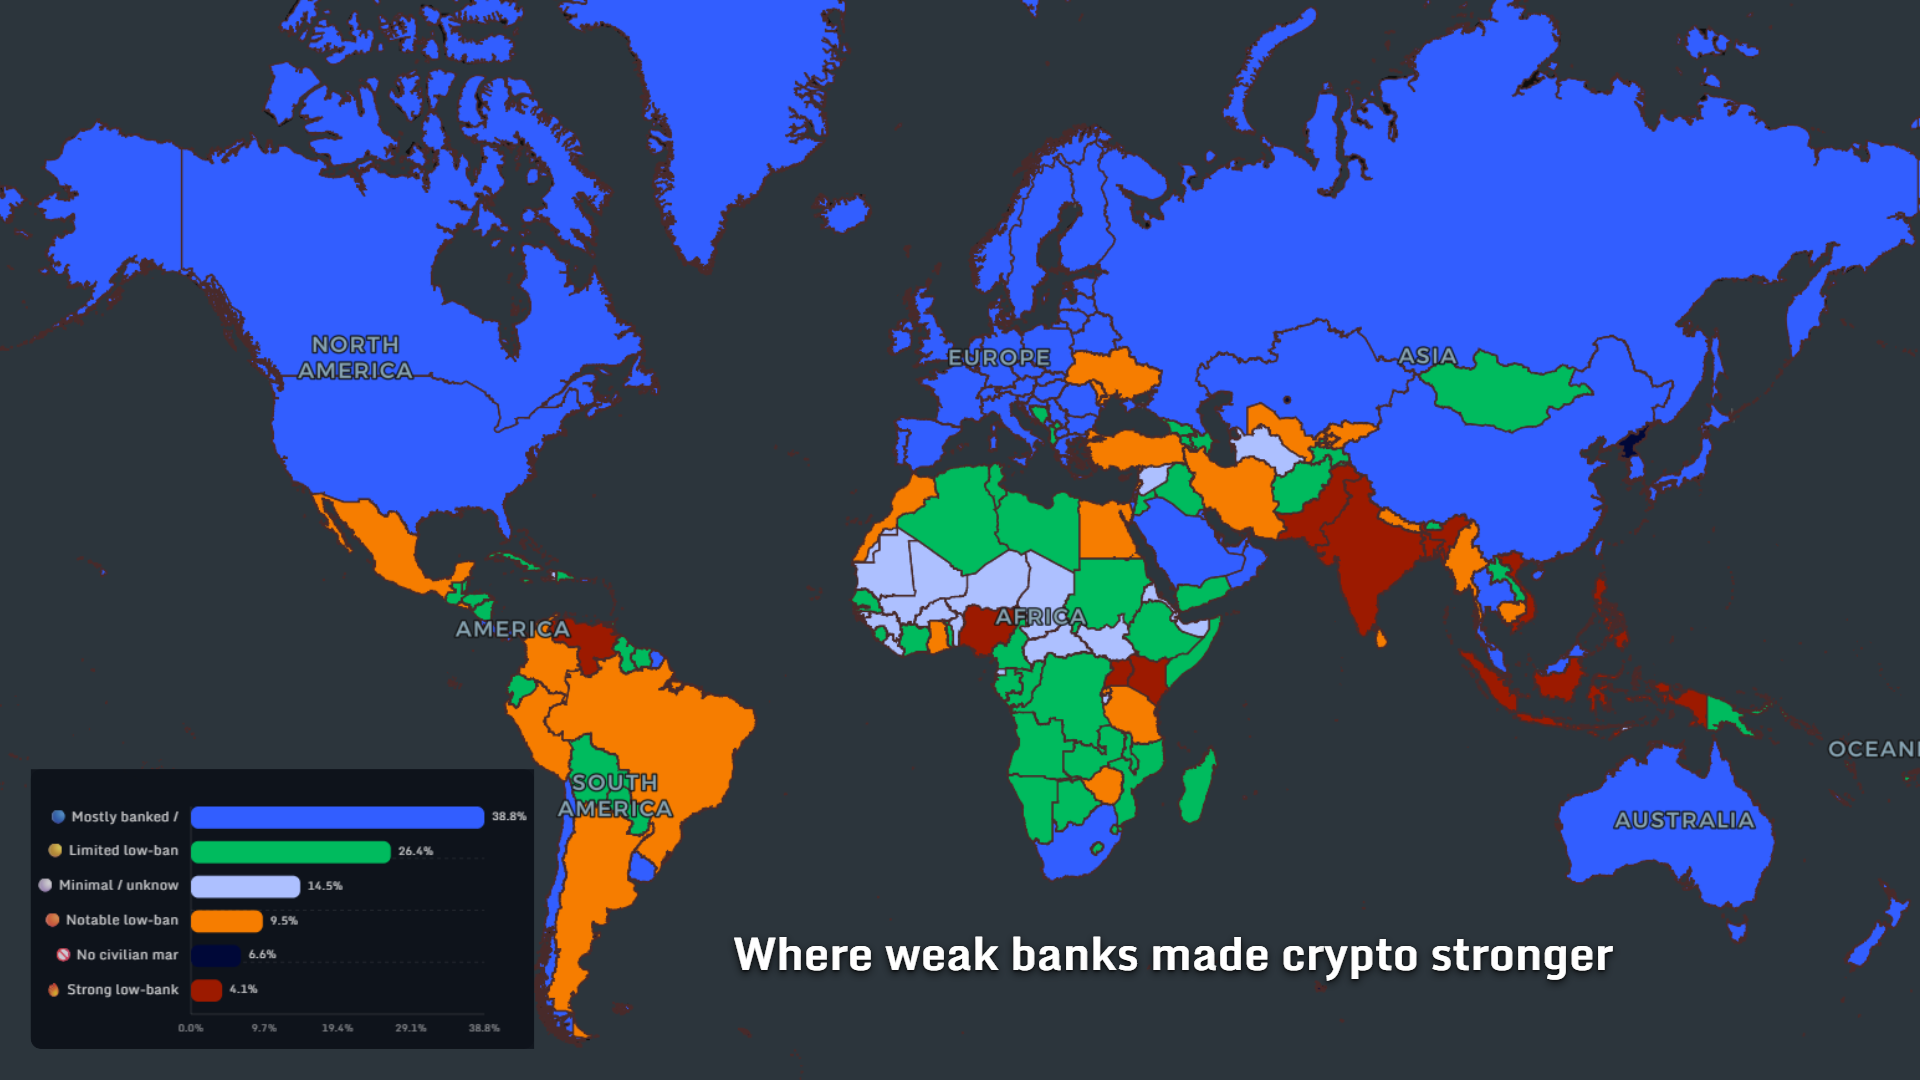
That gap matters. When banking is slow, expensive, politicized, or simply unavailable, digital wallets become more than apps. They become financial shelter.
Where crypto is bigger than it should be
This map compares crypto relevance against income level. The result is one of the strongest signals in the whole dataset: 33.5% of countries sit below income expectations, but 11.2% are above income level and 5.8% are far above.
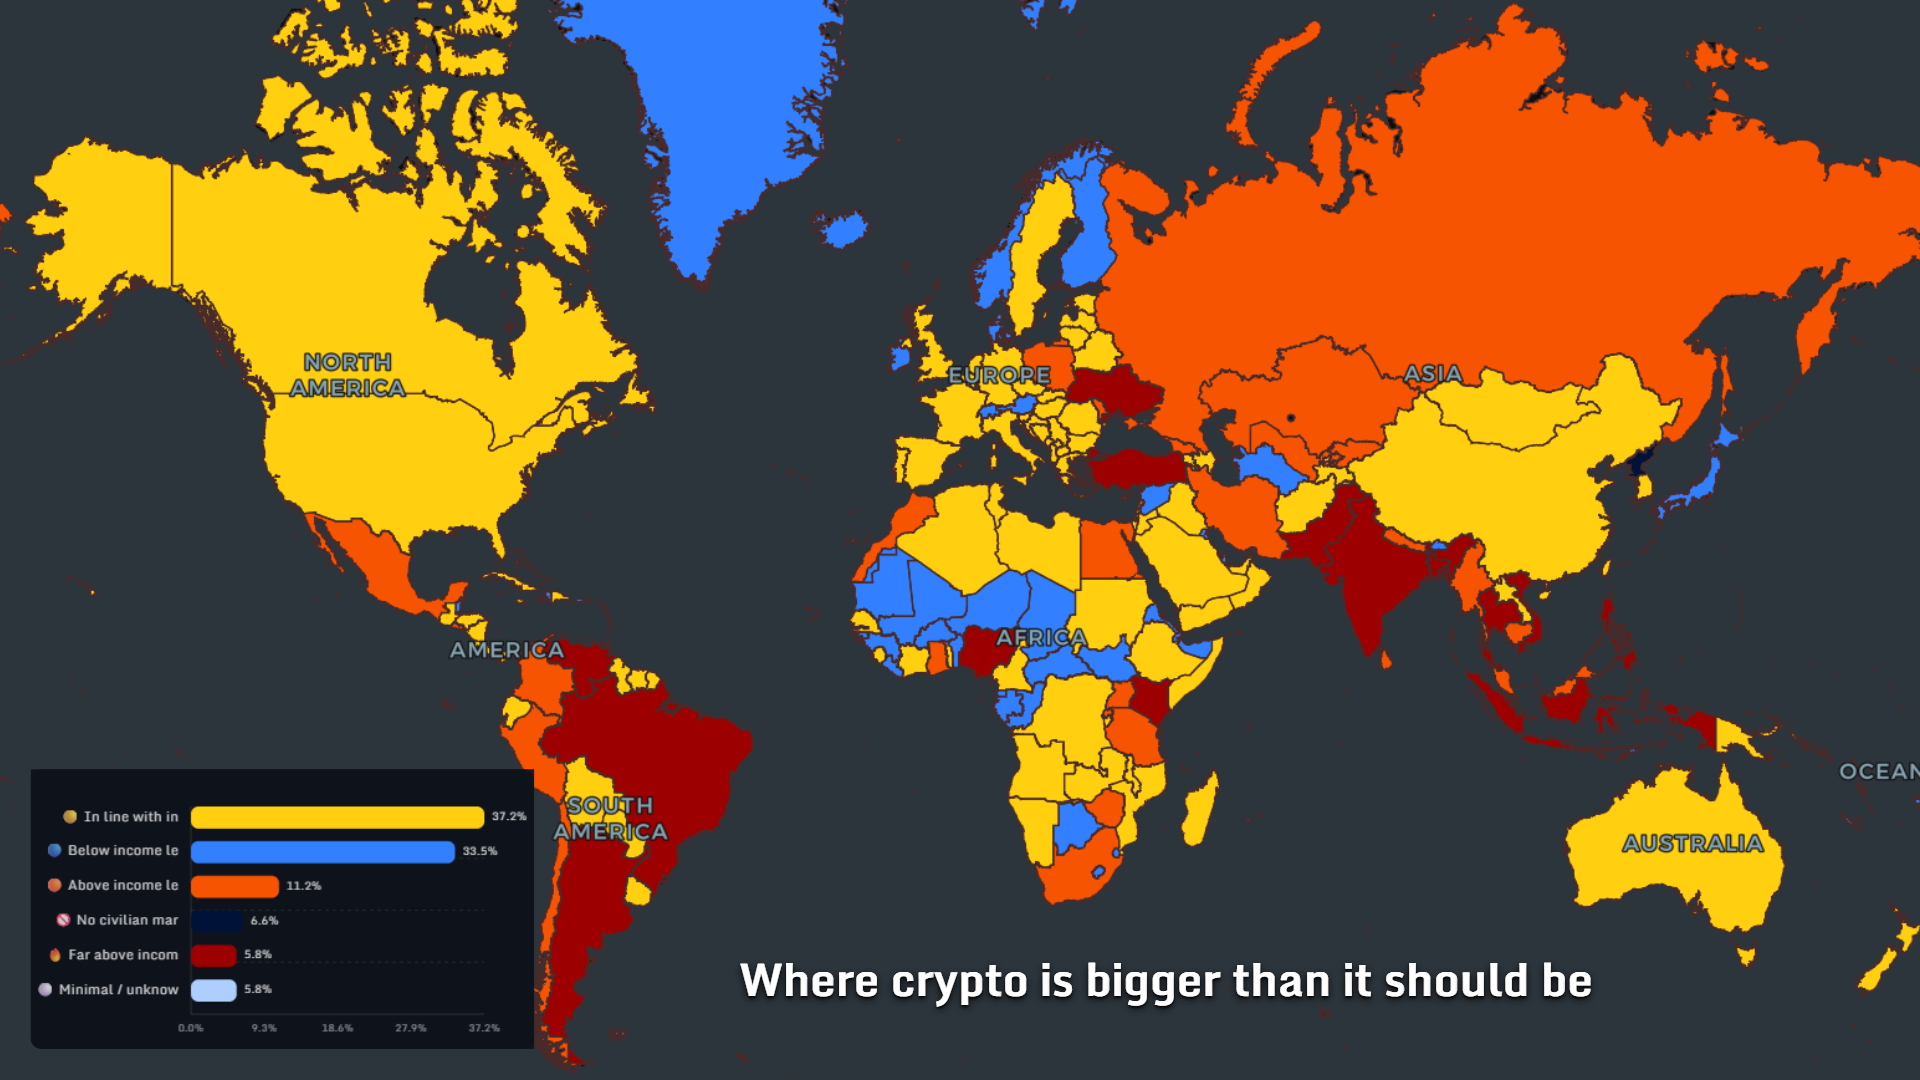
In plain English: some countries use more crypto than their income profile would predict. That is where social need, remittances, inflation pressure, mobile-first finance, and distrust in institutions start to reshape the map.
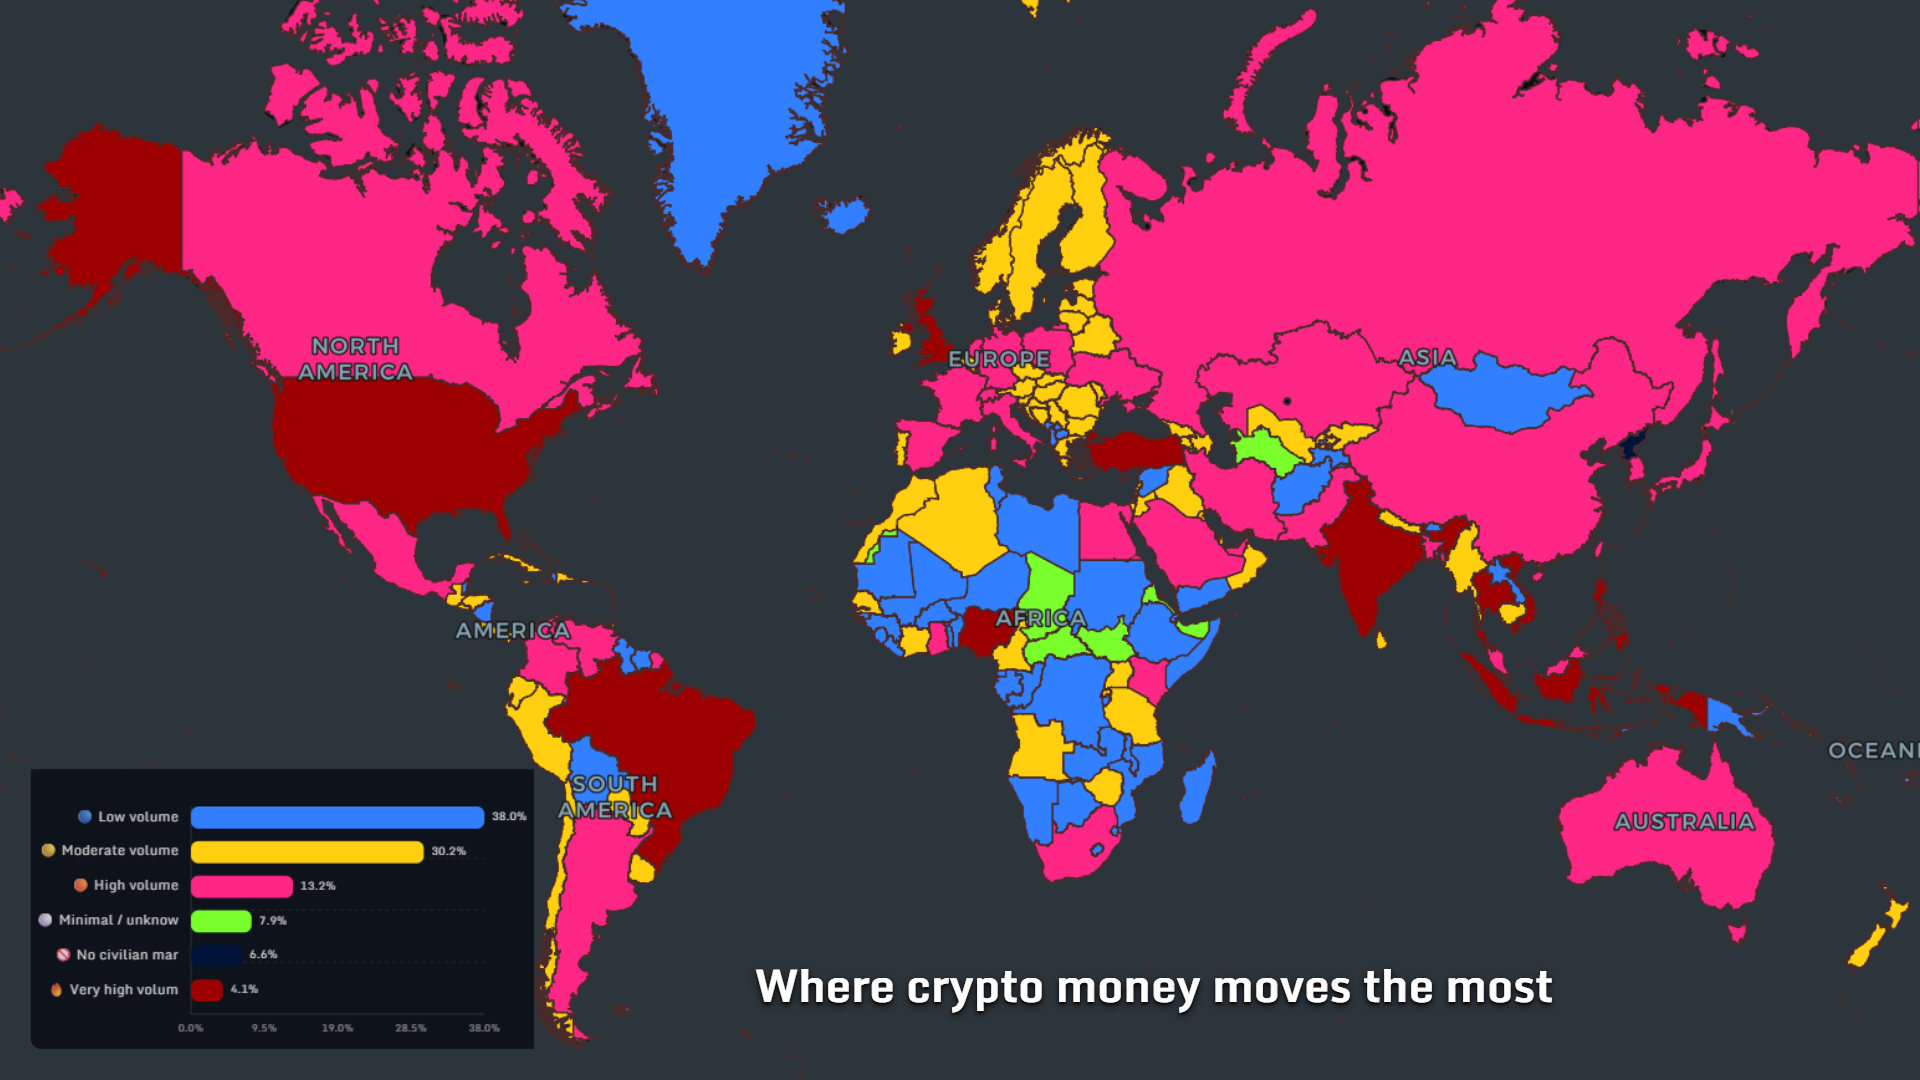
Where crypto money moves the most
Transaction volume tells a different story from adoption. Low volume countries still dominate at 38.0%, but moderate volume follows closely at 30.2%. High and very high volume countries are fewer, yet they mark the places where crypto has moved from curiosity into infrastructure.
A country can have many crypto users without huge volume. Another can have fewer users but massive flows. That distinction matters for analysts, journalists, and anyone reading global crypto trends beyond headlines.
Where crypto is exploding right now
Growth is the forward-looking map. Moderate growth leads with 38.4%, while slow or stable adoption covers 28.1%. The fastest-growth countries are smaller in share, but they are the places to watch.
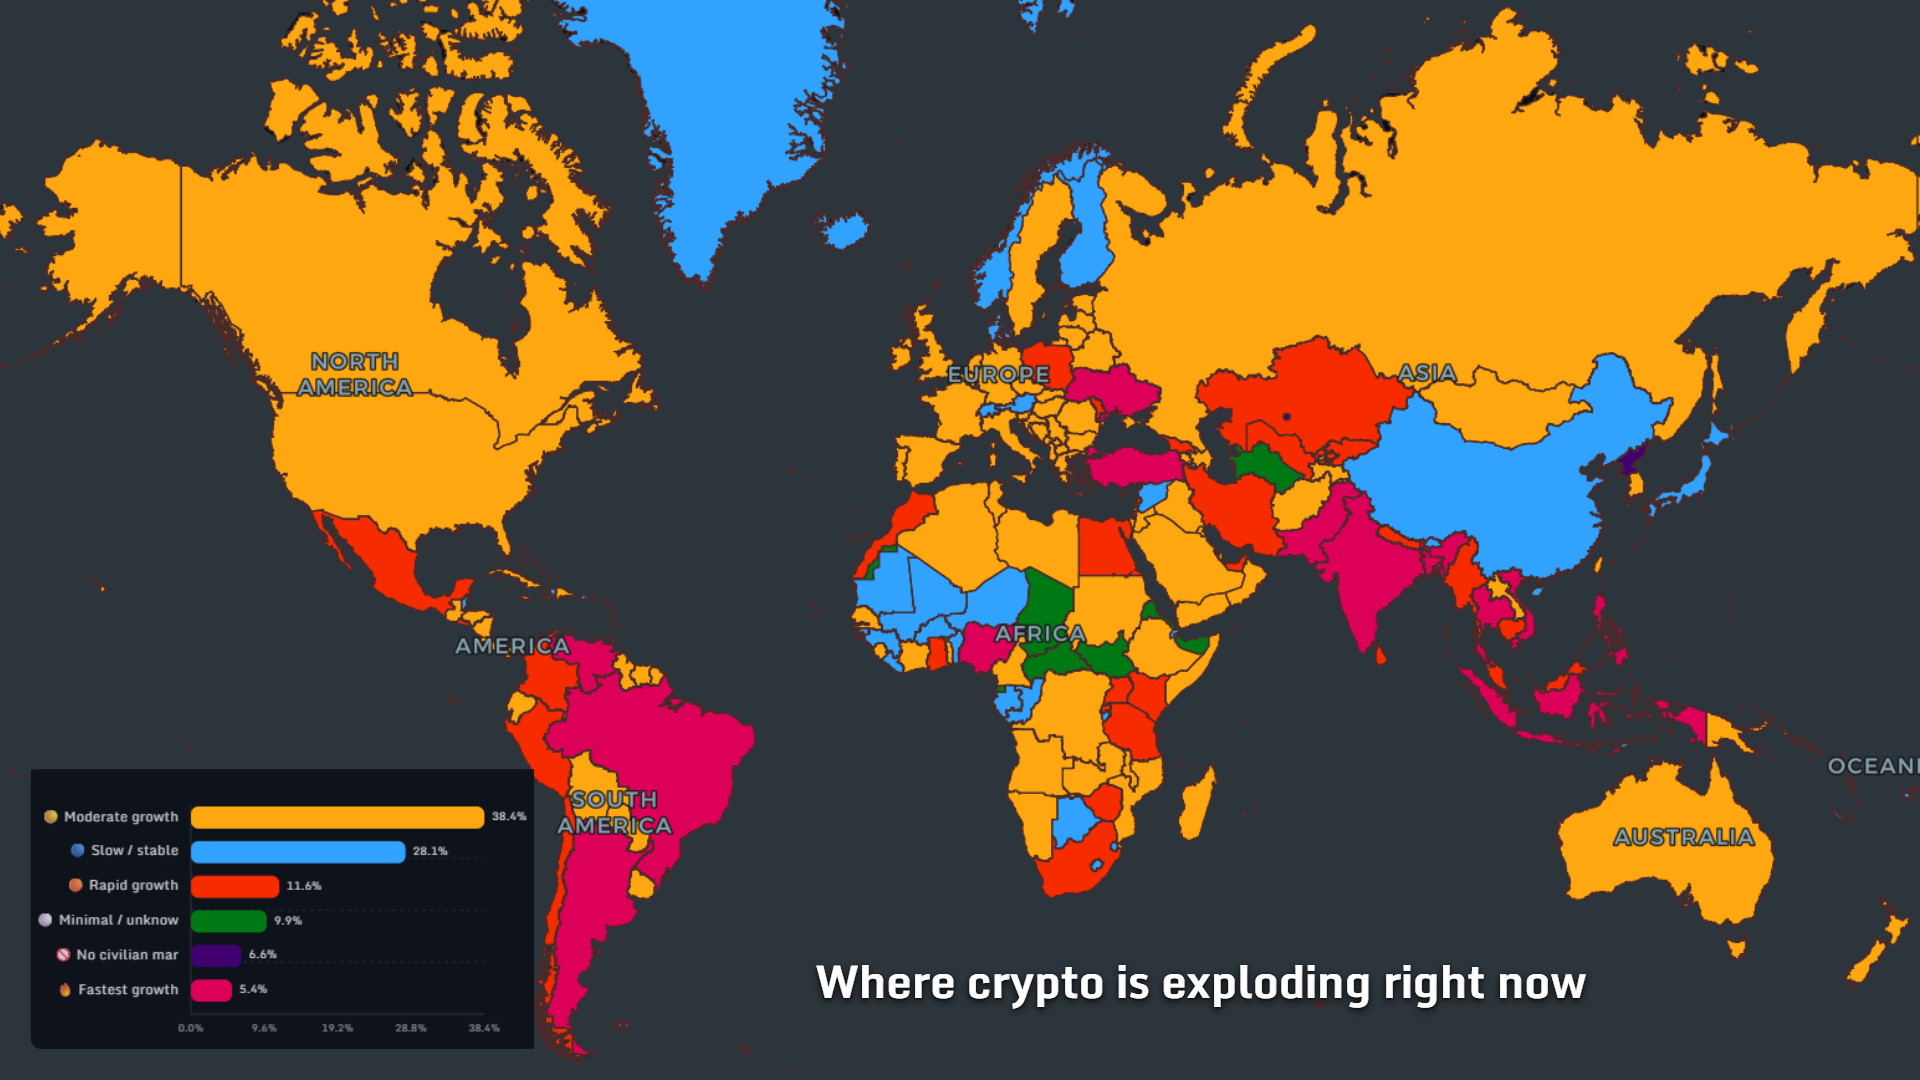
The next wave of crypto adoption is not evenly distributed. It clusters around necessity, youth demographics, mobile payments, cross-border work, and local financial stress.
Where crypto is not just for investors
Retail usage changes the meaning of crypto. In this map, moderate retail represents 35.5%, while low retail is close behind at 34.3%. High and very high retail activity remain smaller, but they show where crypto is entering everyday behavior.
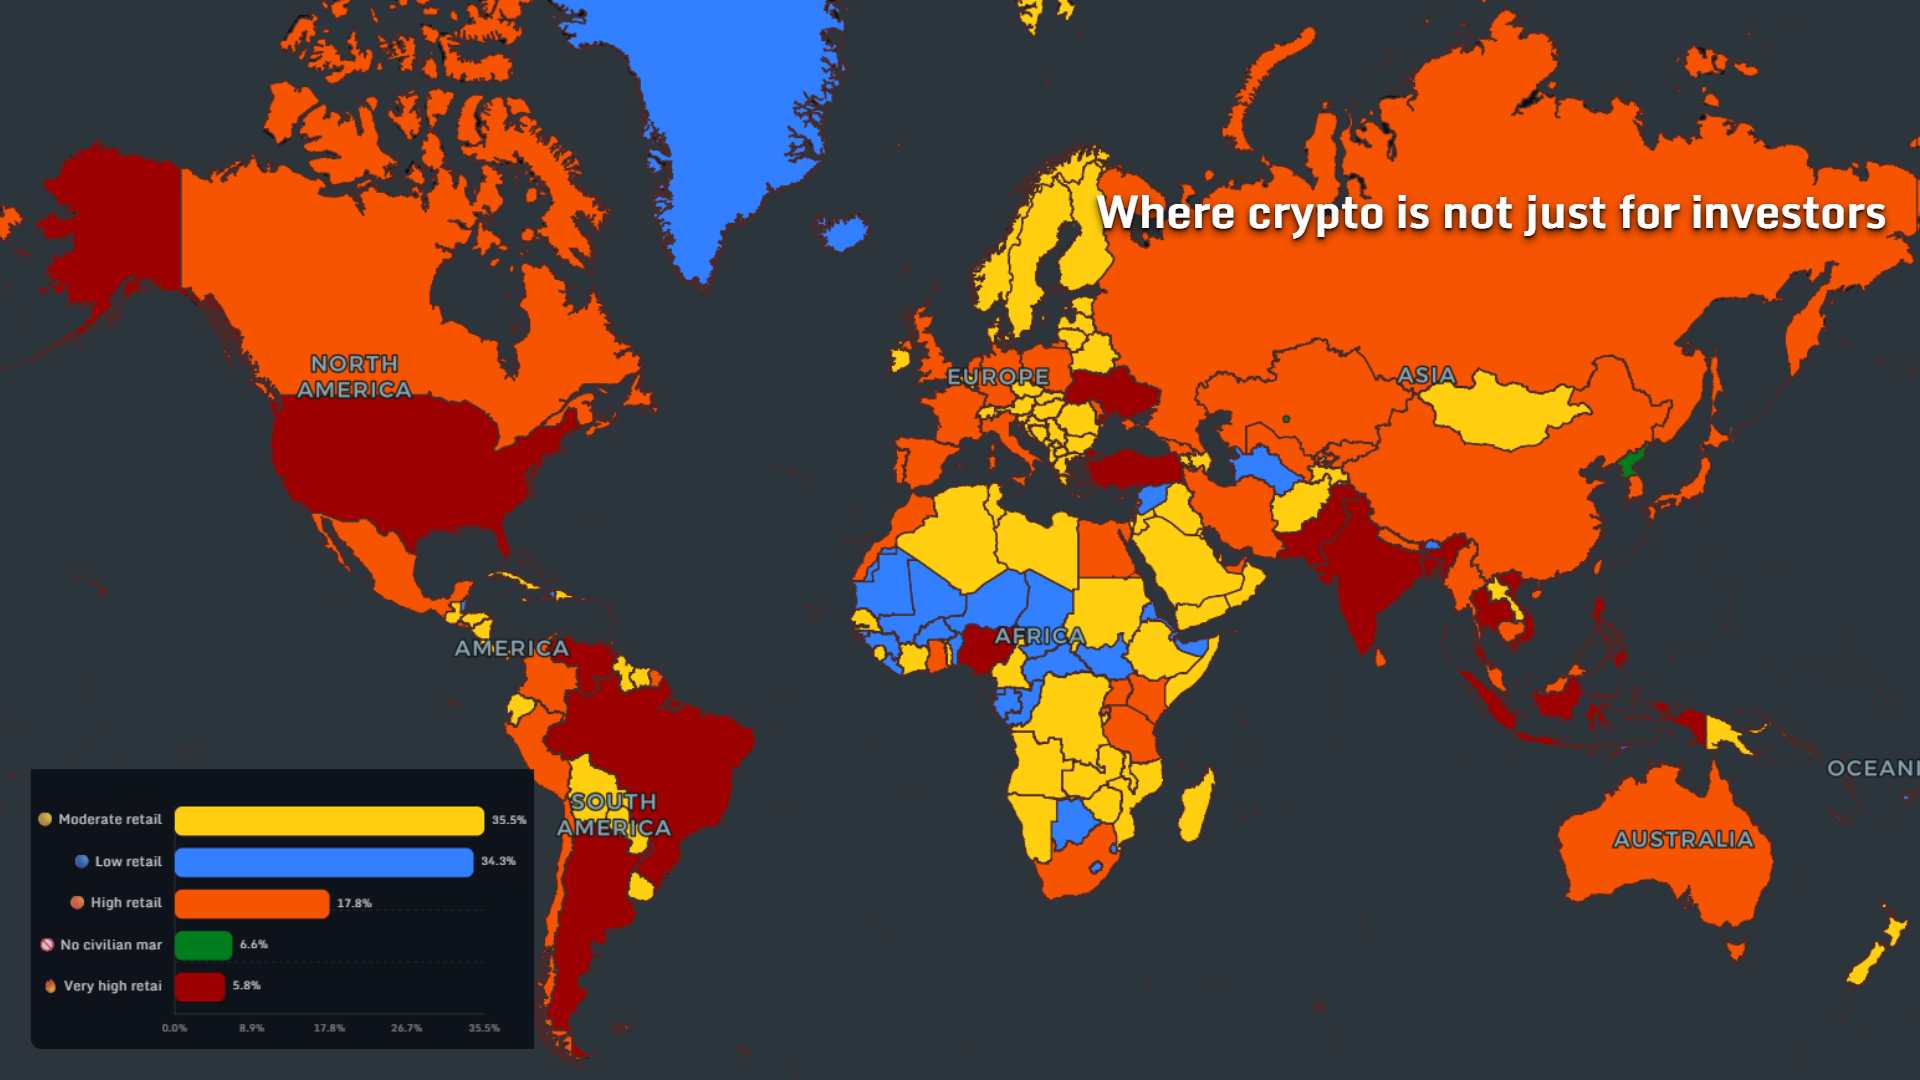
This is the line between “holding an asset” and “using a tool.” In 2026, that line is one of the most important crypto adoption signals by country.
Where crypto took off beyond the rich world
The final map shows that crypto adoption is not only a rich-world phenomenon. The largest categories are not emerging / weak at 27.7% and moderate emerging adoption at 26.9%, while low emerging adoption still accounts for 21.9%.
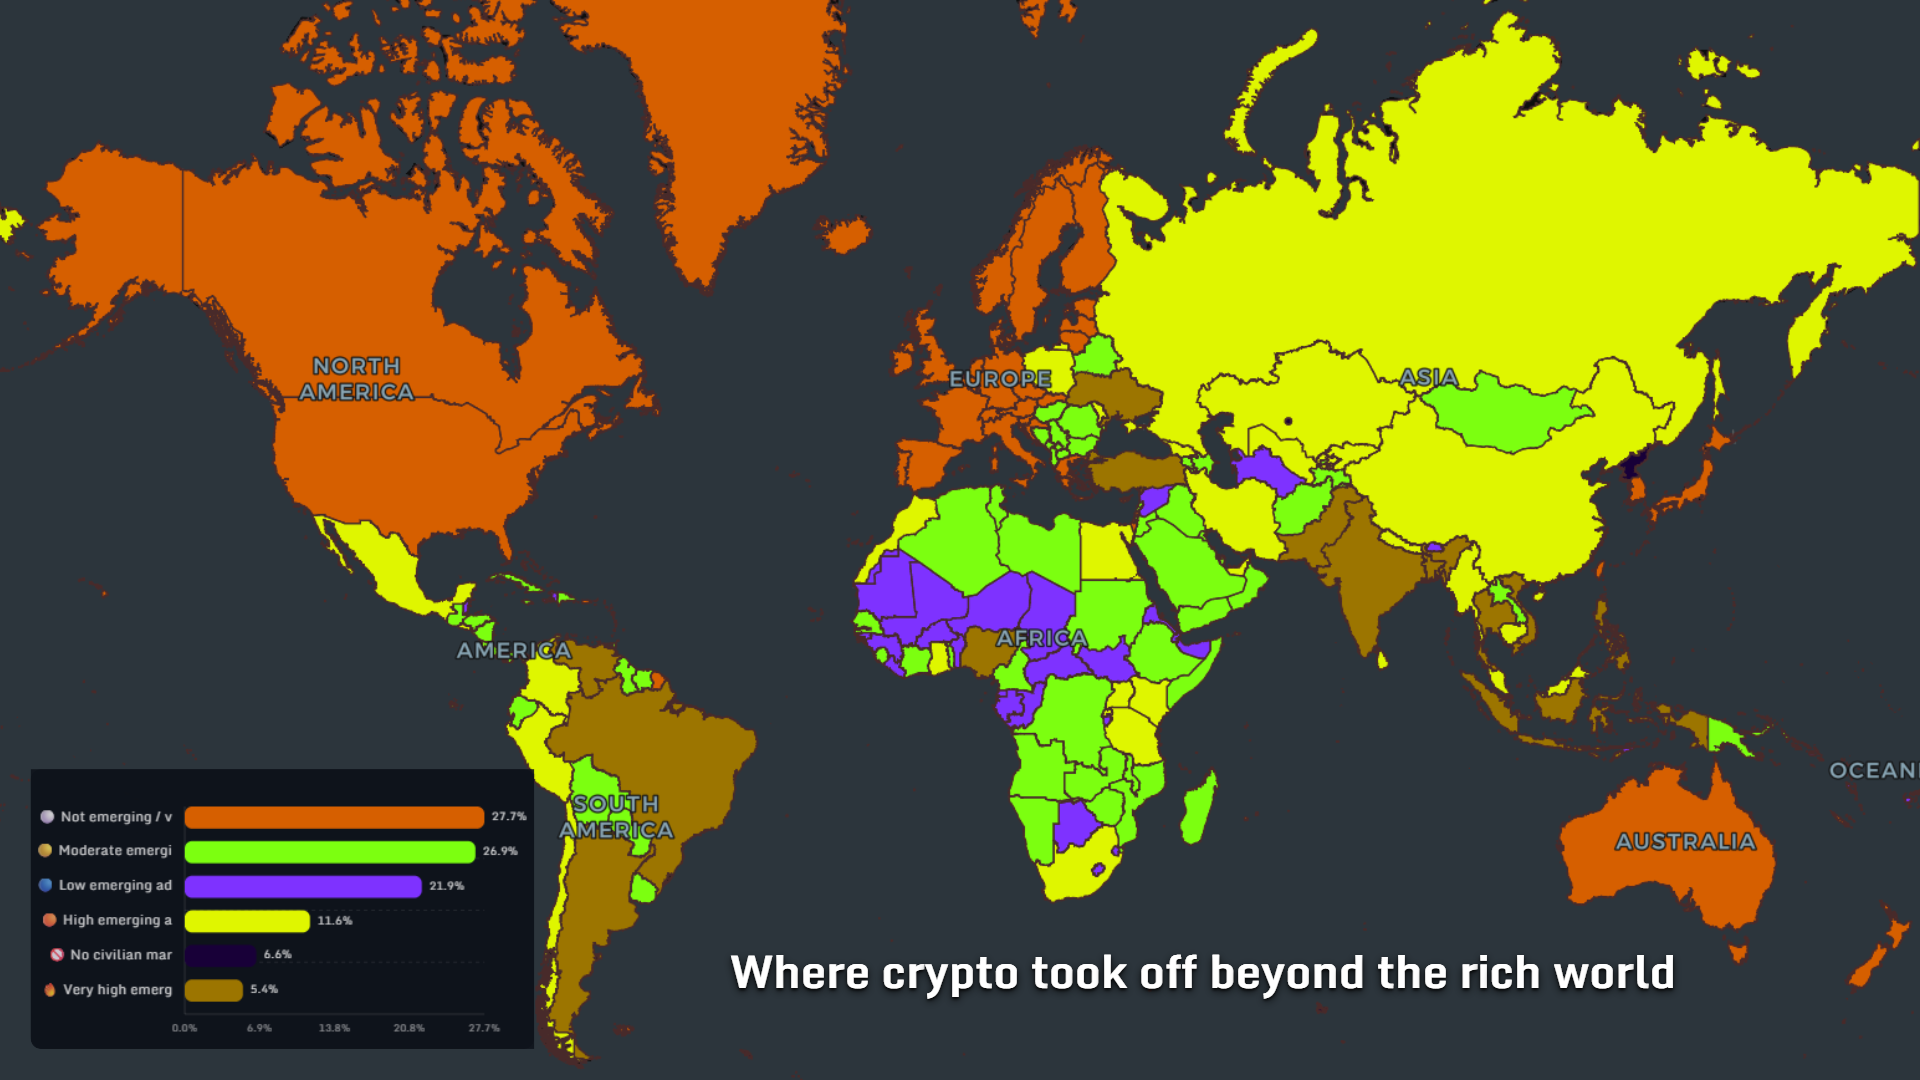
Crypto did not spread equally. It spread where it solved something. Sometimes that problem was access. Sometimes inflation. Sometimes remittances. Sometimes distrust.
What the 2026 crypto map really says
The global crypto adoption map 2026 is not a map of hype. It is a map of financial pressure, workaround culture, and uneven trust.
The richer world often treats crypto as an asset class. The emerging world often treats it as an escape hatch. And somewhere between those two stories, the future of digital money is being written.
MAPTHOS helps turn these patterns into visual stories — maps that make global trends easier to see, compare, and explain.
👉 Explore more at app.mapthos.org
See the world. Map better. Dream big. 🌍✨